Team:Valencia Biocampus/modhp
From 2012.igem.org

Modeling for Human Practices: The secret files
Students from our Human Practices subteam found out that two years before releasing their last product, the Talking Life Device, Talking Life Technologies started to carry out a high number of secret experiments regarding the safety of their uprising new sensing-bacteria. These controversial results have just been released two days ago! Click on the image below or in this link to read the complete version of their report!
 |
 |
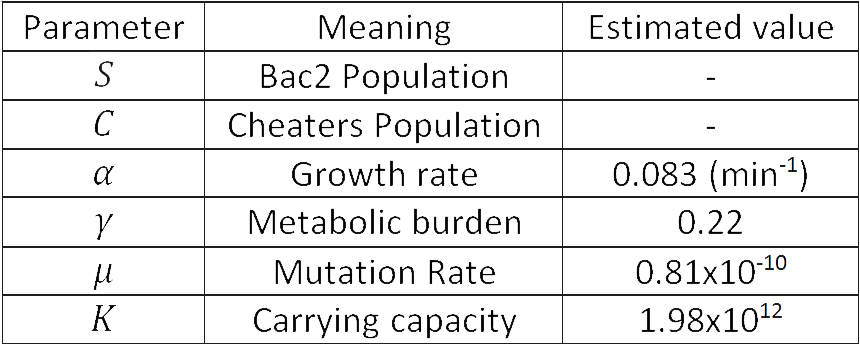
After analyzing it, we realized that these equations and the parameters used belong to previous studies done in 2010 (1). Since we wanted to test whether these results were true, we have also carried out our own experiments (Table 1) to determine the best data to use and check the possible outcomes. Let’s model Human Practices!
| Table 1. Data from different sources used to modelllize the population dynamics. *Data obtained after several experiments with a cheating plasmid and with no plasmid at all. |
 |
After using our own data the population dynamics we obtained is similar to those from Talking Life Technologies (Figure 4), confirming the worst-case scenario:
 |
| Figure 4. The evolution of both cheater and secretor ("honest") populations using our own data. |
So, how could this big company have done something like that? Is our health under their control?
Experimental evolution prediction from the model
With the model proposed by Frank [1], with some changes to meet our experimental setup, we obtained the folowing system of ODEs
And after the parametric identification of the system with SSm algorithm, with data from the experimental evolution, we get values for the model parameters.
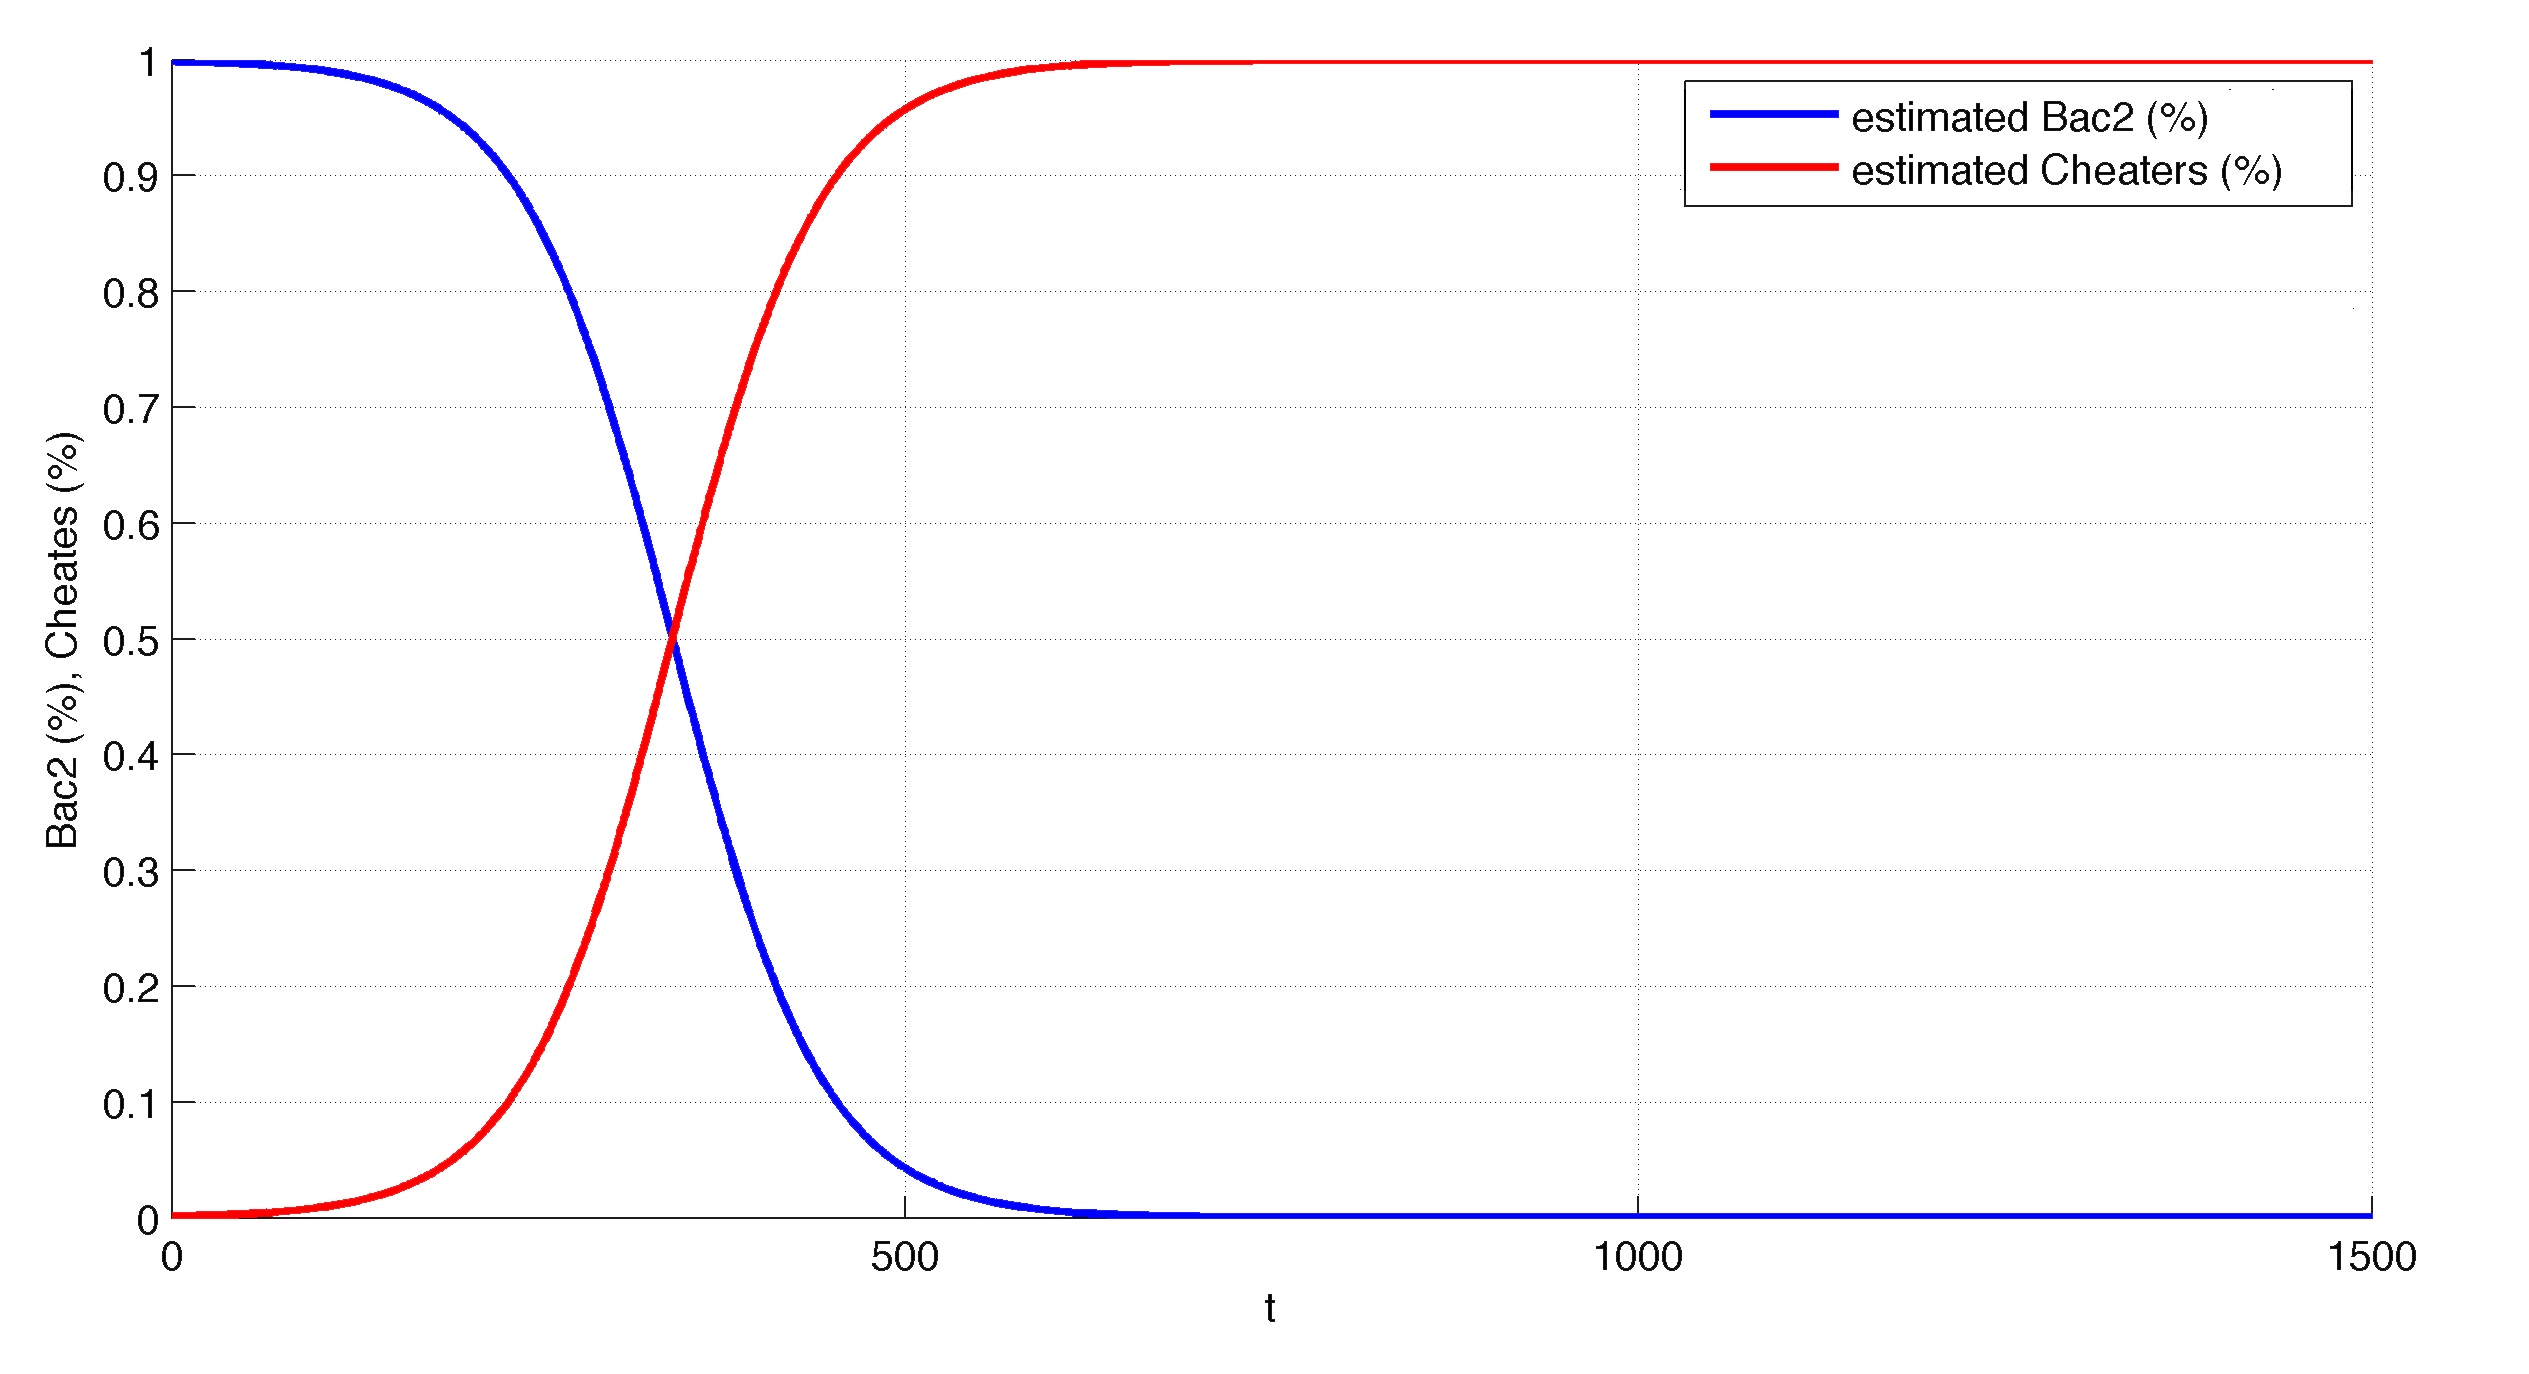
Then we made a simulation experiment to see what happens when we start with no cheaters. In figure 5, we can see the predicted time evolution of the Bac2 and cheaters population.
| Figure 5. Model prediction of Bac2 and cheaters evolution. |
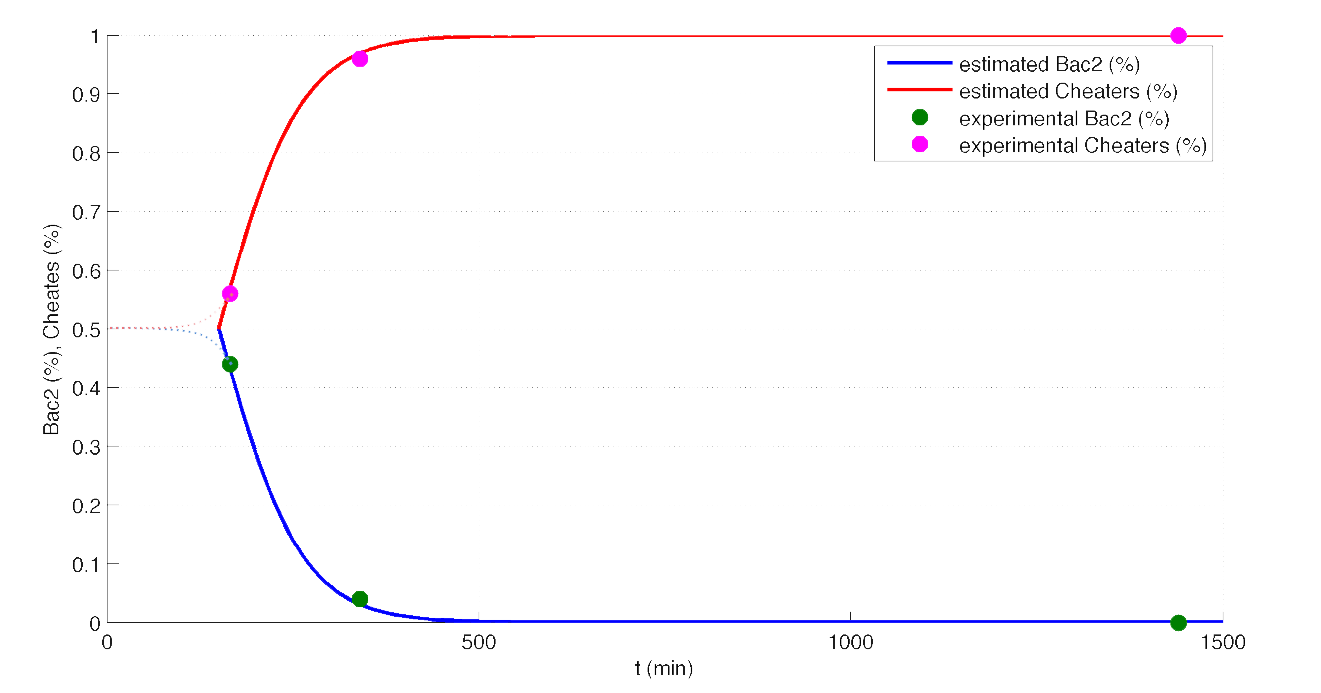
If we look what happens from the 50% and 50%, we se that the shape of the curve coincides with the one obtained in the expeirmental evolution. The time scale is no accurate, but still the model is able to capture the nature of the cheaters ability to substitute the honest Bac2 bacteria under selection pressure.
| Figure 6. Matching in the tendency of the model and the experimental data for evolution of Bac2 and cheaters. |
References:
[1] Frank, A. (2010) Microbial secretor−cheater dynamics. Phil. Trans. R. Soc. B 365, 2515-2522
 "
"


