Team:Calgary/Project/OSCAR/FluxAnalysis
From 2012.igem.org


Hello! iGEM Calgary's wiki functions best with Javascript enabled, especially for mobile devices. We recommend that you enable Javascript on your device for the best wiki-viewing experience. Thanks!
Flux-Variability Analysis for Optimization
Flux-variability analysis (FVA) was applied to optimize the bioreactor system of OSCAR for the newly incorporated metabolic pathways (Decarboxylation, Decatecholization, Desulfurization, and Denitrogenation). FVA combines the framework of metabolic pathways with experimental enzymatic data to provide a computational platform for predicting what changes in metabolite levels will result in increased end-product. We developed a model using MATLAB computer language for predicting what metabolites could be added to your growth media to increase production of hydrocarbons in the E. coli chassis. We also created a graphical user interface called the OSCAR Optimizer to make the the FVA program user-friendly and to allow current and future iGEM teams/scientists to input their own synthetic pathways into the FVA for analysis. Finally, we validated this model in the wet-lab by optimizing the PetroBrick (BBa_K590025) system to increase hydrocarbon production, thereby saving time, and resources.
Click here to download the MATLAB package to test our model!
Click here to view our OSCAR Optimizer Manual.
Background
What is Flux Analysis?
Flux Balance Analysis (FBA) uses linear programming of metabolic networks to convert each metabolite into a mathematical coefficient. These coefficients can be connected to each other by changes associated with each enzymatic step of the pathway. FBA can then apply a mathematical method to examine how metabolites relate to each other in the network and allows the user to make generalized predictions for the growth of the organism, metabolite levels, and product output inside the cell. Flux Variability Analysis (FVA) is an extension of FBA that determines the range of reactions that result in an optimal flux through the metabolic network. Unlike FBA, this allows the user to not only determine the most optimized network for increasing cell growth, but also other parameters like product output.
What are the constraints in the FVA model?
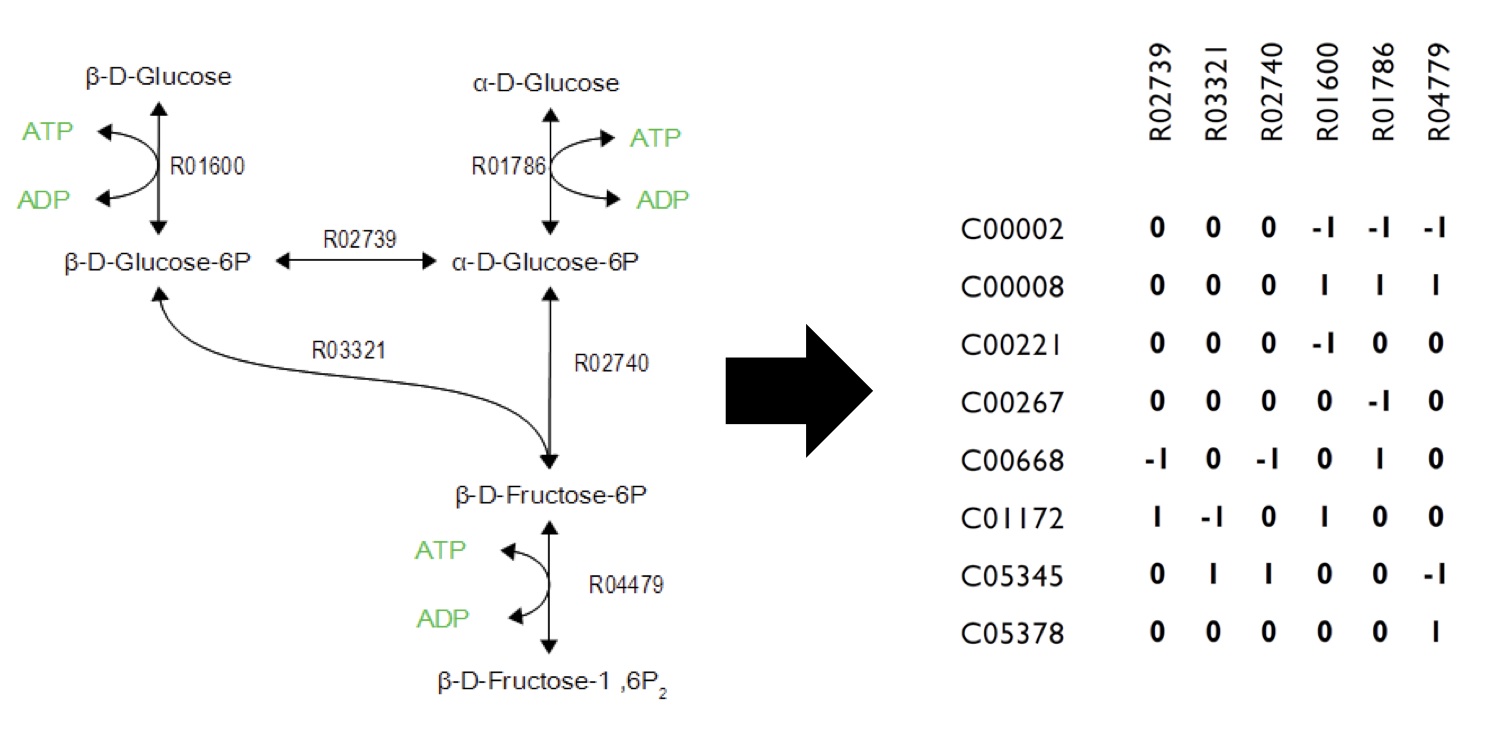
As illustrated in Figure 1, metabolic networks can be encoded as stoichiometric matrices, in which each row represents a specific metabolite and each column represents a biochemical reaction. The entries in each column represent the stoichiometric coefficients of the metabolites in the reaction. Metabolites that are consumed or produced have a negative or positive, respectively.
Why use FVA as opposed to FBA?
Biological systems often contain redundancies that contribute to their robustness. However, FBA only returns a single flux distribution that corresponds to maximal bacterial growth under the given growth conditions, even if other optimal parameters may exist. FVA is capable of examining these redundancies by calculating the full range of numerical values for each reaction flux in a network. Thus, FVA can be employed to study the entire range of achievable cellular functions, as well as the redundancy in optimal phenotypes. FVA can also examine different ranges of bacterial growth vs. product output which is valuable in assessing validity of models in the wet-lab.
Using FVA to optimize OSCAR
What Are We Trying To Model?
FVA provides a method to modulate the inputs of endogenous metabolic pathways, but could also investigate what chemicals are needed in the growth media to upregulate an introduced pathway in E. coli. In the latter case, we need to specifically model the flux rate of metabolic pathways responding to different growth media conditions and generate an optimal set of metabolites that should be added to improve production rate. Development of a tool to model the optimal flux would also benefit numerous iGEM teams and research labs who engineer bacteria with novel pathways.
How could systems like OSCAR benefit from this model?
Much like chemical reactions which need optimal environmental conditions to achieve maximum production rate, microbes require certain conditions to accomplish cellular tasks at maximum speed. During industrial scale up, the optimal conditions for production needs to be maximized to reduce cost of production to a minimum. Conditions in the microbial bioreactor systems are more crucial than chemical synthesis reactors ⎯ simply due to the increase in simultaneous reactions occurring. Furthermore, the selection and concentration of compounds in the growth media can severely affect the growth rate. If a computational model can predict an optimal set of metabolites for media composition, this will save time, resources, and funds.
How does the program work?
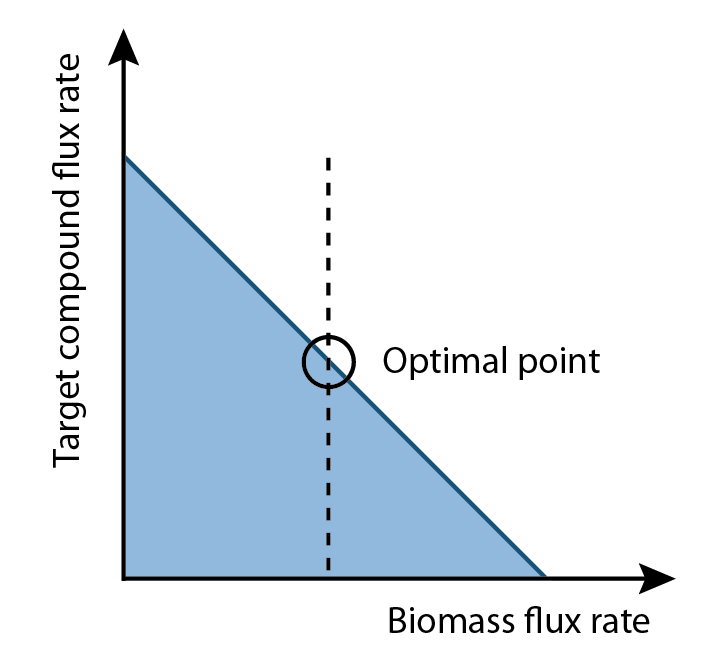
Our program is built upon flux variability analysis applied by the functions in the Cobra Toolbox. It uses the published E.coli iAF1260 and E.coli core models provided from the Systems Biology Research Group (Dr. B. Palsson) at the University of San Diego. Using this as a base, we constructed reactions and metabolites for the hydrocarbon production components of OSCAR. Specifically, new reactions corresponding to the PetroBrick as well as the upgrading (desulfurization and denitrogenation) pathways were engineered into the E.coli base chassis. Running FVA will give an output correlated to a optimized growth rate. Moreover, this FVA algorithm running at optimal biomass flux rates can provide a range of outputs for your product of interest (Figure 2). This allows the user to select an optimum point where compound production is maximized. Finally, the program will analysis the data with an algorithm to generate a set of media compounds that is expected to accelerate production rate.
Algorithm
Conceptualization
FVA can determine the full range of numerical values for each reaction flux within the network. Additionally, it allows for a broader analysis of growth and production rates compared to FBA. Since biomass rate reflects the growth condition, cells must have a positive biomass flux rate to survive and proliferate. This positive value is indicative of a real cellular system since cells prefer to have increases in growth rather than increases in product output; however, our goal is to increase the production flux rate above a zero value. Therefore, among all the possible set of fluxes, the optimal flux is located where growth and production rate are at the optimum point for cell survival and compound output.
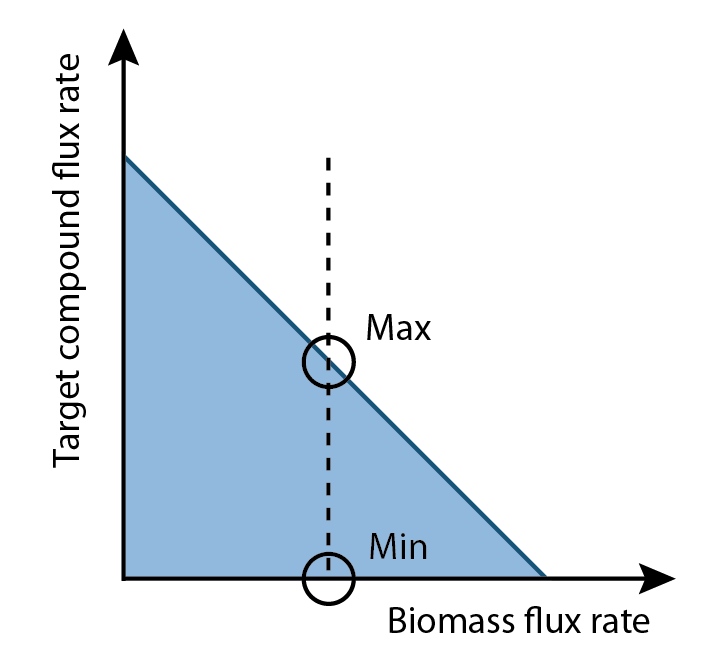
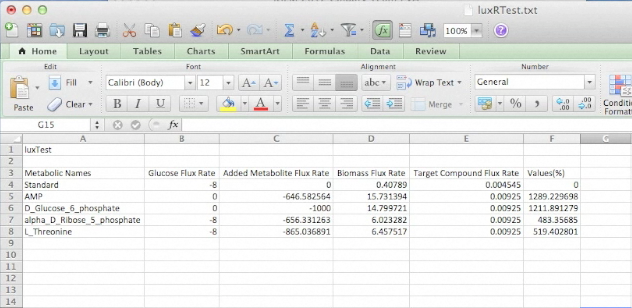
Differences between the maximum and minimum production rates are compared for each reaction in a set of fluxes. Reactions that demonstrated higher flux in the maximum production rate versus the minimum production rate represent metabolites that could be increased to increase overall product output (Figure 3). This analysis generates a list of compounds that should increase product output if increased in concentration in the growth media.
Note that not all compounds can be imported into the cell. Hence, only the metabolites that have native transporters in E. coli were considered for wet-lab verification. We used a model based on glucose minimal media; however, this could be applied to any media type.
Flowcart of the Model
Disclaimer: Original model built using minimum media with glucose.
1. Define relationship between growth rate and production rate.
2. Find out the optimal growth rate that can maximize the production.
3. Get the differences in percentage of flux rate for each reaction between production maximum and minimum set.
4. Collect all reactions with different percentages between two sets that exceed the user input threshold. (The input threshold determines the size of the difference in flux that the user is interested in. We used a 100% difference in our model.).
5. Score each compound in all collected reactions, with the initial score of zero for each compound (Scoring is determined by the difference in the value of a particular compound when the flux sets of the desired compound production are maximized and minimized as determined by FVA). This process is additive if the particular compound is found in more than one reaction (i.e., ATP) and only includes the reactions identified from step 4.
6. Determine whether compounds with positive scores have natural transporters in cell. If so, mark the compound as candidate.
7. Add each candidate to the growth media and the run FVA under optimal growth rate computed in Step 2. Compare the production rate from novel model (step 7) to that from the raw model (step 2), if the rate is improved, mark the compound as an effector.
Graphical user interface (GUI) development - Creating OSCAR Optimizer
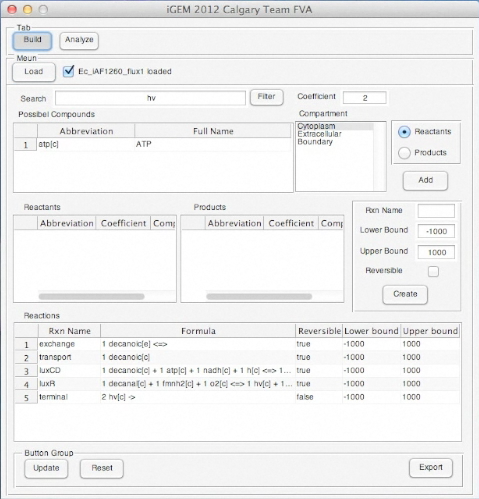
The GUI allows for easier use of our program by everyone in iGEM and beyond. This will enable individuals to use our program who are inexperienced with programming programs such as MATLAB and/or the Cobra Toolbox. We developed the GUI using the GUIDE program designed in MATLAB. For more information please see our manual.
Code
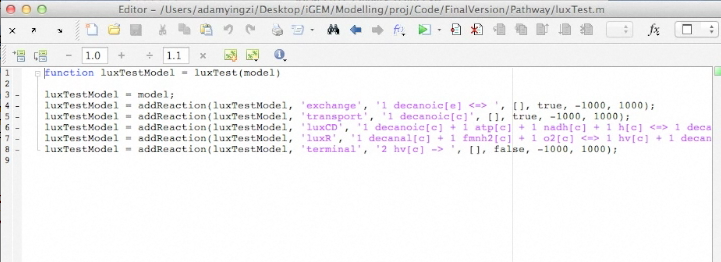
This application is a Matlab extension that runs on top of the Cobra Toolbox and SBML Toolbox. To run the application, one must have the Cobra Toolbox and SBML Toolbox installed. SBML Toolbox can download from SBML.org or here. Cobra Toolbox can download from openCOBRA or here. Application Package and source code download .
Demo
Below is an uploaded tutorial to show anyone how to use the GUI of the OSCAR Optimizer. The GUI interface allows for easy building of different synthetic constructs into the E. coli network but this could based on any model from any organism that is available in SBML format.
Screen Shots of Our Application
Wet-lab validation of OSCAR Optimizer
We tested our OSCAR Optimizer FVA Model in the wet-lab by assessing if a suite of identified compounds would increase the output of the Petrobrick. Therefore we ran the model with the AAR and ADC gene components of the Petrobrick system and looked at the predicted metabolites for growth media supplementation (Figure 5).
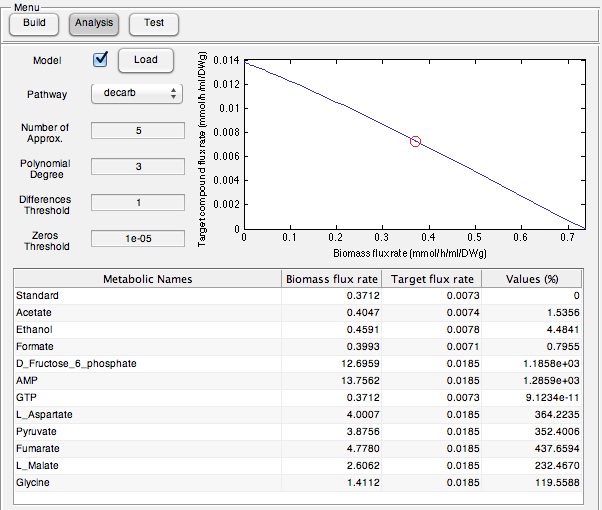
Once these compounds were identified, we set-up an assay where we supplemented minimal M9 media and glucose with each of the compounds alone, or in combination. Compounds were added at concentrations of 50 mM except for Ethanol (2.5% v/v), AMP (100mg/L), and L-aspartate (100mg/L). As a positive control, instead of using minimal media a solution of 50:50 LB:Washington Production Media (see 2011 iGEM University of Washington Protocols ) was used to represent normal production. Additionally, we found that the compound formate was predicted to NOT increase hydrocarbons production and this represented a chemical negative control. All compounds were added to E. coli culture containing the PetroBrick at an OD600 of ~0.05 in the first experiment, and a higher OD600 of 0.400 for the second experiment and grown for 72 hours at 37oC. Cultures were then sonicated after an OD600 measurement and any produced hydrocarbons were extracted by 1 mL ethyl acetate. This was quantitated based on the peak area of a C15 hydrocarbon product as described in the Decarboxylation section (also see Protocols for relevant procedures). The tabulated results of the quantitated yields are shown in Figure 6.
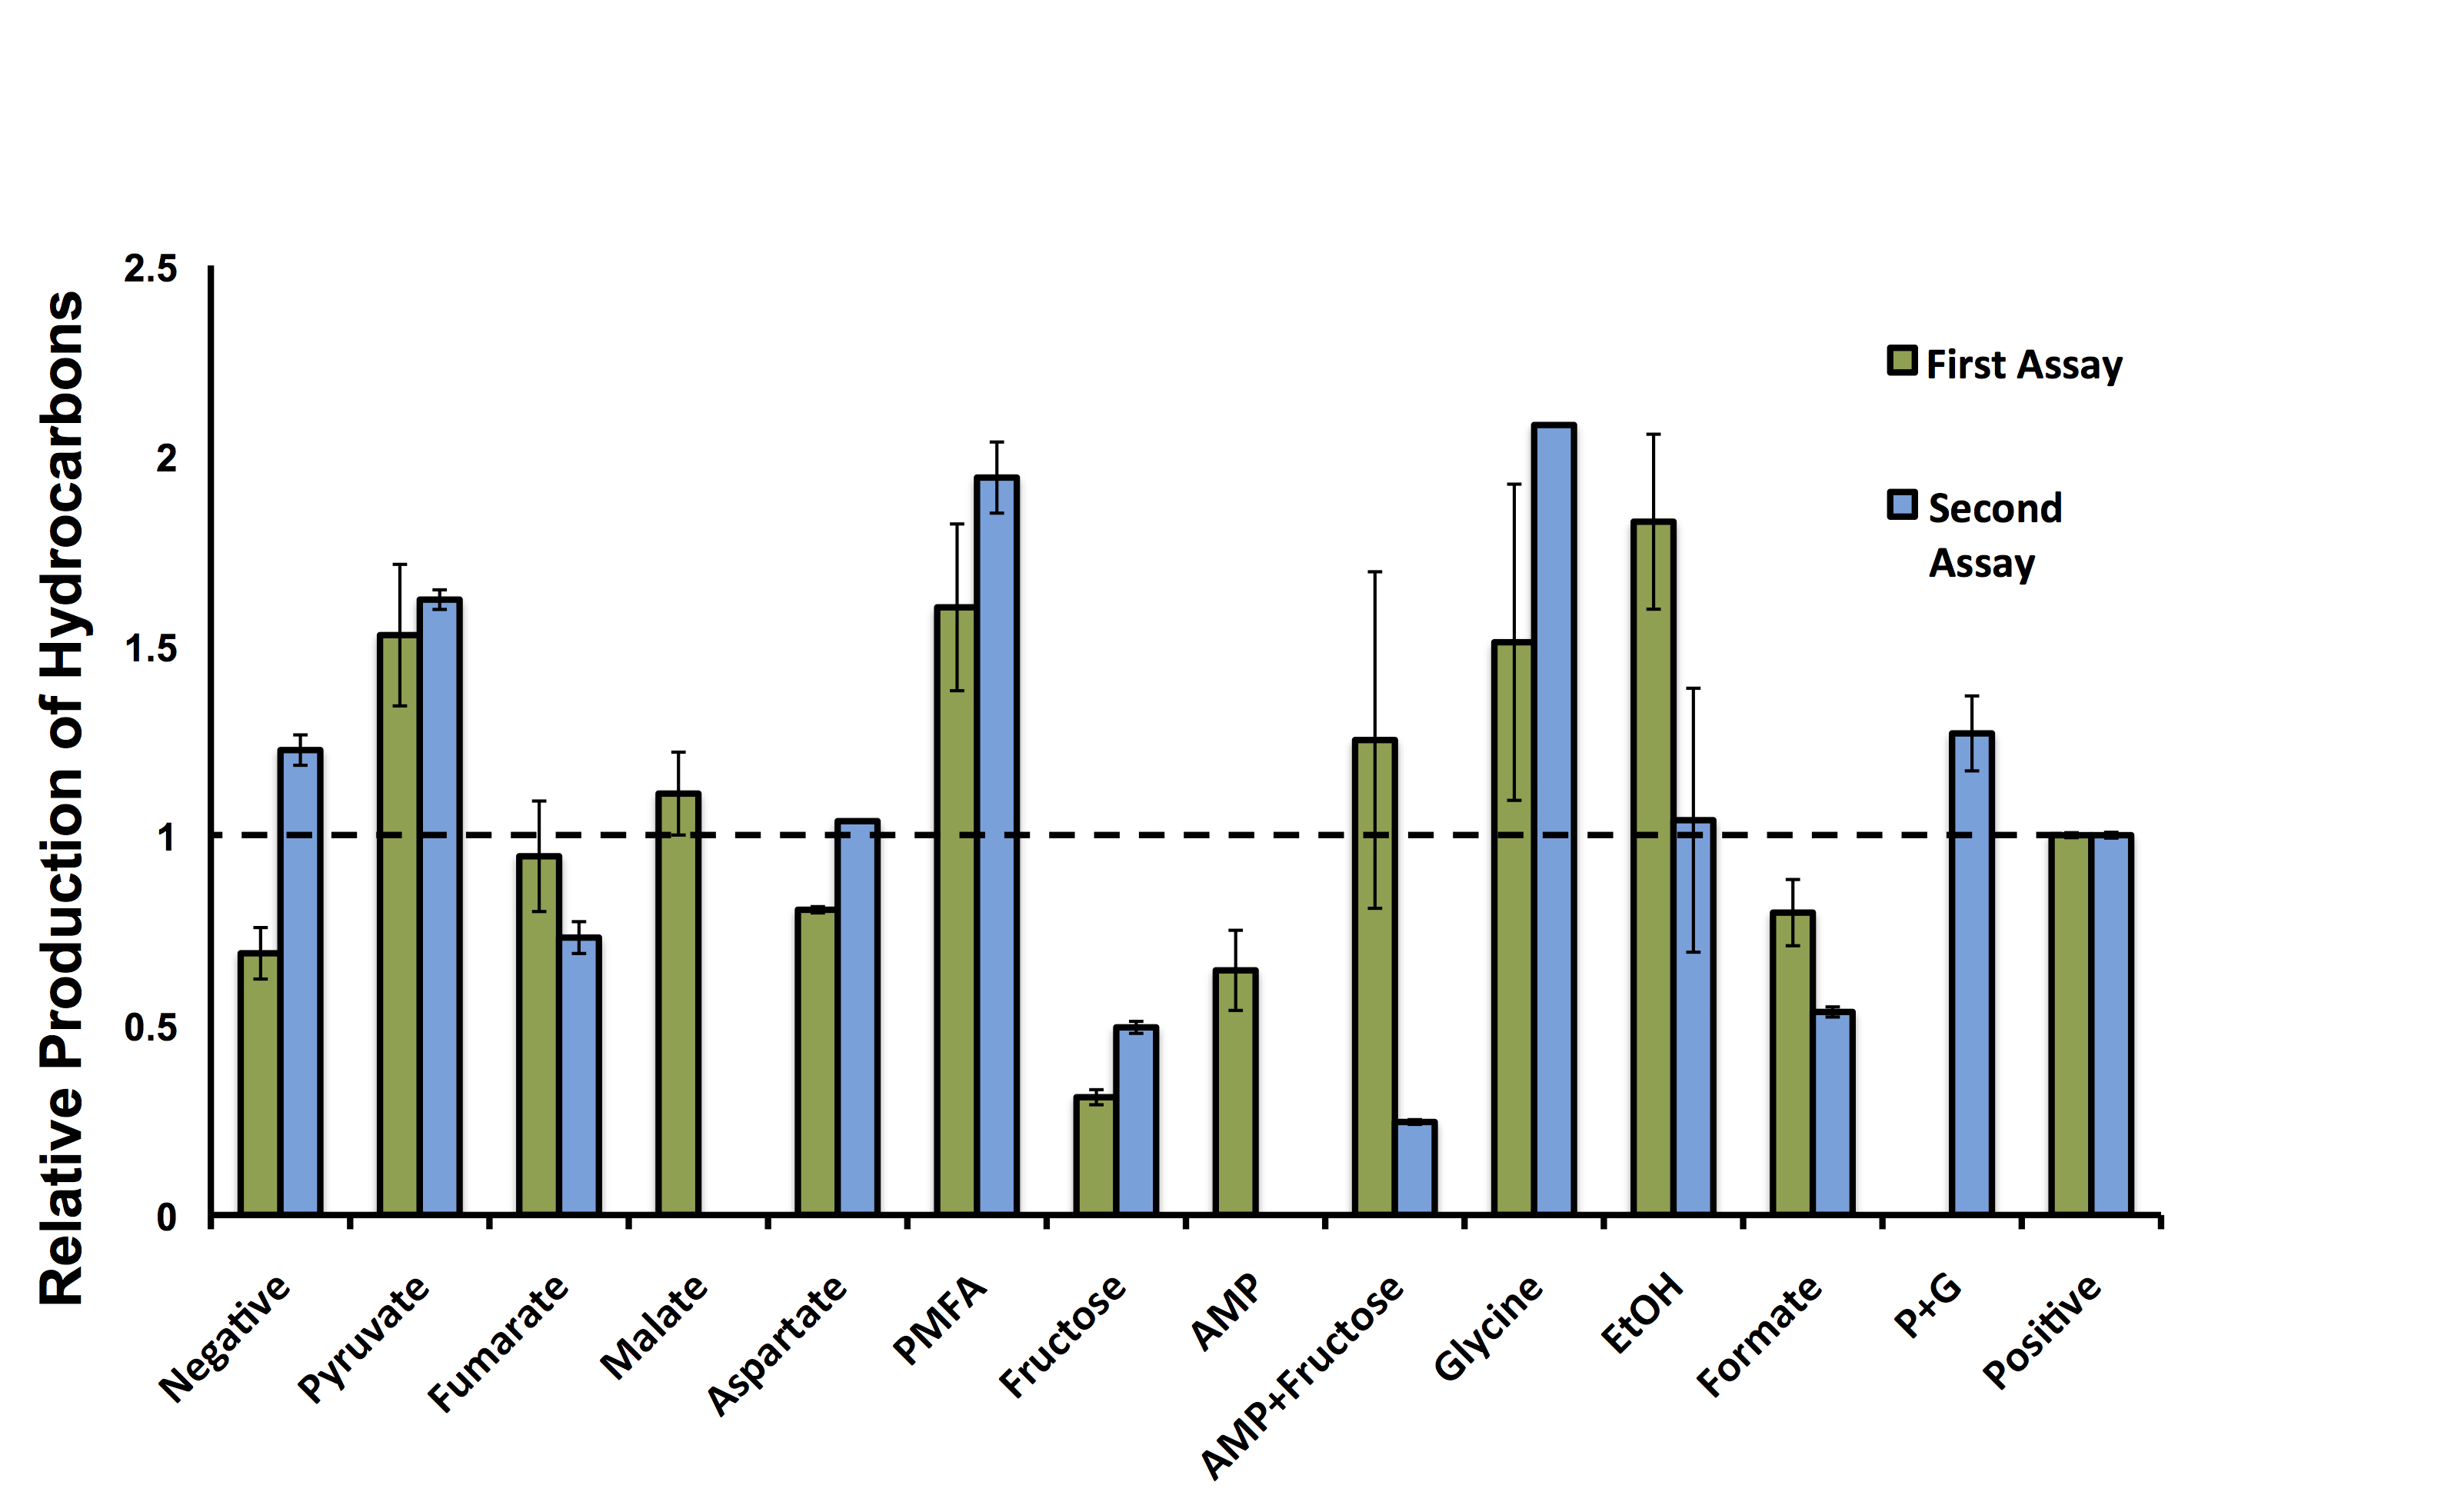
These hydrocarbon production results indicate there is variability in the output of hydrocarbons from the PetroBrick with different compounds (Figure 6). Interestingly, five of the compounds demonstrated production levels higher than that of the minimal media control, suggesting our model could be used for predicting compounds to increase metabolite production. Although, AMP and fructose both decreased output despite having the highest predicted increases in hydrcarbon output, suggesting that our model may produce false positives and there is some error in assessing these predictions. Most excitingly, addition of two compounds, pyruvate and glycine, had increased the relative number of hydrocarbons higher than the complex media of the positive control. As noted by the multiple experiments, there are some differences in the relative output of hydrocarbons in each experiment, however, the trend for each compound is relatively consistent for the different samples. Some of the runs were not able to be repeated in the second assay, which is the reason for some of the lack of data in Figure 6. These results suggest our OSCAR Optimizer model can optimize OSCAR (along with other metabolic systems); however, these predicted candidates need to be tested in the wet-lab to ensure the model is accurate.
Modelling informing our Killswitch
Although we had initially rejected the idea of a killswitch based on auxotrophy due to the issue of cost, the results of our model made us think that this might be more feasible than we had initially thought. As glycine alone in minimal media was able to give us higher alkane production than Washington’s production media, supplementing our system with glycine, achieving higher output may actually be feasible. We saw auxotrophy as a method of creating layers in our killswitch system, where we could use it in tandem with the inducible kill systems that we have already been developing. We obtained a glycine knockout stain of E. coli and have begun some initial characterization data. This was a great example of how our modelling project was actually able to inform other parts of our project. In order to validate that this system was feasible for use we performed three key experiments:
- Perform a glycine requirement assay to determine the survivability of the knockout strain in our minimal media's used with OSCAR <.
- Determine if the Petrobrick can be used with a similar activity as in the wild type strain
- Use the auxotrophic strain in conjunction with our killswitch to show that these can act together.
Click here to learn more about these assays.
Drawbacks
This application is built upon the Cobra Toolbox, and the SBML Toolbox. As a consequence, any flaws in the Cobra Toolbox and SBML Toolbox will affect this application.
In this program, pathways added to base chassis model (E. Coli iAF1260) which contains constraints that rely on the Stoichiometric Matrix (such as Stoichiometric Coefficients), lower bounds and upper bounds of reactions. These pathways lack genetic and enzymatic regulation, making the connections between reactions in the network much weaker than those in the wet-lab. These missing components may lead to inaccurate results.
At the current stage, our algorithm can only pick metabolites with natural transporters in cell. Therefore, many other intermediate metabolites are ignored. The algorithm has no power to trace the intermediate metabolites back to initial metabolites and take those initial metabolites into account. This model does not take into consideration rate limiting steps of reactions, toxic intermediate accumulation, or any form of regulation of the enzymes (e.g., negative feedback). The OSCAR Optimizer should act as a starting point to identify any limitation of available endogenous metabolites in E. coli to increase the starting compound levels of your synthetic circuit for optimal production.
Documents
Download the OSCAR Optimizer Manual for more information on how to use the program!
 "
"

