Team:Calgary/Notebook/FluxAnalysis
From 2012.igem.org


Hello! iGEM Calgary's wiki functions best with Javascript enabled, especially for mobile devices. We recommend that you enable Javascript on your device for the best wiki-viewing experience. Thanks!
Flux Analysis Notebook
Week 1-2 (May 1-11)
Flux Analysis is brought into the project as it can offer predictions of sets of compound that will be used in growth media to improve the output of target compound.
Week 3 (May 14-18)
This week involved planning of selection proper analysis, models and platform for modelling. The constraint-based reconstruction analysis was chosen to be the core analysis, the published E.coli (iAF1260) and Pseudomonas (iJN746) models were selected to be base chassis and the MatLab was considered to use as modelling platform. In addition, OpenCobra Toolbox that is developed by System Biology Research Team in UCSD would be employed as lower level computation tools.
Week 4 (May 21-25)
Concepts
Flux Balance Analysis (FBA)
Flux balance analysis (FBA) is a mathematical method for analyzing metabolism. It is a direct application of linear programming to biological systems that uses the stoichiometric coefficients for each reaction in the system as the set of constraints for the optimization.
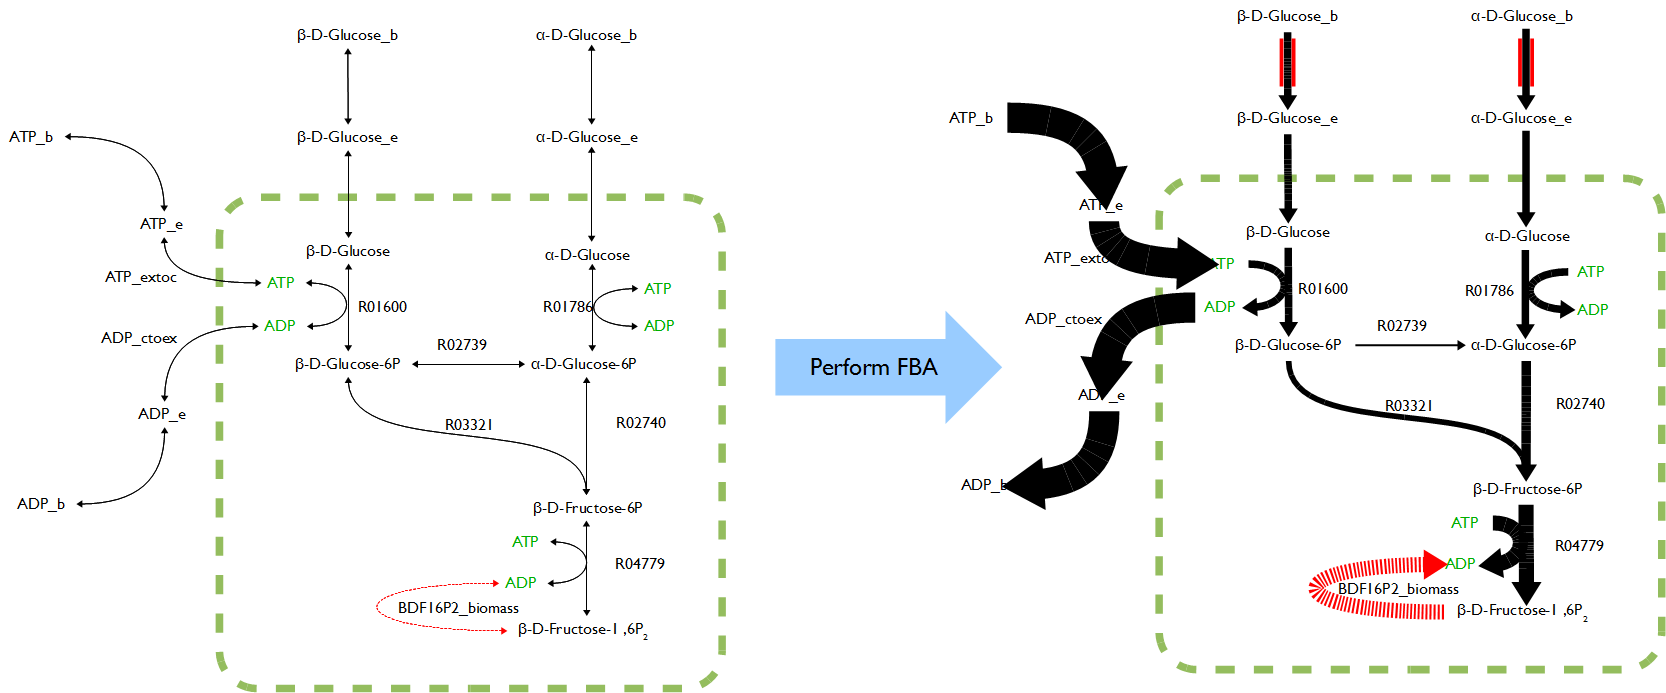
The Steady State Assumption
A system in a steady state has numerous properties that are unchanging in time. This implies that for any property p of the system, the partial derivative with respect to time is zero. In chemistry, a steady state is a situation in which all state variables are constant in spite of ongoing processes that strive to change them.
Stoichiometric & Flux Matrix
Stoichiometry is a branch of chemistry that deals with the relative quantities of reactants and products in chemical reactions. In a balanced chemical reaction, the relations among quantities of reactants and products typically form a ratio of whole numbers.
Flux matrix, in terms of flux rate, is a rate of turnover of molecules through a reaction pathway.
Extended Flux Analysis
Flux variability analysis
The optimal solution to the flux-balance problem is rarely unique with many possible, and equally optimal, solutions existing. Flux variability analysis (FVA), built-in to virtually all current analysis software, returns the boundaries for the fluxes through each reaction that can, paired with the right combination of other fluxes, produce the optimal solution. Reactions which can support a low variability of fluxes through them are likely to be of a higher importance to an organism and FVA is a promising technique for the identification of reactions that are highly important.
Dynamic FBA
Dynamic FBA attempts to add the ability for models to change over time, thus in some ways avoiding the strict homoeostatic condition of pure FBA. Typically the technique involves running an FBA simulation, changing the model based on the outputs of that simulation, and rerunning the simulation. By repeating this process an element of feedback is achieved over time.
Metabolic Network Reconstruction
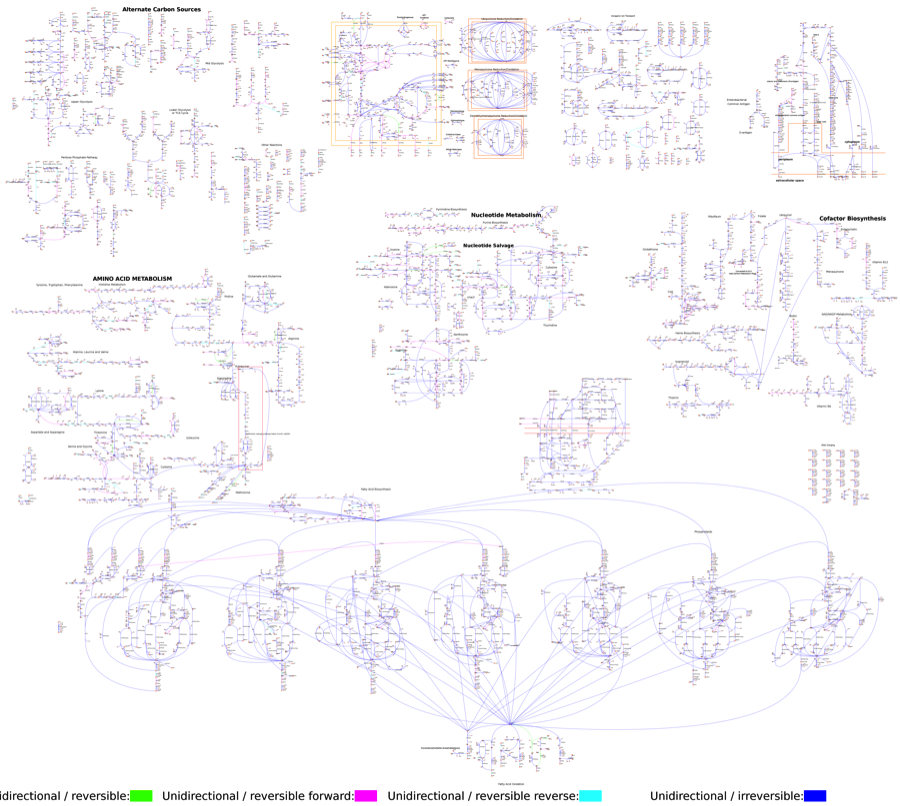
Metabolic network reconstructions are biochemically, genetically, and genomically (BiGG) structured knowledge bases that seek to formally represent the known metabolic activities of an organism. Network reconstructions also exist for other types of biological networks, including transcription/translation and signaling networks. Genome-scale metabolic networks have been reconstructed for nearly 40 organisms so far, including E. coli. These reconstructions are useful because they can be converted into constraint-based models, allowing useful predictive calculations like flux balance analysis to be performed. Constraint-based models of E. coli have existed for nearly twenty years. The first genome-scale model of E. coli metabolism was released in 2000, and this model continues to be expanded and updated today.http://ecoliwiki.net/colipedia/index.php/Metabolic_Network_Reconstructions
Metabolic network reconstruction and simulation allows for an in depth insight into comprehending the molecular mechanisms of a particular organism, especially correlating the genome with molecular physiology (Francke, Siezen, and Teusink 2005). A reconstruction breaks down metabolic pathways into their respective reactions and enzymes, and analyzes them within the perspective of the entire network.Modelling
Constraint-based Model
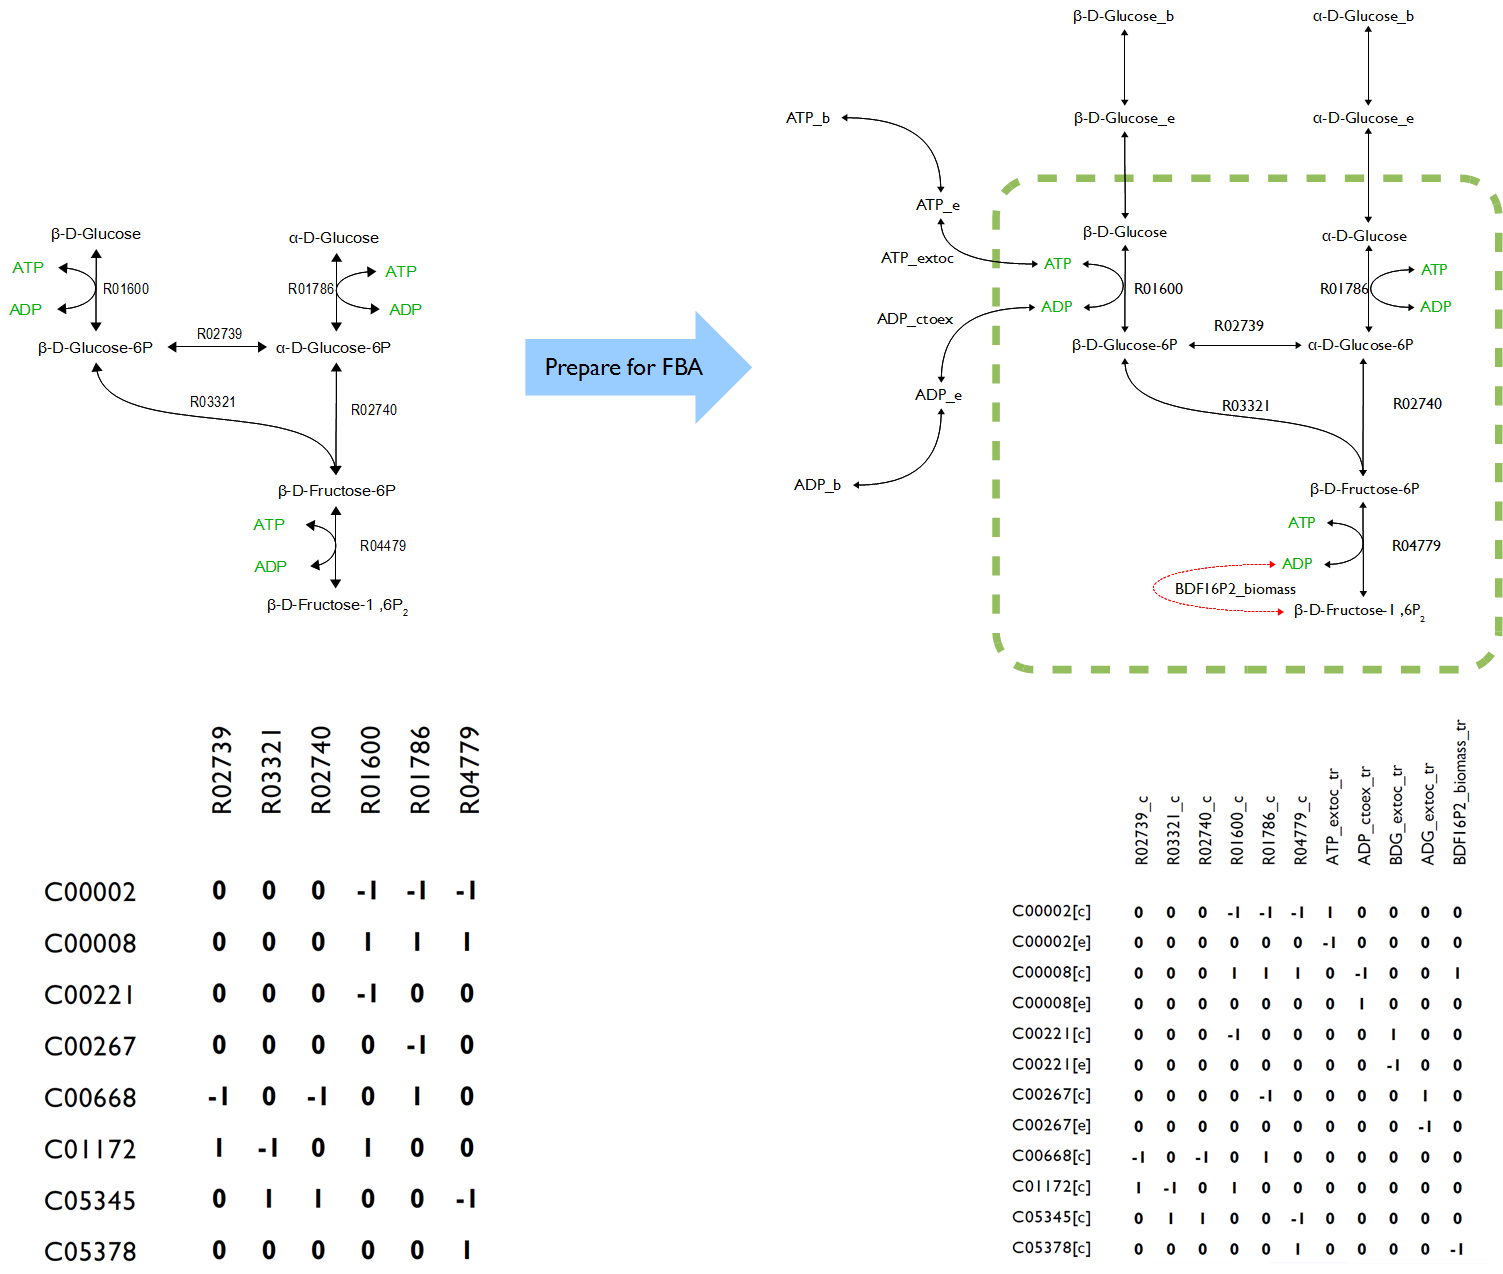
Constraint-based models are a way of mathematically encoding a metabolic network reconstruction. Networks can be encoded as stoichiometric matrices (S), in which each row represents a unique metabolite and each column represents a biochemical reaction. The entries in each column of this matrix are the stoichiometric coefficients of the metabolites in the reaction. Metabolites that are consumed have a negative coefficient and metabolites that are produced have a positive coefficient. Since most reactions involve only a few metabolites, S is a sparse matrix. The size of S is m*n for a network with m metabolites and n reactions. The vector x with length m can then be defined as the concentrations of all the metabolites and the vector v with length n contains the fluxes through each reaction.
Constraint-Based Models of E. coli http://ecoliwiki.net/colipedia/index.php/Metabolic_Network_Reconstructions
iAF1260
The latest update of the E. coli genome-scale metabolic model is iAF1260, published in 2007. The total number of genes increased to 1260, along with increases to 2077 reactions and 1039 unique metabolites. The scope of the network was expanded, explicitly accounting for periplasmic reactions and metabolites. The model was reconciled with the lastest version of the EcoCyc database, and thermodynamic analysis was performed to predict the reversibility of reactions. As the latest version of the E. coli metabolic model, iAF1260 continues to be updated as new discoveries are made, and a new version will be released in 2010. iAF1260 and its predecessors have been used in studies of metabolic engineering, biological discovery, phenotypic behavior, network analysis, and bacterial evolution.
E. coli core model
The core E. coli model is a small-scale model of the central metabolism of E. coli. It is a modified subset of the iAF1260 model, and contains 134 genes, 95 reactions, and 72 metabolites. This model is used for educational purposes, since the results of most constraint-based calculations are easier to interpret on this smaller scale. It is also useful for testing new constraint-based analysis methods.
Tools
openCobra Toolbox
The Constraints Based Reconstruction and Analysis (COBRA) approach to systems biology accepts the fact that we do not possess sufficiently detailed parameter data to precisely model, in the biophysical sense, an organism at the genome scale1.The COBRA approach focuses on employing physicochemical constraints to define the set of feasible states for a biological network in a given condition based on current knowledge. These constraints include compartmentalization, mass conservation, molecular crowding, and thermodynamic directionality.More recently, transcriptome data have been used to reduce the size of the set of computed feasible states. Although COBRA methods may not provide a unique solution, they provide a reduced set of solutions that may be used to guide biological hypothesis development. Given its initial success, COBRA has attracted attention from many investigators and has developed rapidly in recent years based on contributions from a growing number of laboratories – COBRA methods have been used in hundreds of studies. It is used as the major program.
CellDesigner 4.0
CellDesigner is a structured diagram editor for drawing gene-regulatory and biochemical networks. Networks are drawn based on the process diagram, with graphical notation system proposed by Kitano, and are stored using the Systems Biology Markup Language (SBML), a standard for representing models of biochemical and gene-regulatory networks. Networks are able to link with simulation and other analysis packages through Systems Biology Workbench (SBW). In this project, it is used to visualize metabolic network.
Week 5 (May 28 - June 1)
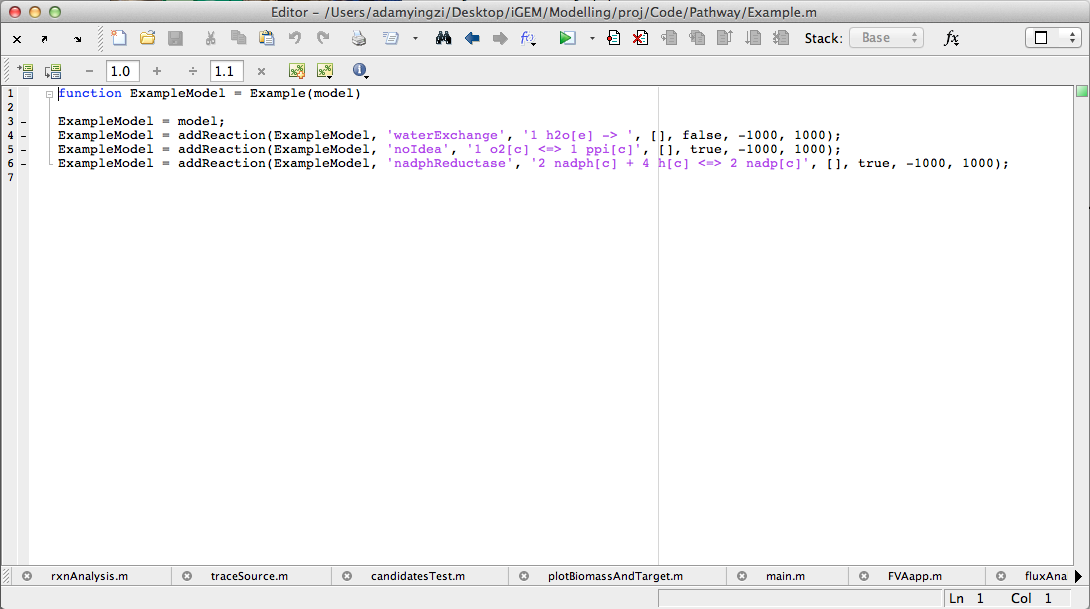
Tests of OpenCobra toolbox basic examples on E.coli core model and Pseudomonas (iJN746) model are passed, which includes following functions: FBA test (optimizeCbModel),model creation/modification tests, reaction addition/deletion/modification, and gene search (deletion) tests.
Generally, The tests outputs are consistant with expected results. FBA test basically generates one pattern of flux rates for each metabolites to contribute the best biomass. The novel model created is exactly same as the predicted model as well as the modified model. Reactions in models can be easily added and deleted.
The gene deletion tests show the same output as the paper, Quantitative prediction of cellular metabolism with constraint-based models: the COBRA Toolbox, demonstrated.
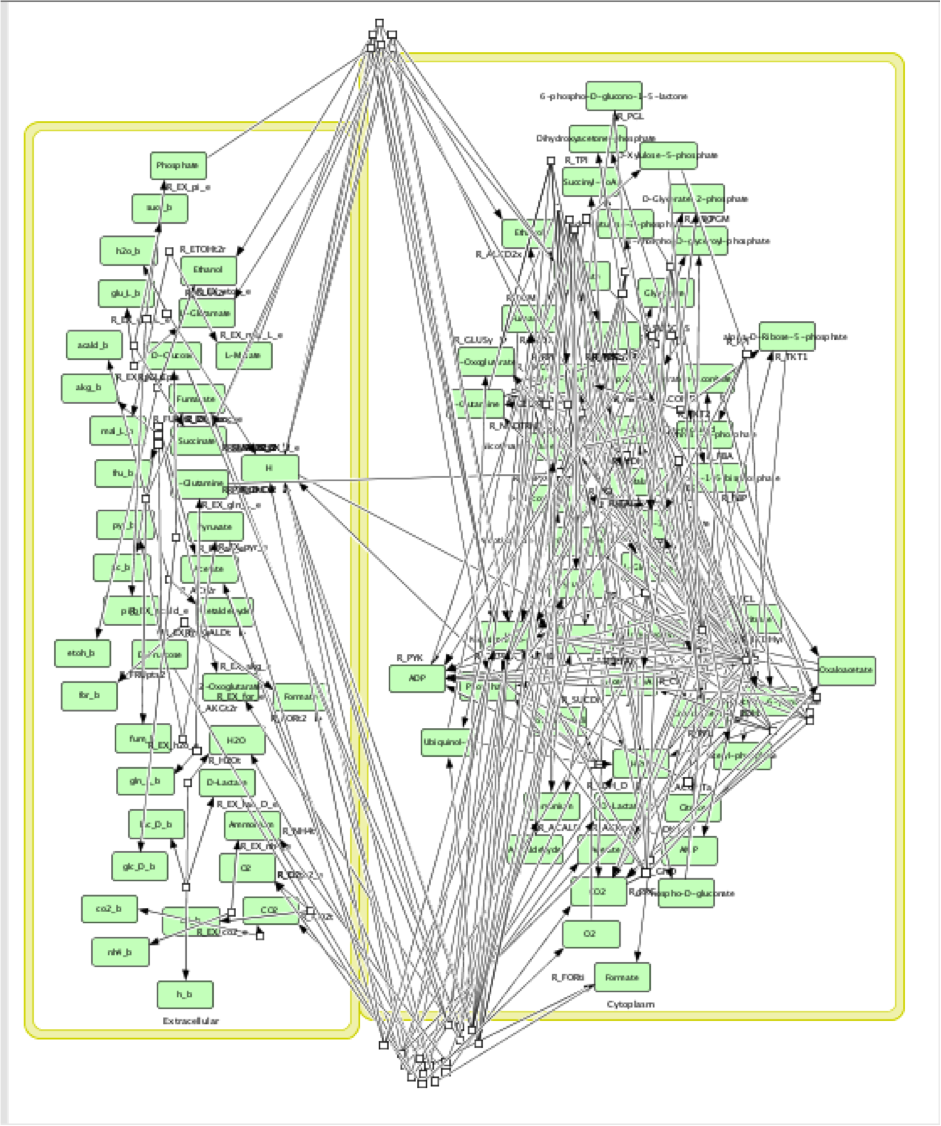
In addition, a software, CellDesigner, is employed to verified the novel model built in Cobra Toolbox visually. The CellDesigner generates a visual diagram to show the entire metabolic network.
Week 6 (June 4-8)
Another sets of tests of OpenCobra toolbox examples on E.coli core model and Pseudomonas (iJN746) model were exanimated, which includes following functions: fluxVariability, OptKnock, GDLS and optGene.
The outputs of tests with fluxVariability, OptKnock and GDLS were biological relevant. The results from OptKnock and GDLS were similar which could be considered as consistent as they were designed to complete similar tasks. However, optGene tests either output results that were understandable or error messages referring to source code.
Week 7 (June 11-15)
In order to reconstructing a proper novel model, all the symbols in OpenCobra Toolbox such as ‘[c]’, ‘[e]’, ‘[b]’ after every compound as well as the abbreviation like ‘lb’ and ‘ub’ for each reaction had to be well understand. Also, the formula of added reactions must be as precise as possible to ensure the accurate of the results because lack of enzymatic and genetic regulation to those reactions making the formulas become only variable.
The novel model built upon E.coli iAF1260 with additional decarboxylation pathway was accomplished. The flux rate of target compound of testPathway test was good; however, this value become extremely low if set the biomass as objective (running flux balance analysis). The results showed, in simulation, if the cell produced the product, its biomass was nearly zero. Vice verse, if the cell grew normally, the production rate was almost zero.
Week 8 (June 18-22)
Two novel models built upon E.coli iAF1260 with additional desulfurization and denitrification pathway separately were completed. As expected, the results from FBA were similar to decarboxylation pathway. These phenomena indicated that the relationship between cell growth and production was normally negative related. In addition, FBA returned one and only one solution that maximized biomass. Due to this natural of FBA, it restricted freedom of flows in network and many alternative solutions were omitted out. For pathways like above three, the production rate was negatively related to growth rate, the FBA was meaningless since the production rate was always zero or extremely small. Luckily, Flux Variability Analysis (FVA) was able to cover the problems caused by FBA. Therefore, FVA become the major computation tool to simulate the flux rates of cell metabolic activities. Unfortunately, the results from FVA for each pathway were also close to zero.
Week 9 (June 25-29)
To figure out the outputs from FVA were whether reasonable, testPathway was applied to run as unit test to verify the model with added pathway. The testPahtway was used to test each reaction in each pathway instead of overall pathway. The results showed the pathways were built improperly because upstream reactions had no flux but downstream reactions could have flux rate. The phenomenon reported last week was result in unbalance of metabolic network. In other words, the modified model violated steady state assumption. Therefore terminal reactions were added to three pathways respectively to keep the system remain in steady state and further to solve the problem. The revised models worked well on testPathway and FVA tests.
Week 10 (July 3-6)
The function FluxAnalysis was employed to generate maximum and minimum flux rate outputs of target compounds for three pathways respectively. The visual graphs of flux rates over entire metabolic networks for each model with three pathways were generated. These graphs were compared and analyzed to find out reactions which flux rates were significantly different between maximum and minimum outputs in each pathway respectively.
Unfortunately, the map was too complicated to compare every single reaction by man source. Also, the conclusions drawn from such comparisons would be not valid since the reactions were highly connected to each other in network rather than distributed. Hence, it is necessary to build an algorithm that could automatically analysis the reactions in network scale.
Week 11-12 (July 9-20)
To have an algorithm doing such a work, the question had to be answered. How to improve the products flux rates through data from FVA?
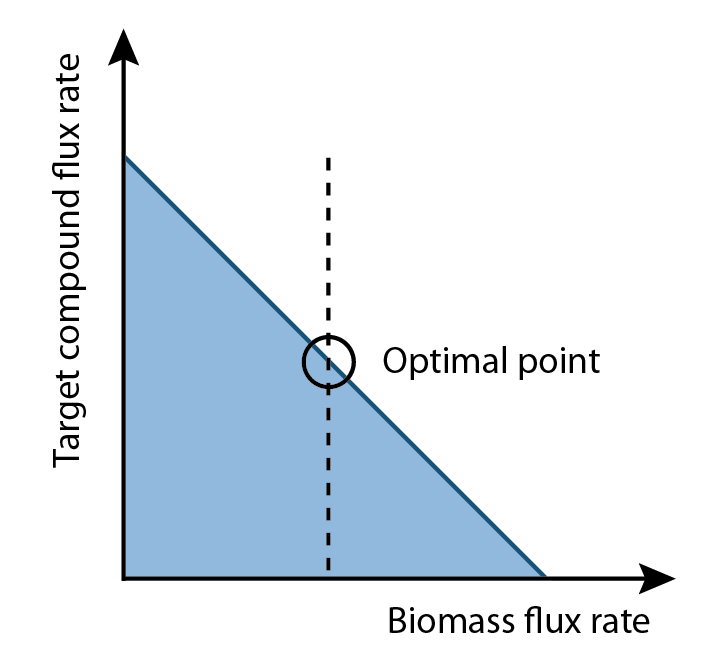
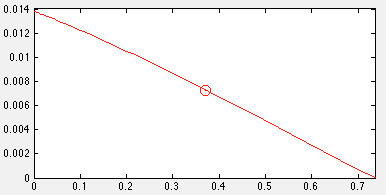
Two things were noticed. One was that FVA could determine full range of numerical values for each reaction flux within the network and its output were able to use for analyze, and the other one was the biomass rate normally had trade-off relation with production rate. Since biomass rate reflects the growth condition, cell must have positive value of biomass flux rate in order to producing. On the other hand, the production flux rate should be higher than zero as well. This implied among all possible set of fluxes, the optimal flux set should locate a place where growth rate multiplies production rate is maximum.
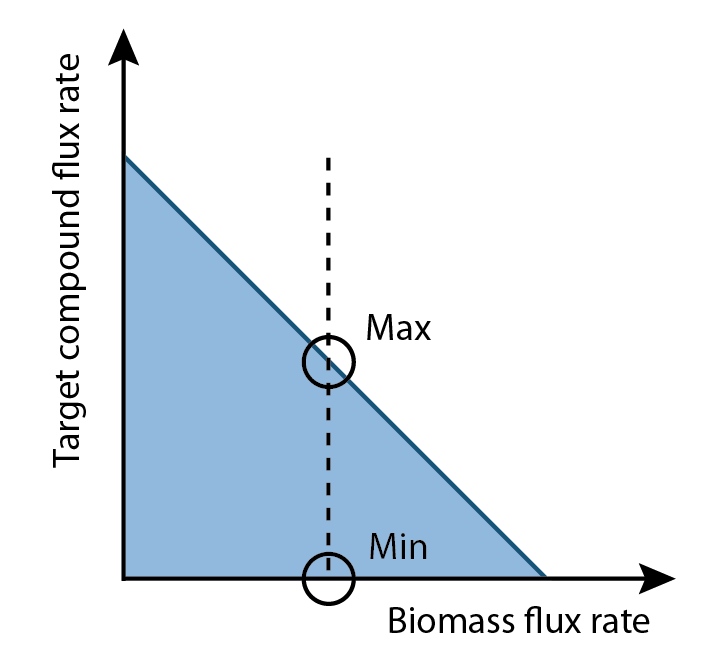
Once the optimal flux rate of biomass was obtained, the value would be set as a new constraint of biomass. Then flux variability analysis would find out the full range of numerical values for each reaction flux within the network that was restricted to the new biological objective.
The differences of values for each reaction in a set of flux that maximized production rate and a set of flux that minimized production rate became interesting. By comparing two sets of fluxes based on visual maps, the results showed some reactions had higher flux rates in production maximum set than production minimum set, some were higher in production minimum set than production maximum set and some had opposite flux directions as most of biological reactions were reversible. In chemical, adding the amount of reactants would force the reactions equilibrium to move forwards, and adding the amount of products could drive the reactions equilibrium to go backwards. Consequently, the question becomes how to find out metabolites that need additional amount to improve the production rate.
One of the possible solutions could be comparing two sets of fluxes, determining differences of each reaction between two sets and changing constraints according to reaction needs. For example, if a metabolite needs more in production maximum set than production minimum set, then add more amount of this metabolite by change constraints to improve the production. However, in reality, cell could only uptake limited kinds of metabolites. Some metabolites were able to be produced by cell but not able to be absorbed from growth media. Hence, only the metabolites that had natural transporters in cell would count.
To improve production by adding more metabolites to growth media, the analysis should start from a model that was built upon glucose minimum growth media.
The analysis algorithm was designed. It can automatically analyze reactions and compounds and were able to output metabolites that would improve the production rate.
Algorithm:
1. Define relationship between growth rate and production rate
2. Find out the optimal growth rate that can maximize the production
3. Get the difference percentage of flux rate for each reaction between production maximum set and production minimum set
4. Collect all reactions have difference percentage between two sets that exceed threshold
5. Score each compound in all collected reactions (Initial score is zero for all compounds)
5.1 The difference of flux rates of one reaction from production maximum set to production minimum set is added to the score for all reactants of this reaction.
5.2 The difference of flux rates of one reaction from production minimum set to production maximum set is added to the score for all products of this reaction.
5.3 Repeat 3.1 to 3.2 till all collected reactions are analyzed.
6. Determine whether compounds with positive scores have natural transporters in cell. If so, mark the compound as candidate.
7. Add each candidate to growth media, and run FVA under optimal growth rate computed in Step 2. Compare the production rate from novel model to that from raw model, if the rate is improved, mark as effector.
Week 13 - 15(July 23-Aug 10)
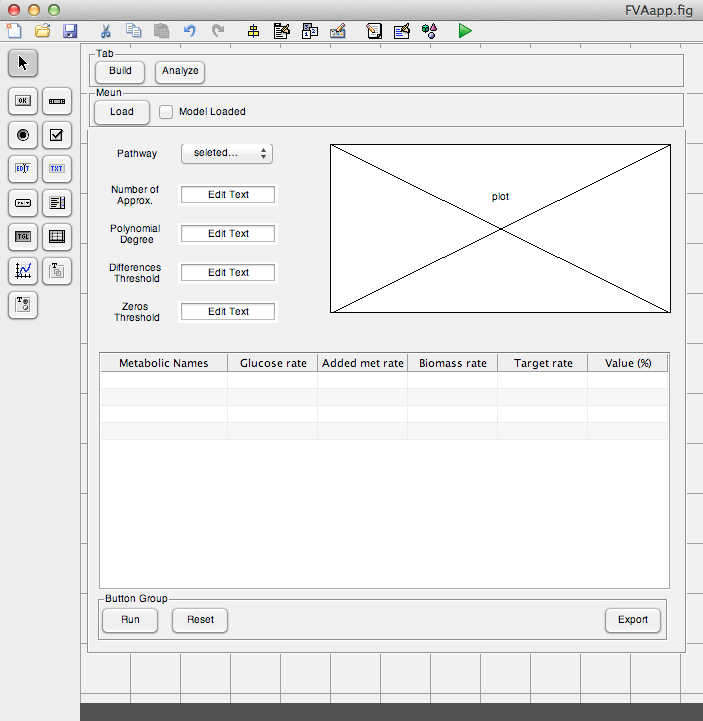
Algorithm described in past weeks was implemented. The user interface prototype of Analysis tab was created.
Week 16-17 (Aug 13-24)
User interface of Analysis part was completely implemented and full functional.
Week 18-19 (Aug 27-Sep 7)
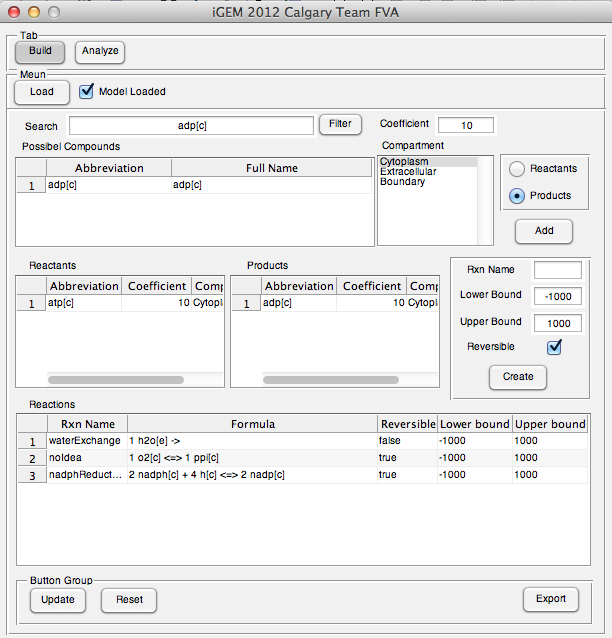
The user interface prototype of Build tab was created. The interface was completely implemented and fully functional.
Week 20 (Sept 10-14)
Application went post-development phase and some additional features were added into.
New features:
Searching: Users can search metabolites in loaded model
Updating: Users is able to update reactions they entered in table
Changing export file format: User can read analysis output in spread sheet
Week 21-23 (Sept 10-Oct 3)
Model Validated with data from web lab. Assay for decarboxylation pathway was set. E Coli. with petrobrick grew up on nine different growth medias, one positive control (LB+glucose minimum), one negative control (glucose minimum), and eight medias that consisted of glucose minimum and compounds (pyruvate, fumarate, malate, aspartate, fructose, amp, glycine and ethanol) suggested by application outputs.
Week 24-26 (Oct 15-Oct 26)
The previous wet lab experiments were repeated to get more duplicates. The same conditions were set except different initial cell OD. We added one more media that combines glycine and pyruvate to see the effect of repeated addition. The results showed on Flux Analysis Page.

 "
"
