Team:Calgary/Project/FRED/Prototype
From 2012.igem.org
Iaingeorge (Talk | contribs) |
|||
| (41 intermediate revisions not shown) | |||
| Line 7: | Line 7: | ||
<img src="https://static.igem.org/mediawiki/2012/a/a2/UCalgary2012_Fred_Construction_V2.png" style="width: 200px; float: right; padding: 10px;"></img> | <img src="https://static.igem.org/mediawiki/2012/a/a2/UCalgary2012_Fred_Construction_V2.png" style="width: 200px; float: right; padding: 10px;"></img> | ||
<p> | <p> | ||
| - | In order to put our toxin-detecting bacteria to use, we developed | + | In order to put our toxin-detecting bacteria to use, we developed the hardware and software needed to work with FRED. After assembling many prototypes and designs, we have developed a portable and affordable open source hardware-software package that uses FRED's reporter genes for electrochemical detection. This field-ready system can be used for quick and quantitative analysis of samples and can measure the concentrations of multiple compounds simultaneously. </p> |
<p>Last year, the Calgary iGEM team developed a potentiostat circuit whose function was quite limited. In essence, the device could run only half of the desired voltage sweep, and was inconsistent and lacking in sensitivity. Rather than give a quantitative measurement of a given compound, the primitive prototype could only produce a voltammogram with peaks that had to be interpreted by the user. </p> | <p>Last year, the Calgary iGEM team developed a potentiostat circuit whose function was quite limited. In essence, the device could run only half of the desired voltage sweep, and was inconsistent and lacking in sensitivity. Rather than give a quantitative measurement of a given compound, the primitive prototype could only produce a voltammogram with peaks that had to be interpreted by the user. </p> | ||
| - | <p>This year, we significantly improved the design and function of the potentiostat. We also designed and developed hardware for housing the circuitry and samples, as well as a software package for controlling the hardware and analyzing data for a | + | <p>This year, we significantly improved the design and function of the potentiostat. We also designed and developed hardware for housing the circuitry and samples, as well as a software package for controlling the hardware and analyzing the data. We have also created a standard protocol for how to build and use a system such as this. <a href="https://static.igem.org/mediawiki/2012/7/72/BuildingABiosensor.pdf">Download our walkthrough here.</a> You can also download the needed code <a href="https://static.igem.org/mediawiki/2012/3/34/Test.m">here</a> and <a href="https://static.igem.org/mediawiki/2012/d/df/Output.m">here.</a></p> |
<h2>The Potentiostat</h2> | <h2>The Potentiostat</h2> | ||
</html> | </html> | ||
| - | [[File:UCalgary-Prototype-Electronics.jpg|thumb|745px|left| | + | [[File:UCalgary-Prototype-Electronics.jpg|thumb|745px|left|Figure 1: From validating the breadboarded circuit, to making the final circuit, to assembling the prototype.]] |
<html> | <html> | ||
| - | <p>A potentiostat is | + | <p>A potentiostat is an electrical circuit used to conduct eletroanalytical experimentation to study redox reactions. It controls a three electrode system by changing the voltage difference between two of the electrodes, the working electrode and counter electrode. The third electrode is the reference electrode, that acts as a virtual zero voltage against which all voltage values are measured. The potentiostat will then record the current produced at the working electrode. Common experiments that use potentiostats are <a href="https://2012.igem.org/Team:Calgary/Notebook/Protocols/cvs">cyclic voltammetry</a> and <a href="https://2012.igem.org/Team:Calgary/Notebook/Protocols/potstd">potentiostatic runs</a>.</p> |
| - | <p> | + | <p>FRED needs a potentiostat to be able to talk to us, however traditional laboratory potentiostats have a few significant drawbacks:</p> |
<ul> | <ul> | ||
| - | <li>Expense: | + | <li><p>Expense: Commercial potentiostats often cost thousands of dollars, with some costing over fifty thousand dollars</p></li> |
| - | <li>Size: | + | <li><p>Size: Although newer models are smaller (and more costly), most commercial potentiostats are large and heavy pieces of hardware</p></li> |
| - | <li>Immobility: In addition to being very bulky | + | <li><p>Immobility: In addition to being very bulky, most commercial potentiostats require a 120 V power outlet and are not designed for portability</p></li> |
</ul> | </ul> | ||
| - | <p>In order for our biosensor to be viable for use in the field ( | + | <p>In order for our biosensor to be viable for use in the field (e.g., samples in/around Alberta's oil sands tailings ponds) we needed it to be inexpensive, small, and portable. This led us to investigate the possibility of assembling our own customized potentiostat. We came across a paper (Gopinath and Russel, 2006) that described a simple, inexpensive design for a three-electrode potentiostat. This informed the design of last year’s potentiostat circuit which achieved portability through the use of 9 V batteries, but was limited in its function. This year, we made many upgrades: we tweaked the circuit to run in our desired -2 V -> +2 V sweeping range, added hardware filters to eliminate noise in our readings, implemented a variable dip switch for changing resistors values to alter measurement sensitivity, and had it milled onto a compact and durable circuit board with a diameter of only 6 cm. A software platform with a graphical user interface was developed to interface with the circuit and analyze the raw data.</p> |
| - | < | + | <a name="hardware"></a><h2>The Hardware</h2> |
| - | < | + | |
</html> | </html> | ||
| - | [[File:Prototype_board.png|thumb| | + | [[File:Prototype_board.png|thumb|350px|left|Figure 2: Early design, featuring portable power, a variable dip switch, and LEDs]] |
<html> | <html> | ||
| - | <p> | + | <p>Our preliminary designs were relatively small, battery powered and had exposed electrodes that were inserted into a beaker of solution. One of our more seriously developed prototypes was a black box that housed the circuitry and the DAQ, featured power switches and LEDs to report on what stage of the experiment was currently underway. As we |
| - | + | continued to compact the potentiostat circuit, the designs continued to get smaller and more lightweight until the same circuit was concentrated onto a 6cm printer circuit board. </p> | |
| - | < | + | <br> |
| - | |||
| - | </ | + | <p>Another consideration we made pertained to containment of the bacteria. We developed a disposable cartridge system that allows for safe and easy sampling, while remaining inexpensive. One of the main features of our final prototype is the material we used. Rather than having our design manufactured, we used supplies and materials that were readily available around a molecular biology lab. The main shell of the biosensor is a cylindrical plastic Nalgene container, and the disposable cartridges have been built out of 15 mL falcon tubes. <p/> |
| - | [[File: | + | </html>[[File:Calgary_Cartridge_Final.png|thumb|750px|center|Figure 4: Reloadable cartridge sytem.]]<html> |
| - | <html> | + | |
| - | <p>To run our hardware, we developed a personalized software package with the MATLAB platform. Software was required to run the DAQ’s inputs and outputs, as well as to interpolate the data acquired and format it | + | |
| - | + | ||
| + | |||
| + | <p>The Nalgene shell houses the potentiostat circuit, two 9 V batteries, and a port for the insertion of cartridges. Each cartridge is a sealed vessel containing our bacteria. One end houses an electrode strip on the interior, and the connectors protrude from the exterior for connection to the circuit. There is also a one-way valve for injection of samples, so the field tests can be conducted without the bacteria escaping. </p> | ||
| + | |||
| + | </html>[[File:Calgary_Battery.png|thumb|750px|center|Figure 5: 9 V batteries connected via audio jack can be contained in the Nalgene shell.]]<html> | ||
| + | |||
| + | |||
| + | |||
| + | |||
| + | |||
| + | |||
| + | |||
| + | <a name="software"></a><h2>The Software</h2> | ||
| + | |||
| + | <p>To run our hardware, we developed a personalized software package with the MATLAB platform. Software was required to run the DAQ’s inputs and outputs, as well as to interpolate the data acquired and format it for the user to view.</p> | ||
</html> | </html> | ||
| - | [[File: | + | [[File:UCalgary-Prototype-ElectroSoftware.jpg|thumb|745px|center|Figure 6: Snippet of source code from the biosensor software package and a view of the GUI detecting PDP]] |
<html> | <html> | ||
| - | <p>Along with the outputs there were two input channels. One input channel measured the voltage applied to the solution, while the other one measured the current | + | <p>There were several outputs that needed to be operated through the software, mainly the initial voltage sweep that was the basis of our potentiostat, as well as the two indicator LEDs. All of this was possible through our simple, yet sophisticated software package. Within this package the user can toggle a wide range of voltage sweeps they would like to test in, as well as the rate of each sweep. This package also outputs a holding voltage, so when the program is finished executing, the electrodes don’t get damaged by swinging between voltages randomly.</p> |
| - | <p>All of this software is completely stand-alone, built with MATLABs own compiler, | + | |
| + | <p>Along with the outputs there were two input channels. One input channel measured the voltage applied to the solution, while the other one measured the current produced by the solution. Although this was the easiest part of the software to write, the more challenging issue was the interpolation of this acquired data. With our software, it is possible to produce a standard curve as well as determine the concentration of whatever chemical agent we are testing for with the user having to only click a button.</p> | ||
| + | |||
| + | <p>All of this software is completely stand-alone, built with MATLABs own compiler, allowing others to make use of this technology for other applications. | ||
</p> | </p> | ||
| + | |||
| + | <p> | ||
| + | <p/> | ||
| + | <A HREF="https://2012.igem.org/Team:Calgary/Project/Synergy">Click here to see a video walkthrough and a mock field test of our biosensor! </A> | ||
</html> | </html> | ||
}}} | }}} | ||
}} | }} | ||
Latest revision as of 03:58, 27 October 2012


Hello! iGEM Calgary's wiki functions best with Javascript enabled, especially for mobile devices. We recommend that you enable Javascript on your device for the best wiki-viewing experience. Thanks!
Prototyping a Biosensor Device

In order to put our toxin-detecting bacteria to use, we developed the hardware and software needed to work with FRED. After assembling many prototypes and designs, we have developed a portable and affordable open source hardware-software package that uses FRED's reporter genes for electrochemical detection. This field-ready system can be used for quick and quantitative analysis of samples and can measure the concentrations of multiple compounds simultaneously.
Last year, the Calgary iGEM team developed a potentiostat circuit whose function was quite limited. In essence, the device could run only half of the desired voltage sweep, and was inconsistent and lacking in sensitivity. Rather than give a quantitative measurement of a given compound, the primitive prototype could only produce a voltammogram with peaks that had to be interpreted by the user.
This year, we significantly improved the design and function of the potentiostat. We also designed and developed hardware for housing the circuitry and samples, as well as a software package for controlling the hardware and analyzing the data. We have also created a standard protocol for how to build and use a system such as this. Download our walkthrough here. You can also download the needed code here and here.
The Potentiostat
A potentiostat is an electrical circuit used to conduct eletroanalytical experimentation to study redox reactions. It controls a three electrode system by changing the voltage difference between two of the electrodes, the working electrode and counter electrode. The third electrode is the reference electrode, that acts as a virtual zero voltage against which all voltage values are measured. The potentiostat will then record the current produced at the working electrode. Common experiments that use potentiostats are cyclic voltammetry and potentiostatic runs.
FRED needs a potentiostat to be able to talk to us, however traditional laboratory potentiostats have a few significant drawbacks:
Expense: Commercial potentiostats often cost thousands of dollars, with some costing over fifty thousand dollars
Size: Although newer models are smaller (and more costly), most commercial potentiostats are large and heavy pieces of hardware
Immobility: In addition to being very bulky, most commercial potentiostats require a 120 V power outlet and are not designed for portability
In order for our biosensor to be viable for use in the field (e.g., samples in/around Alberta's oil sands tailings ponds) we needed it to be inexpensive, small, and portable. This led us to investigate the possibility of assembling our own customized potentiostat. We came across a paper (Gopinath and Russel, 2006) that described a simple, inexpensive design for a three-electrode potentiostat. This informed the design of last year’s potentiostat circuit which achieved portability through the use of 9 V batteries, but was limited in its function. This year, we made many upgrades: we tweaked the circuit to run in our desired -2 V -> +2 V sweeping range, added hardware filters to eliminate noise in our readings, implemented a variable dip switch for changing resistors values to alter measurement sensitivity, and had it milled onto a compact and durable circuit board with a diameter of only 6 cm. A software platform with a graphical user interface was developed to interface with the circuit and analyze the raw data.
The Hardware
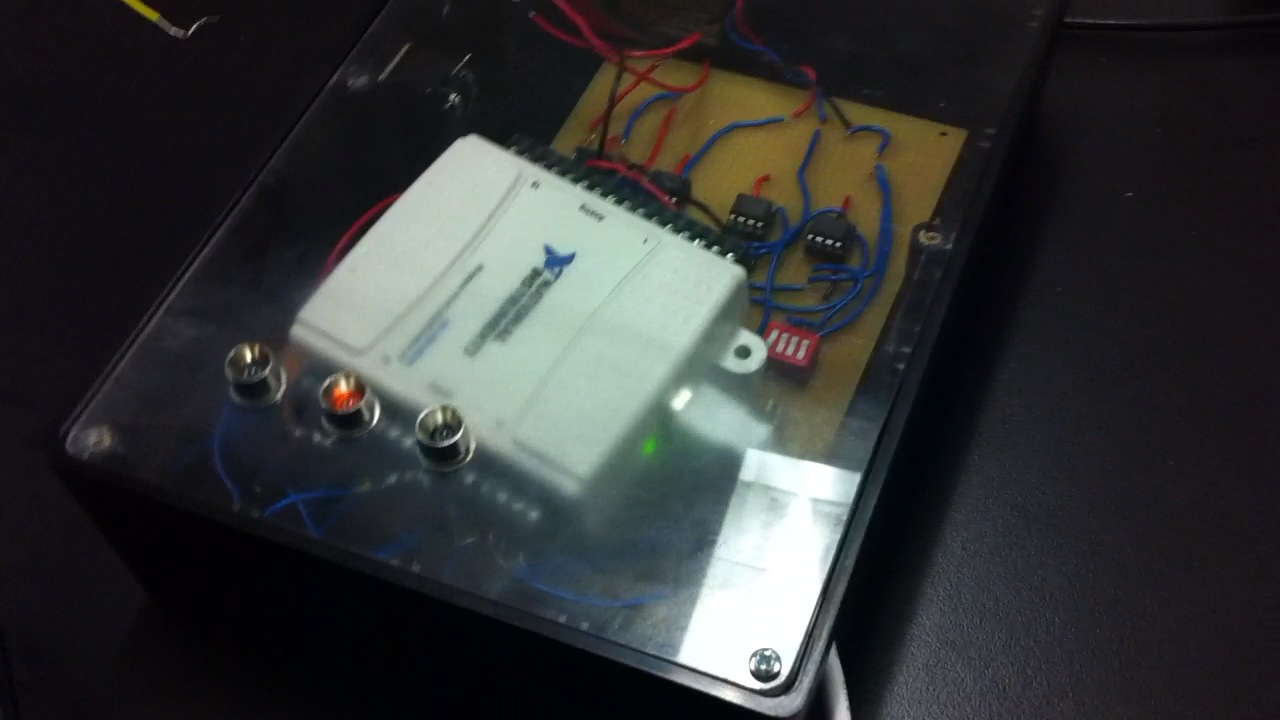
Our preliminary designs were relatively small, battery powered and had exposed electrodes that were inserted into a beaker of solution. One of our more seriously developed prototypes was a black box that housed the circuitry and the DAQ, featured power switches and LEDs to report on what stage of the experiment was currently underway. As we continued to compact the potentiostat circuit, the designs continued to get smaller and more lightweight until the same circuit was concentrated onto a 6cm printer circuit board.
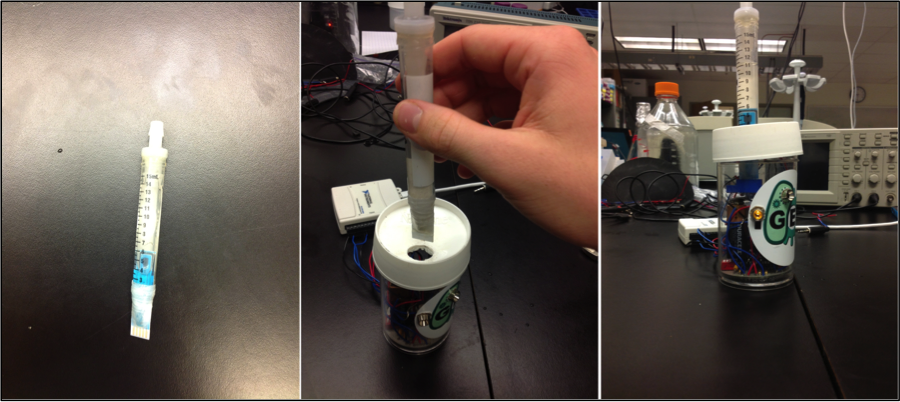
Another consideration we made pertained to containment of the bacteria. We developed a disposable cartridge system that allows for safe and easy sampling, while remaining inexpensive. One of the main features of our final prototype is the material we used. Rather than having our design manufactured, we used supplies and materials that were readily available around a molecular biology lab. The main shell of the biosensor is a cylindrical plastic Nalgene container, and the disposable cartridges have been built out of 15 mL falcon tubes.
The Nalgene shell houses the potentiostat circuit, two 9 V batteries, and a port for the insertion of cartridges. Each cartridge is a sealed vessel containing our bacteria. One end houses an electrode strip on the interior, and the connectors protrude from the exterior for connection to the circuit. There is also a one-way valve for injection of samples, so the field tests can be conducted without the bacteria escaping.
The Software
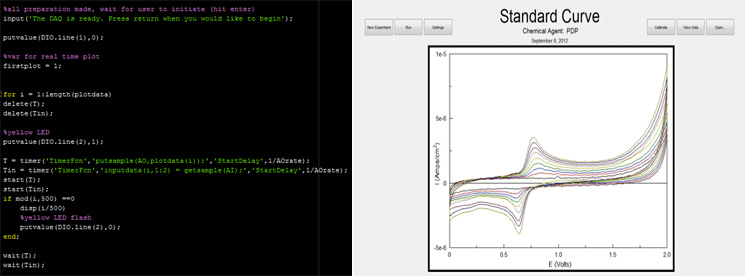
To run our hardware, we developed a personalized software package with the MATLAB platform. Software was required to run the DAQ’s inputs and outputs, as well as to interpolate the data acquired and format it for the user to view.
There were several outputs that needed to be operated through the software, mainly the initial voltage sweep that was the basis of our potentiostat, as well as the two indicator LEDs. All of this was possible through our simple, yet sophisticated software package. Within this package the user can toggle a wide range of voltage sweeps they would like to test in, as well as the rate of each sweep. This package also outputs a holding voltage, so when the program is finished executing, the electrodes don’t get damaged by swinging between voltages randomly.
Along with the outputs there were two input channels. One input channel measured the voltage applied to the solution, while the other one measured the current produced by the solution. Although this was the easiest part of the software to write, the more challenging issue was the interpolation of this acquired data. With our software, it is possible to produce a standard curve as well as determine the concentration of whatever chemical agent we are testing for with the user having to only click a button.
All of this software is completely stand-alone, built with MATLABs own compiler, allowing others to make use of this technology for other applications.
Click here to see a video walkthrough and a mock field test of our biosensor!
 "
"


