Team:Calgary/Notebook/Denitrogenation
From 2012.igem.org


Hello! iGEM Calgary's wiki functions best with Javascript enabled, especially for mobile devices. We recommend that you enable Javascript on your device for the best wiki-viewing experience. Thanks!
Denitrogenation Journal
Week 1 (May 1-4)
The following section covers wetlab aspect of our overall project focusing on microbial conversion of naphthenic acids into economically-valuable hydrocarbons. The approach taken in this endeavour will be from four strategic starting points - ring cleavage, decarboxylation, denitrificaiton, and desulfurization. Overall, the 'hydrocarbons' aspect of the project is a critical one to our overall design and construction of a biosystem capable of not only detecting but also converting naphthenic acids in what will be an economically viable solution to the remediation and recovery of tailings pond water, while removing these toxic compounds before they can have significant detrimental impact on the environment.
Week 2-3 (May 7-18)
In the first two weeks of iGEM our group has focused on reviewing literature regarding the bioremediation of nitrogen groups attached to naphthenic acids. The most prevalent N heterocycle is carbazole, representing 75% of total nitrogen by mass. The upper pathway of carbazole biodegradation is catalyzed by the enzymes coded for by the car operon, CarA (CarAaAbAd), CarB (CarBaBb), and CarC. These enzymes convert carbazole to anthralinic acid. The lower pathway is catalyzed by the enzymes of the ant operon, antA, B, and C, yielding cathecol while releasing CO2 and NH3. The car and ant operons are both regulated by the Pant regulator which is induced by the protein, antR. CarAa also has its own promoter which is not induced by antR. We have also investigated an alternative pathway using CarA combined with an amidase (amdA) that selectively cleaves NH2 from an intermediate of the car pathway. This could bypass much of the car/ant pathway and is possibly more efficient.
We have decided to use Pseudomonas resinovorans and Rhodococcus erythropolis to amplify these genes from. CarABC and AntABC from P. resinovorans has been shown to have a wide range of nitrogen containing substrate specificity. R. erythropolis contains the amdA gene that we wish to use, and some evidence suggests that it may also be able to degrade sulfur rings through its CarABC pathway.
Week 4 (May 22-25)
This week we reviewed the primers listed in the database and also designed some new ones. Primers for CarAa, CarAc, and CarAd were designed individually, while primers for CarBaBbC and AntABC were designed to encompass multiple genes in a sequence. These primers were designed to be used on Pseudomonas putida which we decided to use as our gene source since it was available to us as opposed to ordering Pseudomonas resinovorans. We also designed a primer for the AmdA gene from Rhodococcus erthyroplois. In addition to ordering these primers we also ordered the nitrogen containing compounds that we will need to test these enzymes on. We decided on using carbazole to make sure the enzymes can perform their natural function as well as pyrrolidine to test them on a similar ring structure. We also ordered cyclohexamine in order to independently test the function of the alternative AmdA pathway. Finally, we decided to eventually order 4-Piperidine butyric acid hydrochloride to test how the enzymes will work on nitrogen containing naphthenic acids. However, we decided since it is a very expensive compound we would wait to make sure the enzyme's work on more simple compounds before ordering it.
We also started our work in the wet lab by plating colonies and making an overnight culture of -80 freezer stock Psuedomonas putida on Thursday. We also resuspended the primers for CarAa, CarAc, CarAd, AntA, AntB, and Ant C that were already in the database. We were able to use the colonies that grew on the streak plates to start a colony PCR to attempt to isolate each of these genes on Friday.
Week 5 (May 28 - June 1)
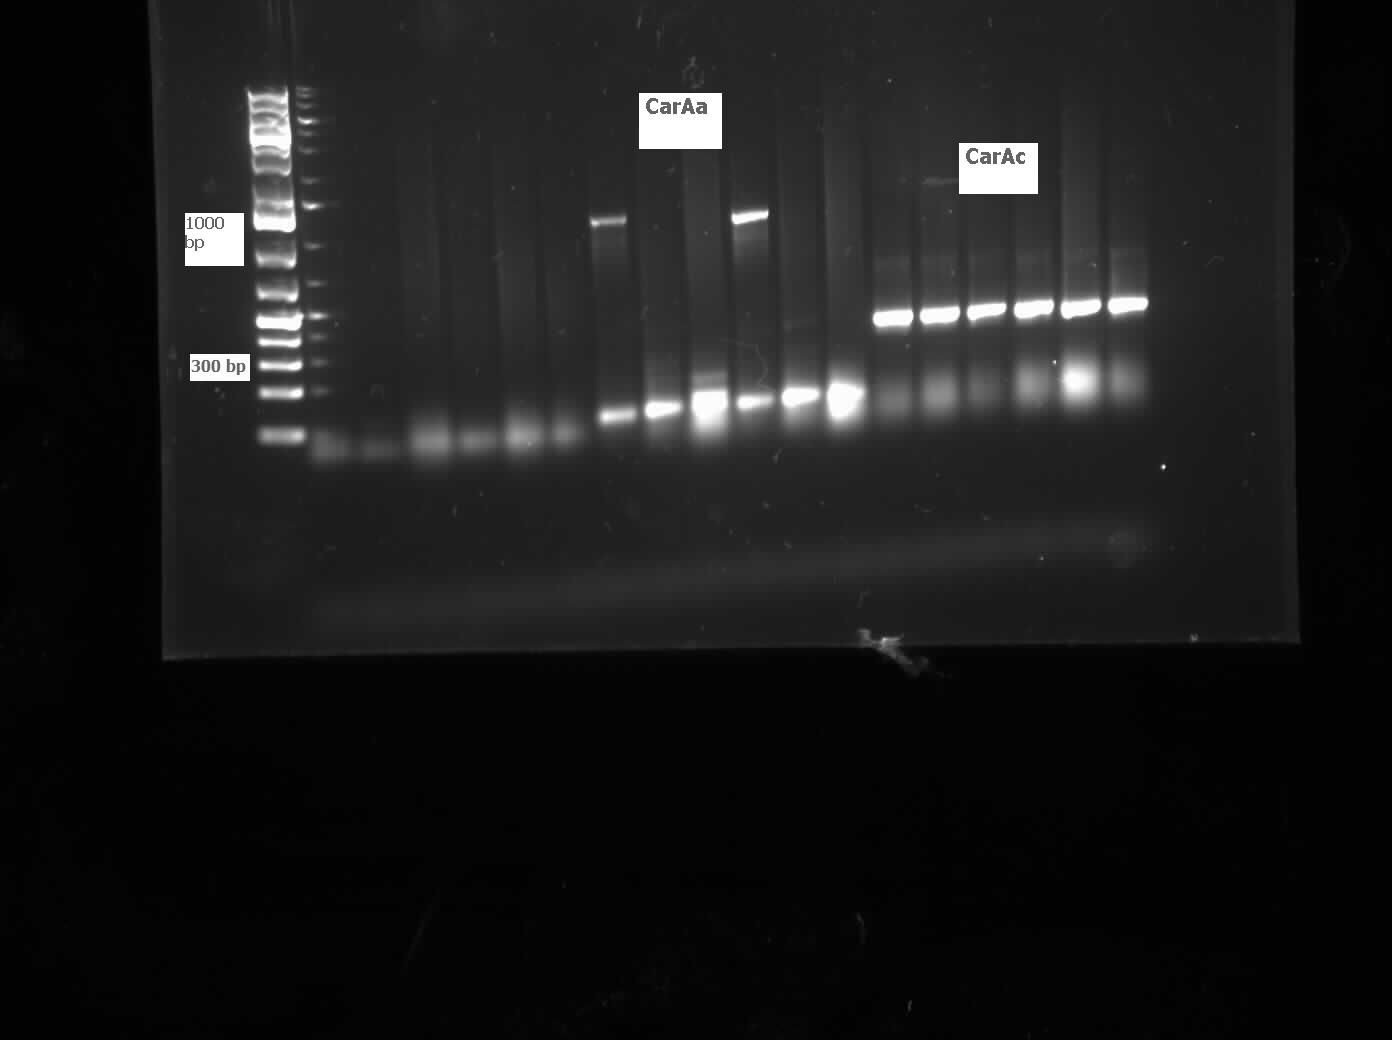
On Monday and Tuesday we used the database primers to attempt to isolate CarAa, CarAc, CarAd, AntA, AntB, and AntC from the Psuedomonas putida we plated last week. CarAd, AntB, and AntC were all put in the gradient PCR machine to account for the wide range of their primers’ melting points, while the others were done via regular PCR. Unfortunately, no positive results were obtained from these reactions. The PCR on CarAc and AntA was repeated on Wednesday, still not giving positive results. Finally, we attempted to use a salt concentration gradient on the PCR reaction for CarAc and AntA, using concentrations that ranged from 1.0 microlitres/tube to 2.0 microlitres/tube in increments of 0.2 microlitres/tube. This helped as CarAc showed bands in samples that had concentrations of 1.2 and 1.4 microlitres/tube. AntA also showed bands, however they were not the correct size, indicating contamination and/or non-specific annealing of the primer. The positive control also showed bands of the correct size. Earlier in the week we also made overnight cultures of 3 environmental strains (28, 29, 30) of Psuedomonas putida from -80 glycerol stock. On Friday we performed a genomic prep on these cultures, and plan on attempting to amplify genes from the isolated DNA next week.
Week 6 (June 4 - June 8)
We started off this week by determining the DNA concentration of our genomic prep samples from last week using the nanodrop. DNA concentration for all three putida strains was at least 1000 ng/microlitre, well above what was needed for PCR. 1/2 and 1/3 dilutions were prepared for all three strains so as not to have an excess of template DNA in PCR reactions. PCR was performed on all 3 strains using primers for CarAc, CarAd, AntA, AntB, and AntC using 6 replicates per gene. The only successful amplification appeared to be AntB and CarAc, both from strain 28 (with weaker bands in strain 29). We then performed another PCR, just on those two genes with an increased amount of Taq polymerase to hopefully get enough amplified DNA to move forward with. This resulted in strong bands for both at the expected size. We then performed PCR purification using the Qiaquick kit and obtained samples containing 33.5 ng/microlitre of AntB DNA and 129 ng/microlitre of CarAc DNA. These concentrations were both sufficient to begin a restriction digest and ligation of these parts into vector PSB1C3. Next week we hope to verify the results of the restriction digest, continue to amplify CarAc and AntB from strain 28, and hopefully submit a biobrick for sequencing.
Week 7 (June 11 - June 15)
The purified PCR products for CarAc and AntB were digested with restriction enzymes EcoRI+SpeI, EcoRI+PstI, and XbaI+PstI. However, only PSB1C3 plasmids that had been digested with EcoRI+SpeI and EcoRI+PstI were available to attempt ligation. Gel results were inconclusive on the restriction digest product as the plasmid size appeared much larger than expected. However, transformation was still attempted on the ligation products for both genes (both using EcoRI+SpeI ligation into PSB1C3 plasmid). The transformation products were plated onto chloro plates to select for colonies that had the chloro resistance gene on the PSB1C3 plasmid. Also this week another round of PCR was performed for the Car and Ant genes, however all, but CarAc showed bands in the negative control lane, possibly indicating contamination or the formation of primer dimers. The CarAc bands were fairly weak and a PCR purification resulted in very low DNA concentration, insufficient to move onto restriction digest. Next week's plan hinges heavily on the result of the transformation from this Friday.
Week 8 (June 18 - June 22)
The results of our transformation on CarAc and AntB from last week showed mostly red colonies indicating that the ligation was unsuccessful and that the PSB1C3 plasmid simply closed on itself with no insert. However, there were three colonies for CarAc that were white (cut with both X+P and E+P). Colony PCR was performed on these three colonies using biobrick primer sets to verify that the part had been inserted in these colonies, but unfortunately all PCR results were negative indicating an unsuccessful ligation.
We also performed a miniprep on Psudomonas putida strain #28 this week using a home-made protocol rather than the Qiagen kit. Miniprep A had a DNA concentration of 1539.8 ng/uL and Miniprep B had DNA concentration of 1001.2 ng/uL possibly indicating that there may have been a lot of genomic DNA contamination. However miniprep A product was still used as a PCR template for a reaction attempting to isolate CarAc, CarAd, AntA, AntB, and AntC. Special conditions for this PCR included replacing 60 uL of water with 60 uL of betaine heated to 37 degrees Celsius and running a Mg gradient ranging from 0.5 uL - 2.5 uL per tube for each gene. Of these only AntB had bands of the right size in 3 of the lanes (Mg concentrations of 1.5, 2, and 2.5 uL). However, all of the AntB bands (including the negative control) contained a contamination band at around 100 bases, probably due to the formation of primer dimers. This forced us to do a gel extraction rather than a PCR purification. This gel extraction did not work as the nanodrop results indicated high amounts of agarose contamination. Another PCR was performed using the same conditions, but using miniprep B instead as there was no more miniprep A product remaining. Unfortunately there were no bands for AntB, only the 100 basepair contamination bands.
Week 9 (June 25 - June 29)
This week we modified our PCR protocol to adjust for the homemade taq polymerase we were using. Template DNA was boiled for 10 minutes on its own to replace the initialization step. This is because this polymerase could not tolerate the 95 degree heat during the regular initialization step. Another modification we made was to boil our primers for 5 minutes prior to adding them to the master mix. This was done to discourage the formation of primer dimers. Finally we also attempted a touch down PCR which started at an annealing temperature greater than the Tm of our primers and gradually worked its way down to below the Tm of the primers. This was done to increase the specificity of our reaction and also eliminate the formation of primer dimers. Unfortunately these techniques still saw the formation of dimers, preventing us from performing a PCR purification. Again, the gel purification procedure did not lead to successful purification of our target gene. Due to the problems we have had so far our goal for next week is to perform an assay experiment to try and determine which of the Pseudomonas putida strains we have access to can actually degrade carbazole and therefore contain the pCAR1 plasmid.
Week 10 (July 2-July 6)
The goal for this week was to grow different strains of Pseudomonas in media containing B-N media + glucose with only carbazole as a source of nitrogen. In theory only those strains which contained the pCAR1 plasmid would be able to use carbazole as a nitrogen source and thrive in this media. The strains we tested from glycerol stock included putida LD1, putida environmental strains 28-30, and Florescens PF5. Each of these strains had two cultures grown; one with carbazole and one without it. E. coli grown with carbazole was used as a negative control as it does not contain the pCAR plasmid. At timepoints of 22, 46, and 117 hours of growth samples were taken to do an OD600 reading to measure bacterial growth and had an ammonia assay performed on it. The detection of ammonia acted as a proxy for detecting carbazole degradation as it is an endproduct of the pathway. With this in mind an additional control strain of LD1 was grown in media containing glucose and ammonia. This is to detect the possibility that Pseudomonas can use ammonia as a source of nitrogen after it has degraded carbazole which would be problematic as far as using ammonia levels to determine carbazole degradation. So far we have been having difficulties reading the results of the ammonia assay with a plate reader and may resort to testing our samples using a different assay protocol next week. The OD600 readings were initially very high at 22 hours and then dropped at 46 hours.
Week 11 (July 9-July 13)
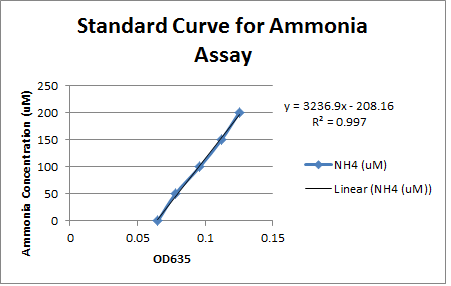
This week we took our last readings from the experiment that we started last week. The OD600 readings taken at 117 hours showed minimal growth over the weekend for all strains except for environmental strain #29 (with carbazole) which increased from 0.086 to 0.313. No other strain showed an increase of 0.100 or greater. This shows that only strain #29 was able to thrive in the carbazole media, possibly indicating that it contains the pCAR plasmid enabling it to use carbazole as a nitrogen source. To verify this we used a new ammonia assay protocol to measure the production of ammonia in the different cultures and theoretically how much carbazole was degraded. Unlike the previous assay we were able to produce a standard curve with a consistent slope based on samples with known amounts of ammonia. However, the only samples that showed any elevation of ammonia levels above the blank were the LD1 samples that were cultured with ammonia chloride to control for the possibility of pseudomonas using ammonia as a nitrogen source. The ammonia levels in this sample were relatively constant which would indicate that the LD1 was not using ammonia as a nitrogen source. Unfortunately the fact that none of the test samples had elevated ammonia levels did not give us any evidence that these strains contain the pCAR plasmid.
Week 12 (July 16 -July 20)
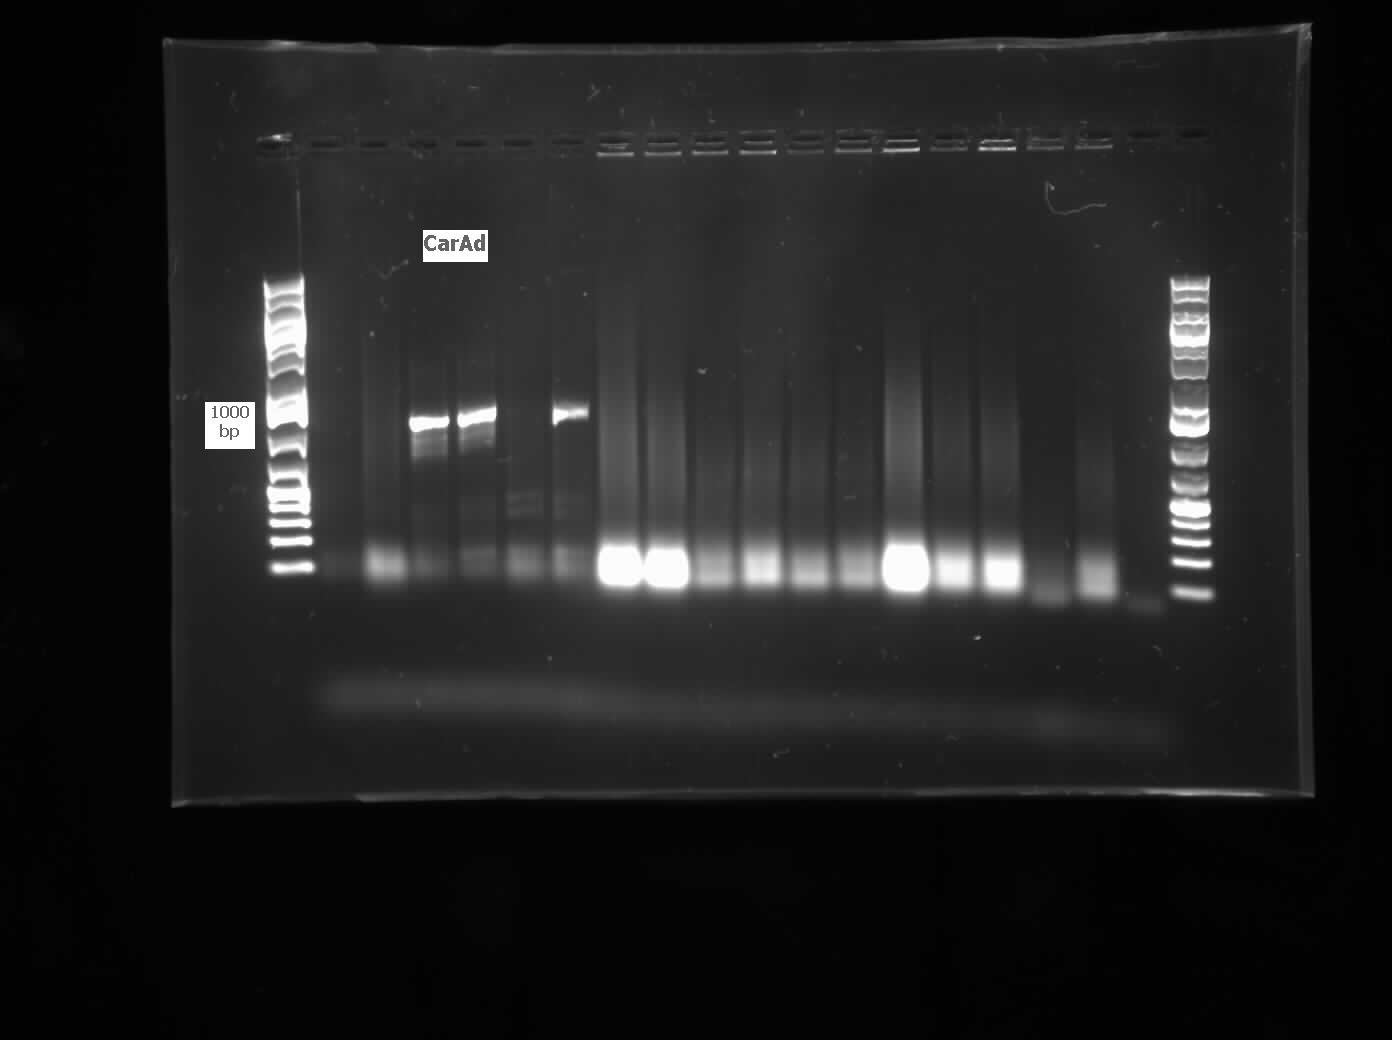
We received a new strain of Pseudomonas, LD2, this week that had previously been used to study the pCAR1 plasmid. It was grown up in PCA media and had its colonies used for colony PCR. We also received our new primers this week, further increasing the chances of successful PCR. Using the new strain and the new primers CarAa, CarAc, and CarAd all showed at least some bands of close to the correct size. After PCR purification we obtained DNA concentrations of 21.3 ng/uL for CarAa, 41.9 ng/uL for CarAc, and 32.8 ng/uL for CarAd. These products were then restriction digested using EcoRI + PstI sites.
 "
"


