Team:Calgary/Project/OSCAR/Desulfurization
From 2012.igem.org
| Line 25: | Line 25: | ||
<h3>1) Find the genes!</h3> | <h3>1) Find the genes!</h3> | ||
<p align="justify">We isolated the plasmid containing the <i>dsz</i> genes from a desulfurising environmental isolate of <i>Rhodococcus</i> using a <a href="https://2012.igem.org/Team:Calgary/Notebook/Protocols/plasmidminiprep">modified miniprep pocedure</a>. As the native promoter has been shown to be repressed by various sulfur-containing compounds (Li et al., 1996), we designed primers for just the coding sequences of the <i>A, B, </i> and <i>C</i> genes. As these genes all have some illegal cutsites in them we constructed them into the PSB1C3 vector and started our <a href="https://2012.igem.org/Team:Calgary/Notebook/Protocols/mutagenesis">mutagenesis protocol</a>.</p> | <p align="justify">We isolated the plasmid containing the <i>dsz</i> genes from a desulfurising environmental isolate of <i>Rhodococcus</i> using a <a href="https://2012.igem.org/Team:Calgary/Notebook/Protocols/plasmidminiprep">modified miniprep pocedure</a>. As the native promoter has been shown to be repressed by various sulfur-containing compounds (Li et al., 1996), we designed primers for just the coding sequences of the <i>A, B, </i> and <i>C</i> genes. As these genes all have some illegal cutsites in them we constructed them into the PSB1C3 vector and started our <a href="https://2012.igem.org/Team:Calgary/Notebook/Protocols/mutagenesis">mutagenesis protocol</a>.</p> | ||
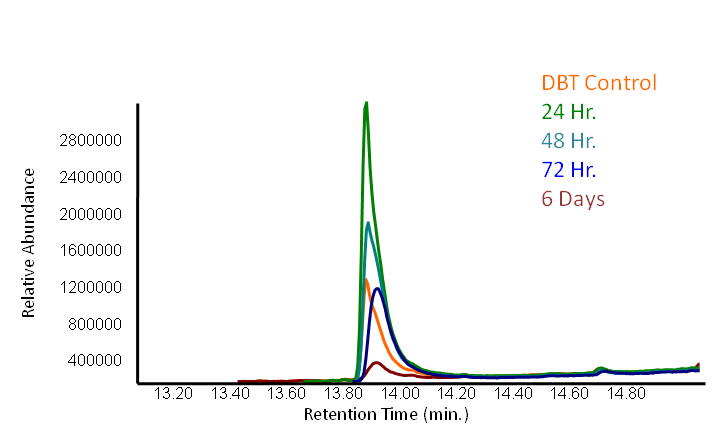
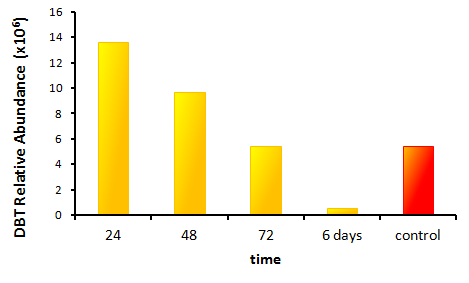
| + | <p> We performed an experiment to measure the desulfurization rate of DBT by our <i>Rhodococcus</i> strain (figures below).</p> | ||
| - | <p></html>[[File:Ucalgary2012 DBTGCMS time points.PNG|center|850px|thumb|Figure 2: <i>Rhodococcus</i> cells were grown in a modified M9 media (refer to | + | <p></html>[[File:Ucalgary2012 DBTGCMS time points.PNG|center|850px|thumb|Figure 2: <i>Rhodococcus</i> cells were grown in a modified M9 media containing 0.125mM DBT with no sulfur containing compounds (refer to desulfurization assay protocol for details). Samples were taken out at different time points and were run through GCMS to detect the amount of DBT. The control only contained modified M9 but no bacteria and it was run through the GCMS after 6 days of being in the incubator. ]]<html></p |
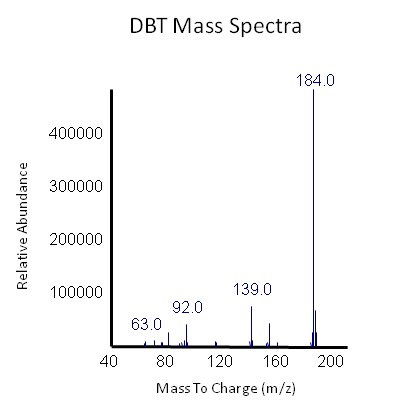
<p></html>[[File:Ucalgary2012 DBT GCMS.PNG|center|850px|thumb|Figure 3: The peak in this mass spectra demonstrates presence of DBT based on its molecular weight of 184 g/mol. This peak is based on the average of our samples at retention time of 13.9 minute (refer to previous graph).]]<html></p> | <p></html>[[File:Ucalgary2012 DBT GCMS.PNG|center|850px|thumb|Figure 3: The peak in this mass spectra demonstrates presence of DBT based on its molecular weight of 184 g/mol. This peak is based on the average of our samples at retention time of 13.9 minute (refer to previous graph).]]<html></p> | ||
| - | <p></html>[[File:Ucalgary2012 DBT GCMS bargraph.PNG|center|650px|thumb|Figure 4: <i>Rhodococcus</i> cells were grown in a modified M9 media (refer to | + | <p></html>[[File:Ucalgary2012 DBT GCMS bargraph.PNG|center|650px|thumb|Figure 4: <i>Rhodococcus</i> cells were grown in a modified M9 media containing 0.125mM DBT with no sulfur containing compounds (refer to desulfurization assay protocol for details). Samples were taken out at different time points and were run through GCMS to detect the amount of DBT. The control only contained modified M9 but no bacteria and it was run through the GCMS after 6 days of being in the incubator. Comparing the control with the sample incubated for 6 days shows that the presence of bacteria increases the degradation rate by about ten times.]]<html></p> |
<h3>2) Mutagenesis: Biobrick Compatability and Increasing DszB Activity </h3> | <h3>2) Mutagenesis: Biobrick Compatability and Increasing DszB Activity </h3> | ||
Revision as of 09:32, 3 October 2012


Hello! iGEM Calgary's wiki functions best with Javascript enabled, especially for mobile devices. We recommend that you enable Javascript on your device for the best wiki-viewing experience. Thanks!
Desulfurization

Why Remove Sulfur?
Sulfur is the third most abundant element in crude oil (Ma, 2010), and when sulfur containing hydrocarbons are burned they release S02 and S03 gasses into the atmosphere. Not only does this reduce the efficiency and value of our product, but it also contributes to global warming, acid rain, and various health issues due to the pollution (Reichmuth et al., 2000). Strict regulation on sulfur in fuels are now in place and low-sulfur gasoline is mandated across all of Canada (Source: Environment Canada). To upgrade the quality of our fuel we need to remove the sulfur but keep the hydrocarbon backbone for combustion.
Our Vision
Though a few pathways for biodesulfurization exist in the microbial world, most involve the destruction of part of the carbon skeleton (an example would be the Kodama pathway). This would effectively reduce the quality of our product. With this in mind the pathway we have chosen is the 4S pathway found in Rhodococcus spp. It has been characterized and shown to remove sulfur from the model substrate dibenzothiophene (DBT) and convert it to 2-hydroxybiphenyl (2-HBP) in a non-destructive manner. DBT and its derivatives make up 70% of the organic sulfur compounds found in crude oil (Ma 2010), and are also some of the most difficult to remove through chemical means. By using the 4S pathway we will be able to upgrade our fuel and remove recalcitrant compounds at the same time.
4S pathway
Four enzymes are involved in the 4S pathway, 3 of which are directly involved in the conversion of DBT to 2-HBP. Dibenzothiophene monooxygenase (DszC) is responsible for the first two steps of the pathway, converting DBT to DBT-sulfoxide and finally to DBT-sulfone (DBTO2) through the addition of 2 oxygen atoms to the sulfur atom. DBT-sulfone monooxygenase (DszA) then carries out the next step in the pathway, producing 2-hydroxybiphenyl-2-sulfinic acid (HBPS) through addition of a final oxygen to the heteroatom. This causes cleavage of the chemical bonds at the sulfur, breaking the ring and converting the compound from a 3-ring structure to a 2-ring structure. HBPS is then converted to the final product of the 4S pathway by HBPS desulfinase (DszB), producing 2-HBP. At this point, the sulfur has been released from the hydrocarbon in the form of sulfite.
The first three steps of the 4S pathway require FMNH2 and subsequently reduces the reductive power of the cell. WIn order to regain this power an oxidoreductase (DszD) uses NADH to recycle the FMNH2, allowing the reaction to proceed. Without DszD the desulfurization pathway would grind to a halt.
The dszA,B, and C genes form an operon on the pSOX plasmid of R. erythropolis, while dszD is found in the chromosome. Naturally this pathway is slow, however using synthetic biology approaches this process can be optimized.
Our Approach
1) Find the genes!
We isolated the plasmid containing the dsz genes from a desulfurising environmental isolate of Rhodococcus using a modified miniprep pocedure. As the native promoter has been shown to be repressed by various sulfur-containing compounds (Li et al., 1996), we designed primers for just the coding sequences of the A, B, and C genes. As these genes all have some illegal cutsites in them we constructed them into the PSB1C3 vector and started our mutagenesis protocol.
We performed an experiment to measure the desulfurization rate of DBT by our Rhodococcus strain (figures below).
2) Mutagenesis: Biobrick Compatability and Increasing DszB Activity
In total the dszABC genes had 7 PstI sites and 1 NotI site that needed to be mutated for the biobrick standard. The primers were designed such that the site was removed without the amino acid being changed. It was also shown that a point mutation changing dszB's 63rd amino acid from Y to F increases the activity of the protein (Oshiro et al., 2007). This mutation was also included in the mass mutagenesis we undertook.
3) Replacing DszD with HpaC & Introducing Catalase
As FMNH2 is consumed in the first three steps of the pathway it needs to be regenerated or the process will grind to a halt. This usually falls to the dszD gene, however it has been shown that the hpaC gene from E. coli performs the same function more efficiently (Gala´n et al., 2000). One problem arises from this though, as high levels of FMNH2 cause the production of toxic hydrogen peroxide inside the cell (Gala´n et al. 2000). To address this issue we have included a catalase gene ( pLacI-katG-LAA) that will remove the peroxide that would be toxic to the cell.
Results
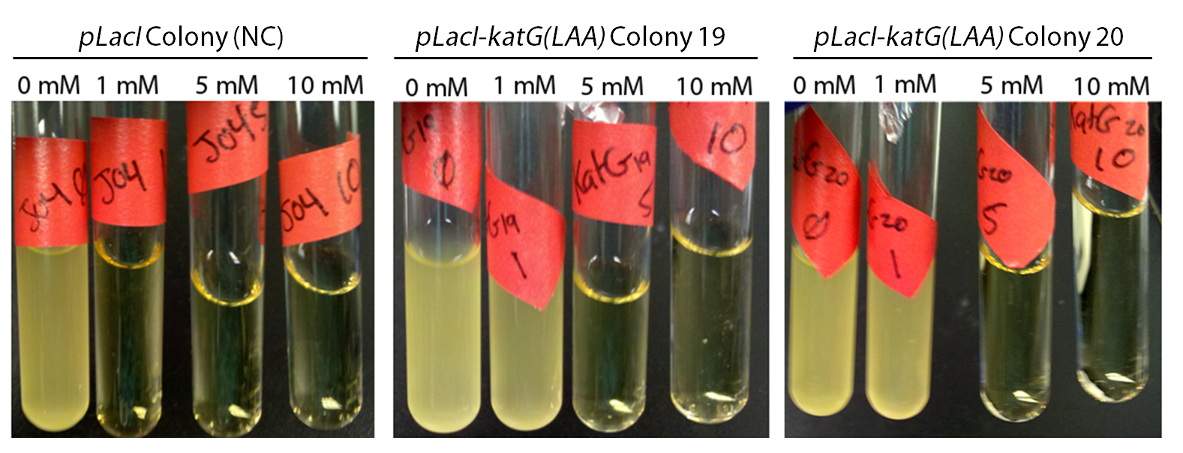
To show that catalase activity increased E. coli survivability in peroxide we cultured the inducible catalase against a catalase-free control with varying levels of peroxide. After growing overnight the negative didn't grow in any culture except in the absence of peroxide, while the catalase cultures could tolerate peroxide. This is shown below in figure 3.
To test the action of HpaC to use NADH to recycle FMN into FMNH2 cell lysates were exposed to NADH and it's absorbance at 340nm (Kamali et al., 2010) was measured over time. Both native HpaC expression and an induced lacI-RBS-katG system were tested as well as a negative control. The results are shown below in figure 4.
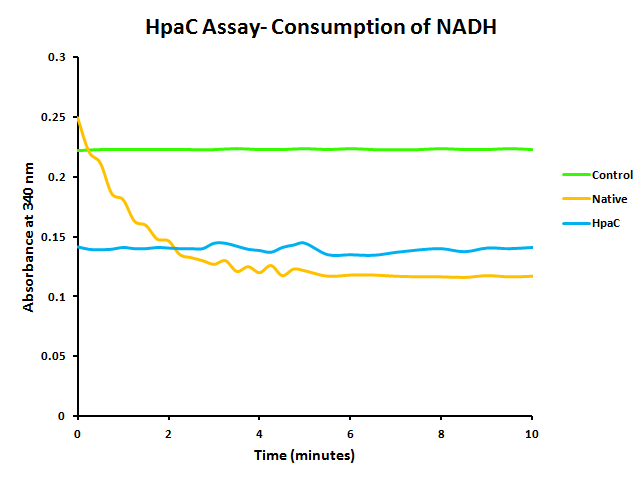
The assay showed that NADH does not abiotically convert into NAD+, however the native expression of HpaC did show a steady decrease in the levels of NADH. The induced overexpression of HpaC caused extremely rapid conversion into NAD+, meaning that it would effectively recycle FMN.
4) Optimizing Gene Order
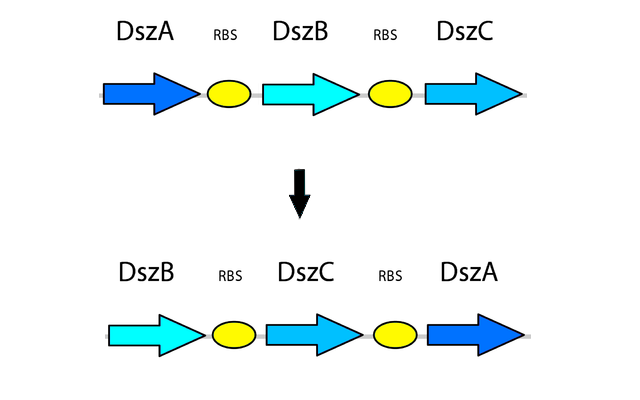
After the genetic elements we intended to use in the pathway were selected, more research was performed into further ways to optimize the system for maximum output and efficiency in order to overcome the issues present in the natural system. Rearranging the order of the genes in the operon has also shown to be beneficial in improving the efficiency of the 4S pathway. The natural order of genes in the operon is dszABC, however the relative activity of the enzymes does not reflect this pattern, as the catalytic activity of DszA:DszB:DszC is 25:1:5 respectively. Because of this, rearranging the operon to dszBCA produces more of the enzyme with lower activity and less of the enzyme with high activity. This is accomplished simply by having more of the less active enzyme transcribed, which translates into more enzyme being present to compensate for its lower activity (Li et al., 2008). In addition, the initiation codon of dszB overlaps with the termination codon of dszA in the natural operon, which leads to translational coupling and further reduces the amount of DszB, leading to a bottleneck in the pathway. By seperately PCR'ing out each of the genes and arranging them in this fashion in a biobrick plasmid, with each separated by an RBS site part (BBa_B0034), this issue is also eliminated.
Final Constructs
After all of the above, we hope to develop four final constructs for our system which will allow us to test the desulfurization under a few different conditions.
The first two constructs have the modified dsz operon (dszB, dszC, dszA) under the control of a constitutive TetR promotor (BBa_J13002) This is to allow for the testing of the optimization circuit, which is under the control of a lacI promotor inducible by IPTG (BBa_J04500). The set-up of these two constructs will therefore allow for the expression of the dsz genes with the ability to test and compare their desulfurization rates
A) On their own
B) With the addition of hpaC
C) With the addition of both hpaC and katG-LAA
This will allow us to determine what the optimal construct and expression levels of the additional genes must be in order to have the most effective sulfur removal system.
Because there are a large number of proteins being expressed in this system, we were concerned about the possibility of inclusion bodies forming which would essentially result in an unusable system, in addition to possible other toxic effects due to protein expression. Because of this a backup system was built, where both the optimization circuit and the dsz operon were under the control of the lacI promoter. This system would allow us to tune the expression of the genes, and determine which expression level is optimal. Once tuning was performed, a constitutive promotor of that strength could then be implemented to maintain optimal gene expression.
Currently, assembly of these final constructs is underway, with only a couple more construction steps before functionality tests can begin.
 "
"

