Team:Groningen/Wetwork
From 2012.igem.org


Contents |
Testing Constructs
(See the greenboard in the office)
Identification of BADmeat promoters by transcriptome analysis
Introduction to the microarray technique
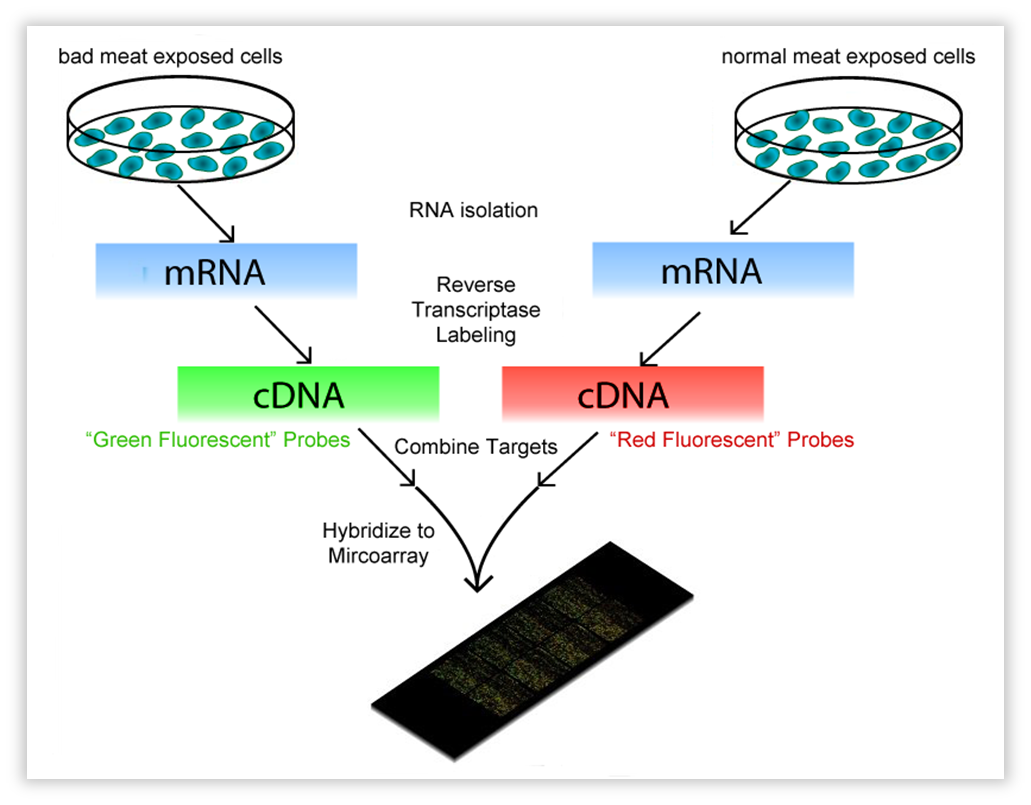
This technique encompasses a comparison between two conditions. These can be a knock-out strain and WT, but also the same strain on a different “diet”. In our case, Bacillus subtilis was subjected to volatiles of fresh vs. bad meat at a certain OD. We use OD 0.8-1.0, representing the late exponential phase,as this should yield much RNA. One isolates all mRNA (the transcriptome) and with reverse transcriptase, the RNA is copied into cDNA. The cDNA is tagged with a fluorescent dye, one condition red, the other green. Both conditions are then brought onto a microarray slide, where DNA of each gene of the organism of interest (in our case, Bacillus) is attached in separate wells (these are called “probes”). When the cDNA is brought onto the slide, it will hybridize with the probes. After fluorescence measurement, one will see a black dot when the gene is not transcribed in both conditions, an orange/yellow one when the gene is transcribed in both, and a green or red one when just one condition causes the transcription of the gene. The ratio of red/green will be a measure for differential expression.
| Fig. w1. Introduction to the Microarray. |
Experimental setup
How do we measure the transcriptome of Bacillus subtilis subjected to meat volatiles? Bacillus should be able to grow without many restrictions to maximize volatiles uptake. --> tried a few setups (also fermentors). In the end: a simple closed system, with a pot with rotten meat (rotten in fridge for 14 days), from which the air (filtered) goes through bacillus in LB medium, stirred with a magnetic stirrer. The air is pumped through the system with a simple peristaltic pump.
| Fig. w2. Experimental set up for determining the volatiles produced by rotting meat. |
Growth conditions Bacillus: volatiles/oxygen depletion
Apart from the microarray, we’ll do this experiment again measuring the OD to see if there is a difference in growth rate for Bacillus.
Identification of rotten meat volatiles
Gas chromatography should identify the different volatiles present in the rotten meat. If it is possible, it also should give quantitative data, however, this is difficult due to the probably large diversity of volatiles present.
Results
Overview of overexpressed and repressed genes
This picture, generated with MolGen's software Genome2d, is giving an idea of the amount of up- and downregulated genes and operons in Bacillus subtilis when subjected to rotten meat volatiles. Soon, after we've done some digging in the subtiwiki, pubmed, etc using this map, we'll give a more detailed overview of promising operons and promoters!
Failed BioBricks
BBa_K090403
Name Gram-positive Shuttle Vector for Chromosomal Integration
Intended Purpose Plasmid backbone for cloning in Bacillus subtilis
Testing Protocol Restriction analysis (single cut)
Results The restriction pattern showed that this biobrick is not as described in the parts registry. The cut plasmid is shorter than the expected size.
BBa_I742123
Name multi-host vector pTG262 converted to BioBrick vector
Intended Purpose plasmid backbone for cloning in Bacilus subtilis
Testing Protocol restriction analysis (single cut) and restriction analysis (dual cut)
Results the restriction enzymes cut at illegal site(s)
 "
"


