Team:METU/CellLimiter
From 2012.igem.org
Overview
In our project we aimed to construct a biofilm which will convert CO to CO2 biologically. Biofilms can be defined as the group of cells firmly united with the help of lipids, protein, DNA and polysaccharides and they can be used for beneficial applications [1] but the main obstacle in the case of biofilm formation is to keep the cell growth under control. We wanted our biofilm to work as a CO filter, due to that reason we designed a quorum sensing (QS) system to control the number of cells and to characterize the activity of biofilm better.
Cell population density changes as the bacteria grow and divide in the biofilm and QS can be defined as the regulation of gene expression during this change. As the cell density increases bacteria starts to release molecules named as autoinducers and according to the concentration of autoinducers gene expression is altered[2]. Eventually bacterial growth will be controlled. In our project we aimed to modify E.coli to synthesize its own QS signals, detect the cell density and prevent the cell division.
How The System Works ?
At the beginning of our QS system there is a constitutive promoter J23116 which is used for the constitutive production of LuxI, an autoinducer synthetase for AHL (acyl-homoserine lactone). Function of LuxI is to synthesize 3OC6HSL (3-oxohexanoyl-homoserine lactone). When 3OC6HSL is produced, it will form a complex with LuxR which is synthesized according to the activity of LuxPL promoter. After that point we aimed LuxR-3OC6HSL complex to increase the activity of LuxPR promoter. Finally LuxPR activity determines the amount of LasR and when PLasR promoter is activated MinC, a cell division inhibitor can be synthesized. Eventually, cell division stops after MinC reaches its critical concentration.
In our system antiholin is constitutively produced by the promoter J23116 and when antiholin level is in between 1000-3000 molecules, the cell will die.[4] Actually,it is the number of free holin molecules that determines if the cell will die or not.
Modelling
KILL-SWITCH MODEL
Quorum sensing model aims to determine number of cells and cell density in our system. We used ODEs to model system and write a program in MATLAB. Although the aim was to get certain numbers, we couldn’t succeed it due to lack of parameters found in literature. As a result we decided to include 18 constitutive promoters found in partsregistry in our model, and after the missing parameters are entered, the program will give desired results.
You can download zip file from here. deneme22.m should be run in MATLAB to run program. Screenshots from program:


Introduction:
Our system starts to work with constitutive production of LuxI. After HSL is produced by LuxI, it forms complex with LuxR whoso transcription is controlled by the activity of LuxPL promoter. HSL&LuxR complex negatively regulates LuxPL promoter, as a result when the number of HSL&LuxR complex increase individual cells will drop expression level of LuxR. LasPR promoter is in the control of LasR expression and as HSL&LuxR complex amount increase the LasR production increases. Because the minC expression controlled by LasR promoter, as LasR increases which means as amount of HSL&LuxR complex increases, the expression level of minC increases. Because minC acts as cell division inhibitor after 55 fold of its normal level, we conclude that increase in the HSL&LuxR complex amount to certain level will cause cell division to stop. Since HSL molecules produced by each cell will eventually affect other cells, thanks to this system we can control cell density.
To understand mechanism correctly and choose constitutive promoter that will control the rate of production of LuxI according to the desired cell density we mathematically modelled system and then create a program that gives user a chance to select starting promoter and to see resulting number of cells graph

Mathematical Model:
In our model, we included all processes shown below.
Equations for mRNA transcription


C is HSL&LuxR Complex
Parameter
Description
N
Plasmid copy number
Px
Promoter Strength
ax
Degradation Rate
Kx
Disassociation (Equilibrium) Constant
nx
Hill Coefficient
tx
Translation Rate
kx
Binding on rate
k-x
Binding off rate
Dx
Diffusion rate
d
cell density
µ
production rate
Simulation Results
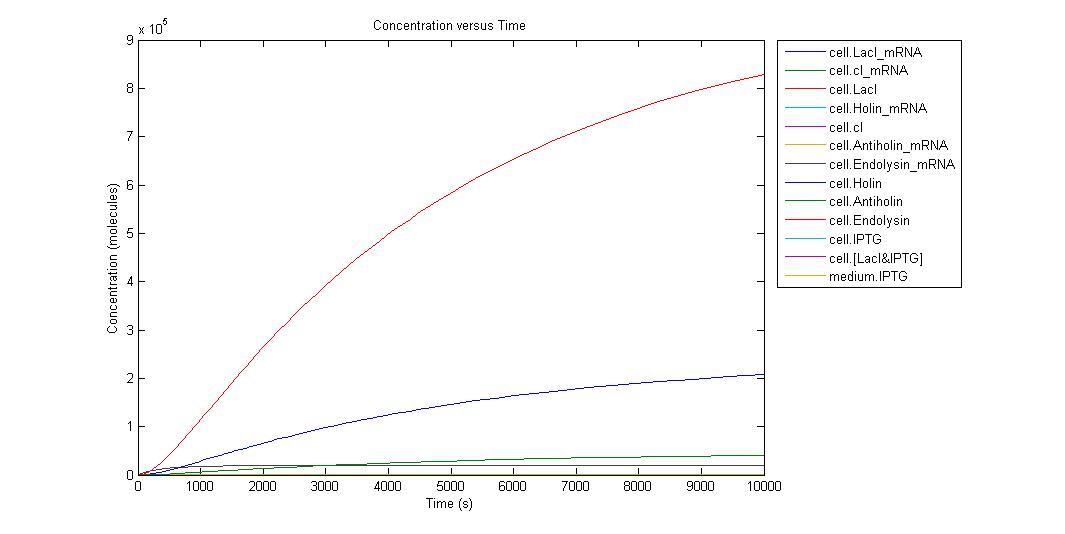
When the IPTG concentration is 0;
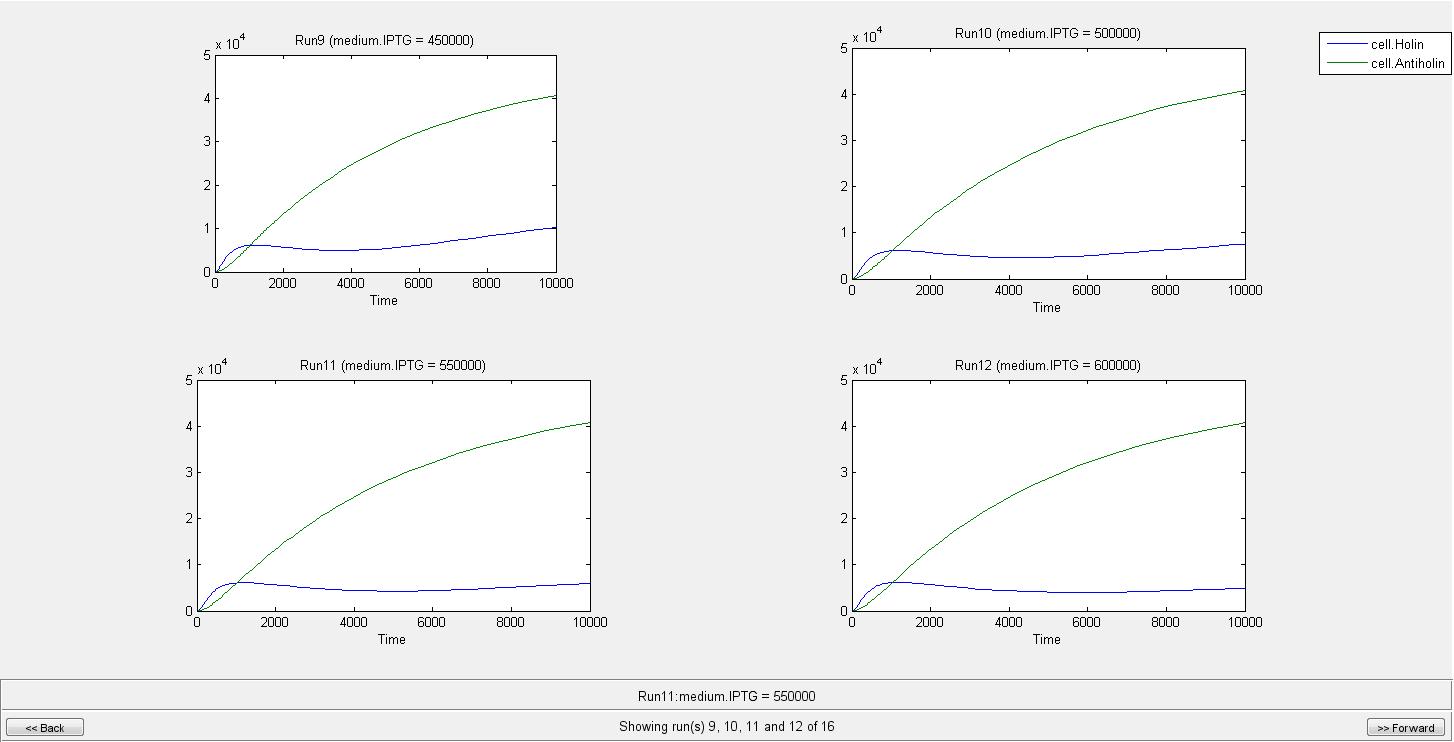
Individual graphs can be accessed here. Because the critical point in kill-switch is “Holin-Antiholin” molecules, we ran simulation in different IPTG concentrations and to understand result easier we select the outputs as Holin and Antiholin. Since translation rate of endolysin is more than Holin and Antiholin we can assume that there will be enough endolysin to make cell lysis occur. Also from the graph above we can understand that endolysin will be in sufficient amount.


By the help of our model, we can conclude that when there is no IPTG molecule, cell lysis occur in 275 s. However when there is 100000 IPTG molecules, cell needs 2290 s to lyse. As can be seen from graphs until a very high IPTG concentration like in the Run14, the increase in Holin can eventually cause lysis. As a result of our model we concluded that after an IPTG concentration of 700000 molecule cell lysis will not occur. We are not considering the generation time of cell in this model since it can later be used for different organisms. If we consider e.coli with a generation time of 20 min, even in the medium with IPTG of 100000 molecules, it will divide before it can lyse.
When IPTG concentration is 700000;

Individual graphs can be accessed here.
Sensivity Analysis
Since the challenging part of modelling is choice of parameters, we conducted a sensitivity analysis to see how much result of our model depends on parameters. By the help of those, the critical values to be measured through experiments can be understood easily.


References
[1]Hansen LH, Knudsen S., Sorensen SJ. (1998). The effect of the lacY gene on the induction of IPTG inducible promoters, studied in Escherichia coli and Pseudomonas fluorescens. Current Microbiology,36 (6), 341-347. doi: 10.1007/s002849900320
[2]The fate of Gram-negative envelope during holin-endolysin lysis [Image]. (2000). Retrieved September 23, 2012, from: http://dx.doi.org/10.1016/S0966-842X(00)01705-4
[3]Tran TA, Struck DK, Young R. (2007). The T4 RI antiholin has an N-terminal signal anchor release domain that targets it for degradation by DegP. Journal Of Bacteriology, 189 (21), 7618-7625. doi: 10.1128/JB.00854-07.
[4]Christos G. Savva, Jill S. Dewey, John Deaton, Rebecca L. White, Douglas K. Struck, Andreas Holzenburg, Ry Young. (2008). The holin of bacteriophage lambda forms rings with large diameter. Molecular Microbiology, 69 (4), 784-793. doi: 10.1111/j.1365-2958.2008.06298.x
 "
"

