 "
"
Team:METU/KillSwitch/Modelling
From 2012.igem.org
KILL-SWITCH MODEL
The aim of kill-switch model is to predict the behavior of kill-switch mechanism in different IPTG concentrations. We first tried to model mechanism by the help of ODEs. Then we used SimBiology toolbox of MATLAB to simulate system.Introduction:
As can be seen from the diagram our circuit involves constitutive production of LacI. LacI Promoter is negatively regulated by LacI. The control mechanism of our system is inhibition of LacI by IPTG molecule. Since LacI is inhibited by IPTG its effect on LacI promoter changes with respect to IPTG concentration.
Holin and Endolysin expression is controlled by cI promoter which is negatively regulated by cI.
Our first assumption in the model is that when the free Holin molecules, which means number of Holin molecules minus number of Antiholin molecules, reach 3000[ref] cell lysis occurs.
Because cI concentration depends on the activity of LacI promoter, we can conclude that in the presence of IPTG the concentration of cI will be high and expression of Holin and Endolysin will be lowered. Due to the constitutive production of Antiholin, we can say that free Holin molecules will be lowered and chance of cell lysis to occur will drop. However, to understand the overall behaviour of system with respect to IPTG concentration we need to model and simulate the system.

Mathematical Model:
In our model, we included all processes shown below.
Equations for mRNA transcription


|
Parameter |
Description |
|
N |
Plasmid copy number |
|
Px |
Promoter Strength |
|
ax |
Degradation Rate |
|
Kx |
Disassociation (Equilibrium) Constant |
|
nx |
Hill Coefficient |
|
tx |
Translation Rate |
|
kx |
Binding on rate |
|
k-x |
Binding off rate |
|
Dx |
Diffusion rate |
Simulation Results
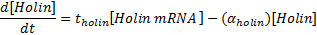
When the IPTG concentration is 0;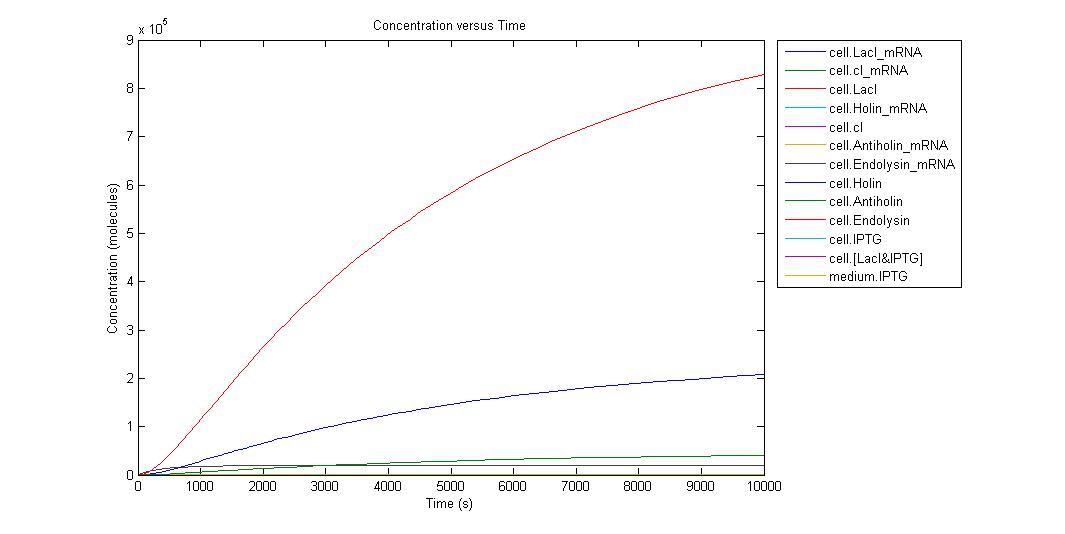
Individual graphs can be accessed here. Because the critical point in kill-switch is “Holin-Antiholin” molecules, we ran simulation in different IPTG concentrations and to understand result easier we select the outputs as Holin and Antiholin. Since translation rate of endolysin is more than Holin and Antiholin we can assume that there will be enough endolysin to make cell lysis occur. Also from the graph above we can understand that endolysin will be in sufficient amount.


By the help of our model, we can conclude that when there is no IPTG molecule, cell lysis occur in 275 s. However when there is 100000 IPTG molecules, cell needs 2290 s to lyse. As can be seen from graphs until a very high IPTG concentration like in the Run14, the increase in Holin can eventually cause lysis. As a result of our model we concluded that after an IPTG concentration of 700000 molecule cell lysis will not occur. We are not considering the generation time of cell in this model since it can later be used for different organisms. If we consider e.coli with a generation time of 20 min, even in the medium with IPTG of 100000 molecules, it will divide before it can lyse.
When IPTG concentration is 700000;

Individual graphs can be accessed here.
Sensivity Analysis
Since the challenging part of modelling is choice of parameters, we conducted a sensitivity analysis to see how much result of our model depends on parameters. By the help of those, the critical values to be measured through experiments can be understood easily.


