Team:Groningen/DesignTest
From 2012.igem.org


Contents |
When is food rotten?
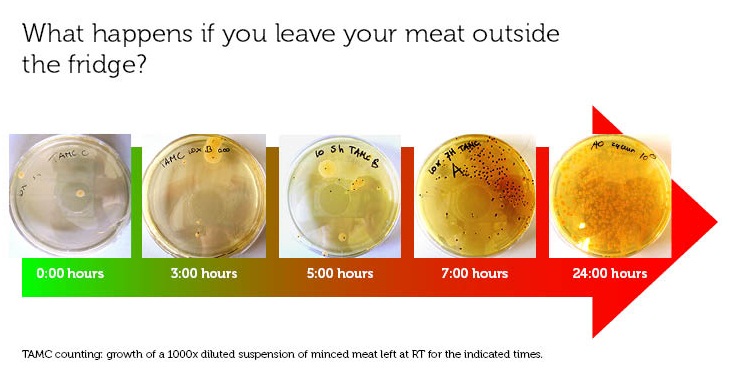
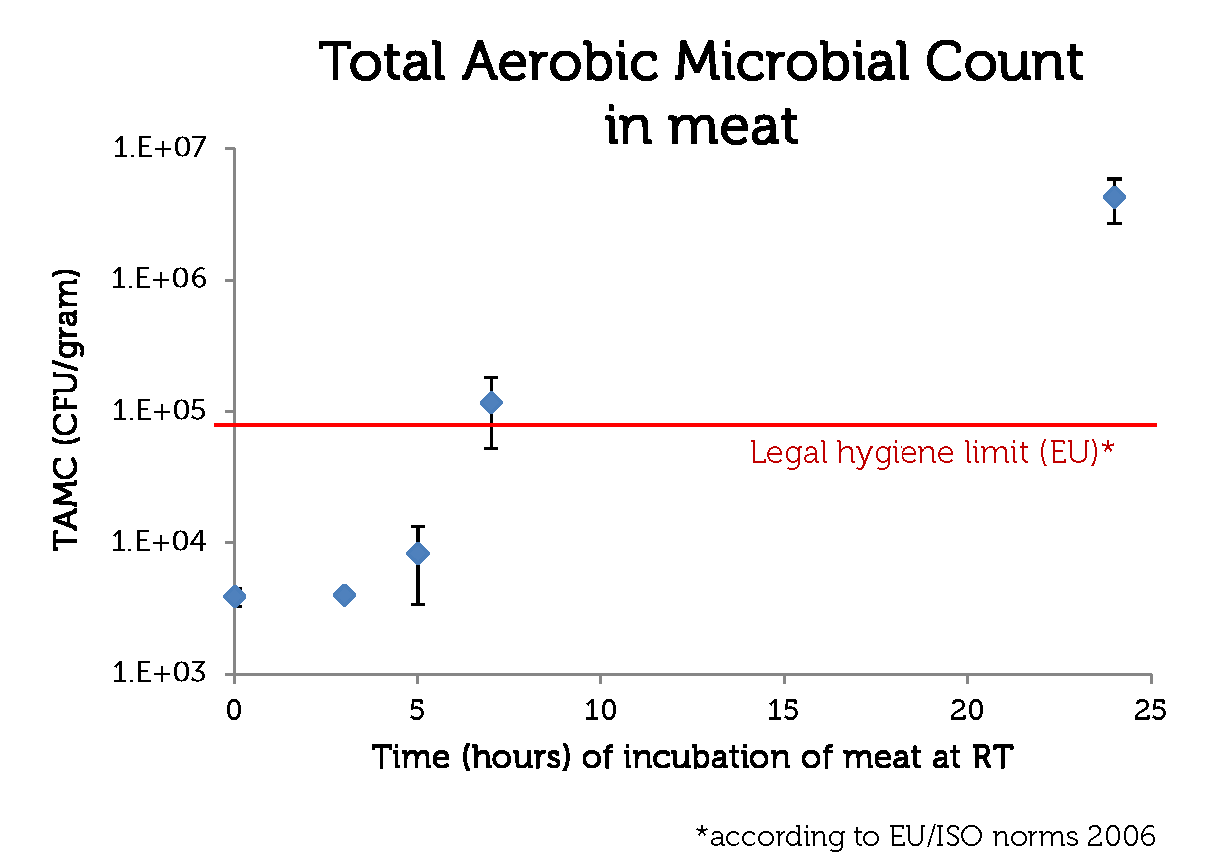
To make a rotting sensor, we have to have a defenition of rotten meat. For this, we used the guidelines of the European Union (2006, [http://www.imik.org/wettelijke_context/Europese_hygienerichtlijn_en_microbiologische_criteria.pdf source (in Dutch))], doing a simple Total Aerobic Microbial Count test. With this test, one can estimate the amount of colony forming units (CFU) per gram meat.
We used 70% pork, 30 % beef minced meat from our local supermarket. We incubated the meat closed from air, in portions of 1 gram at room temperature, and tested the TAMC at timepoints 0, 3, 5, 7 and 24 hours. The test has been done in triplo.
To see the working of our own inbuilt rotting sensor, Elbrich bravely tested the smell and look of meat for 5 hours. According to this we humans smell bad meat pretty well too. Side note: the meat has been exposed to air many times so it could be smelled. The color of the meat changed but little: it turned a bit greyer.
Identification of bad meat volalites by Gas Chromatography-Mass Spectometry (GC-MS)
Introduction to GC-MS
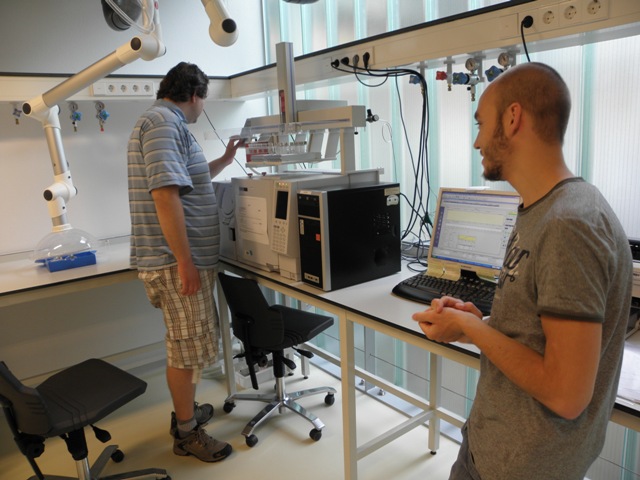
With Gas Chromatography-Mass Spectrometry one can separate and identify the different volatiles present in the rotten meat. The University of Groningen has a large database of compounds available so we can identify what the GC-MS data mean. Drawback of the GC-MS is that the compounds that are identified from the rotten meat, will be destroyed during the measurements. If the GC-MS measurements succeed, it should give qualitative data, which is difficult due to the large diversity of volatiles present. We want to thank Monique Smith from Bio Organic Chemistry for her valuable help.
The first step of separation in the GC is based on the fact that different compounds have different boiling points. Therefore in complete evaporation of the compound should happen all at once and at high temperature.
Later, in the GC oven, the compounds will be condensated and different temperatures will make separation possible. The colums used for GC were HP-5 and HP-1.
Then the measurement continues with Mass Spectrometry. This is a technique to separate compounds based on their mass charge ratio. Our machine uses electron impact, ionization in vacuum and quadrapole separation. Reliability of this measurement depends on the range of the spectrum, reaction(s) with other molecules and how small the differences in molecule structure are.
Organic solvents measurements
The first measurements with only volatiles gave no reliable results, therefore we decided to dissolve the rotten meat into organic solvents to ensure more compounds are available for measurement.
Toluene
Hexane
Methanol
Dichloromethane
Identification of BADmeat promoters by transcriptome analysis
Introduction to the microarray technique
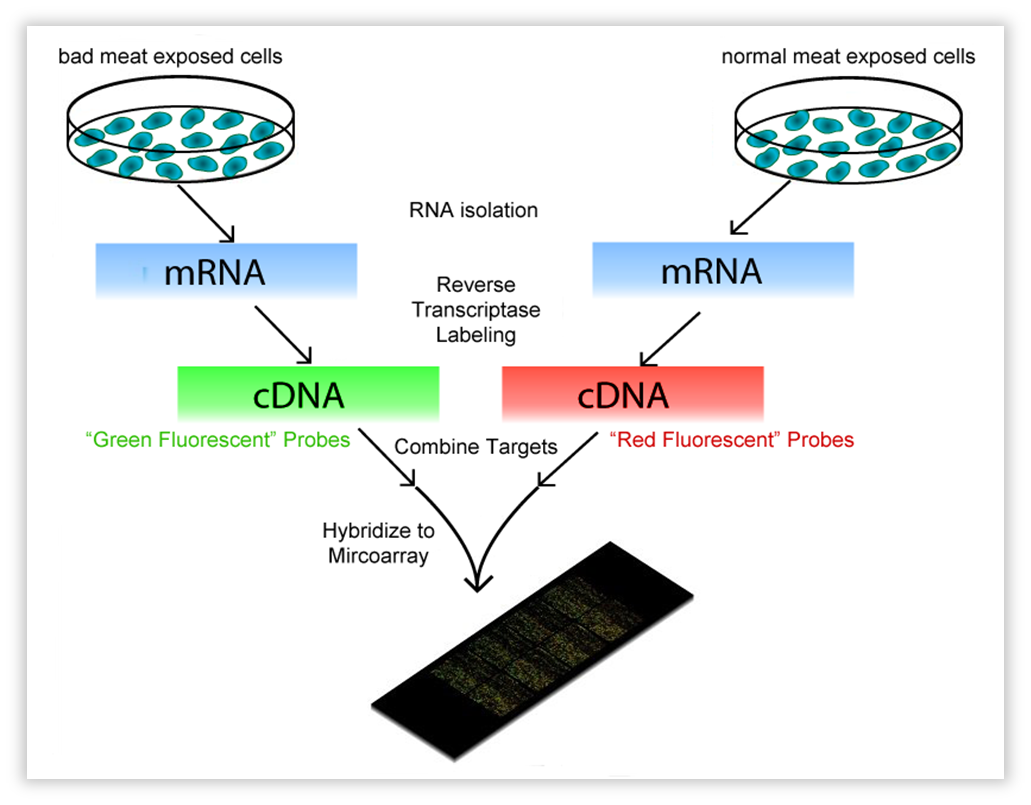
This technique encompasses a comparison between two conditions. These can be a knock-out strain and WT, but also the same strain on a different “diet”. In our case, Bacillus subtilis was subjected to volatiles of fresh vs. bad meat at a certain OD. We use OD 0.8-1.0, representing the late exponential phase,as this should yield much RNA. One isolates all mRNA (the transcriptome) and with reverse transcriptase, the RNA is copied into cDNA. The cDNA is tagged with a fluorescent dye, one condition red, the other green. Both conditions are then brought onto a microarray slide, where DNA of each gene of the organism of interest (in our case, Bacillus) is attached in separate wells (these are called “probes”). When the cDNA is brought onto the slide, it will hybridize with the probes. After fluorescence measurement, one will see a black dot when the gene is not transcribed in both conditions, an orange/yellow one when the gene is transcribed in both, and a green or red one when just one condition causes the transcription of the gene. The ratio of red/green will be a measure for differential expression.
| Fig. w1. Introduction to the Microarray. |
Experimental setup
How do we measure the transcriptome of Bacillus subtilis subjected to meat volatiles? Bacillus should be able to grow without many restrictions to maximize volatiles uptake. --> tried a few setups (also fermentors). In the end: a simple closed system, with a pot with rotten meat (rotten in fridge for 14 days), from which the air (filtered) goes through bacillus in LB medium, stirred with a magnetic stirrer. The air is pumped through the system with a simple peristaltic pump.
| Fig. w2. Experimental set up for determining the volatiles produced by rotting meat. |
Growth conditions Bacillus: volatiles/oxygen depletion
Apart from the microarray, we’ll do this experiment again measuring the OD to see if there is a difference in growth rate for Bacillus.
Results
Overview of overexpressed and repressed genes
This picture, generated with MolGen's software Genome2d, is giving an idea of the amount of up- and downregulated genes and operons in Bacillus subtilis when subjected to rotten meat volatiles.
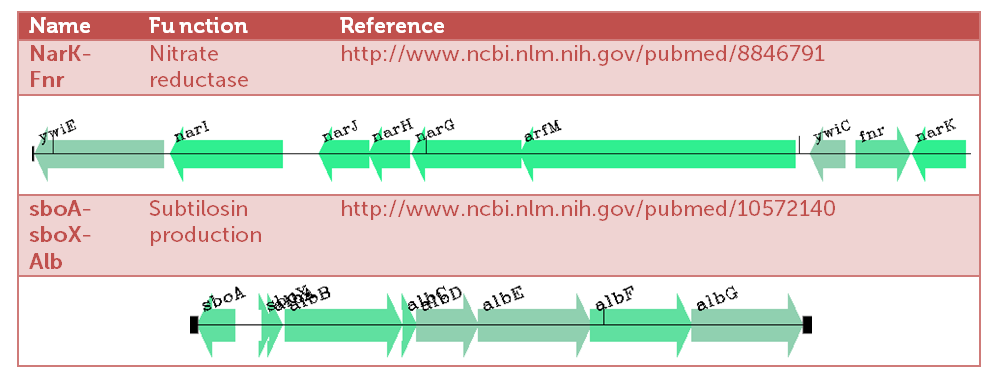
Two highly upregulated operons (upto 40 fold!), and thereby candidates for delivering our "Pbadmeat" are shown in the table below.
Testing Constructs
We designed a construct for testing the different parts of our device. More information will follow, but until now, you can have a peak of the design on our office blackboard!
Failed BioBricks
BBa_K090403
Name Gram-positive Shuttle Vector for Chromosomal Integration
Intended Purpose Plasmid backbone for cloning in Bacillus subtilis
Testing Protocol Restriction analysis (single cut)
Results The restriction pattern showed that this biobrick is not as described in the parts registry. The cut plasmid is shorter than the expected size.
BBa_I742123
Name multi-host vector pTG262 converted to BioBrick vector
Intended Purpose plasmid backbone for cloning in Bacilus subtilis
Testing Protocol restriction analysis (single cut) and restriction analysis (dual cut)
Results the restriction enzymes cut at illegal site(s)
 "
"


