Team:University College London/Module 3/Modelling
From 2012.igem.org
Revision as of 16:14, 20 September 2012 by Erinoerton (Talk | contribs)
Module 3: Degradation
Description | Design | Construction | Characterisation | Modelling | Results | Conclusions
Modelling
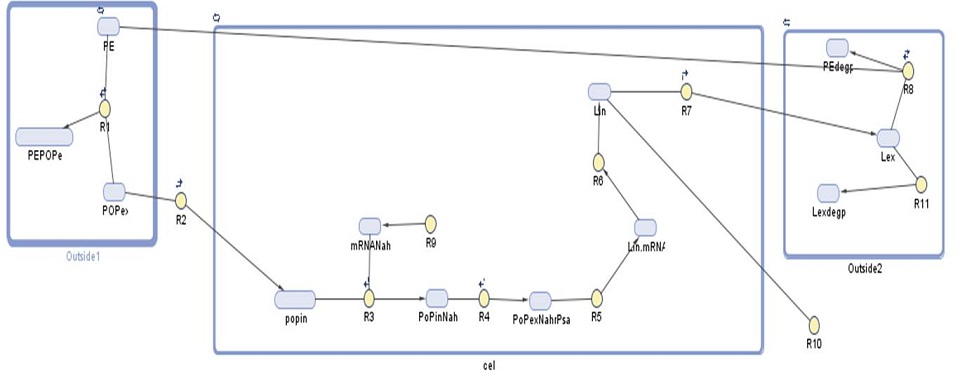
Our gene network model for this module shows the amount of laccase produced by our bacteria. We have used this prediction to find out how many bacteria would be required per cubic meter of sea water in order to effectively degrade polyethylene-based plastics.
| Parameter | Value |
|---|---|
| forward:PE+POPex-PEPOPex | 1000 |
| reverse:PE+POPEX-PEPOPex | 1 |
| forward:POPex-POPin | Example |
| reverse:POPex-POPin | Example |
| forward:NahR+POPin-POPinNahR | Example |
| reverse:NahR+POPin-POPinNahr | Example |
| POPinNahR-Lin+POPinNahR | Example |
| Lin-Lex | Example |
| Lin-Lex | Example |
| forward:Null-NahR | Example |
| reverse:Null-NahR | Example |
| PEPOP+Lex-Lex | Example |
| Species | Initial value (molecules) | Notes |
|---|---|---|
| PE | 0.00345 | |
| Lex | 0.0 | |
| PEPOPex | 9.24E-5 | |
| POPin | 0.5 | Dependent on the concentration gradient: when the conc. in is equal to conc. out rate decreases |
| Nahr | 0.0 | Produced all the time, transcription depends on |
| POPinNahR | 0.0 | Hill function |
| Lin | 0.0 |
| Number | Reaction | Notes |
|---|---|---|
| R1 | PE + POPex ↔ PEPOPex | Pops have 1000 times greater tendency to adhere to plastic than float free in the ocean |
| R2 | POPex ↔ POPin | Based on membrane permeability: diffusion gradient |
| R3 | POPin + mRNA.Nahr → POPin.mRNA.Nahr | The chemical structure/size of POPs is similar to salycilate which is the original compound that react to mRNA.Nahr -> 0 (??) |
| R9 | 0 → mRNA.Nahr | |
| R4 | POPexmRNANahr → POPexmRNANahr.Psal | |
| R5 | POPexmRNANahr.Psal → Lin.mRNA | 0.053 - transcription rate of Laccase in molecules/sec (for laccase size 1500 bp, transcription rate in E.coli 80bp/sec |
| R6 | Lin.mRNA → Lin | 0.053 - translation rate of Laccase in molecules/sec (for laccase size 500 aa, translation rate in E.coli 20aa/sec) |
| R11 | Lin → Lindegp | |
| R7 | Lin → Lex | |
| R12 | Lex → Lexdegp | ?? |
| R8 | Lex → PEdegp |
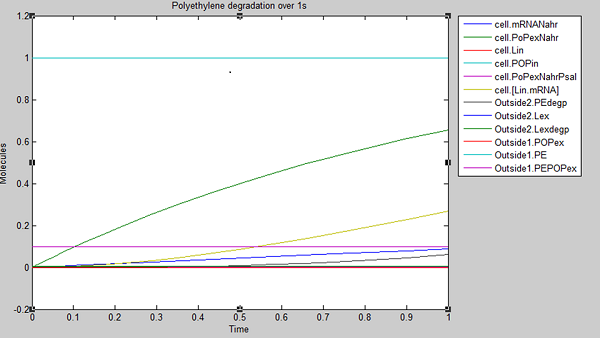
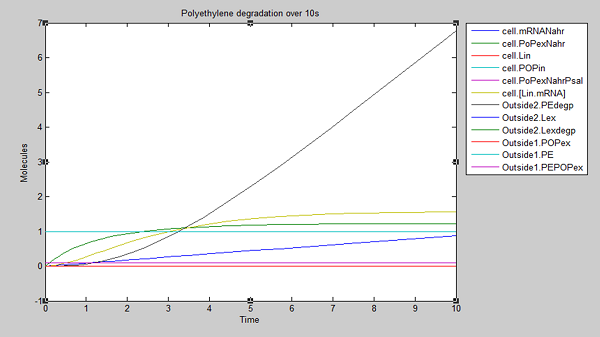
We ran three simulations in SimBiology, each over a different timespan:
 "
"


