Team:University College London/Module 3/Modelling
From 2012.igem.org
Contents |
Module 3: Degradation
Description | Design | Construction | Characterisation | Modelling | Results | Conclusions
Modelling
Building upon our earlier cell model for detection of polyethylene, our cell model for the degradation module aimed to show the amount of laccase our bacteria produce and its role in the degradation of one type of microplastic present in the gyre, polyethylene. With this model we aimed to have an idea of how much plastic we could expect our system to degrade. This would then be used in further predictive modelling to calculate the amount of bacteria needed for the construction of Plastic Republic. The following diagram shows the degradation system, with each reaction Ri and each DNA species explained below.
Our cell model was made in SimBiology, which is a MATLAB extension used to run simulations of the reactions in a specified system. It shows the following reactions taking place in three 'compartments', with each DNA species and reaction explained in further detail below:
1. Outside1: in this compartment we see the association, adherence, and dissociation of persistent organic pollutants (POPs) from polyethylene (PE) (R1). We rely on the POPs to induce our degradation system, increasing from 105 to 106 the specificity to our system.
2. Cell: NahR is a constitutively produced mRNA product (R9). When POP diffuses into the cell (R2), it forms a complex with NahR (R3) which then binds to the pSal promoter (R4) to induce production of laccase (R5, R6). Around 20% of this laccase diffuses outside of the cell (R7), the rest degrades (R10).
3. Outside2: in this compartment, the external laccase degrades PE (R9). Some of this external laccase is degraded (R11).
Species present in the cell model
| Species | Initial value (molecules) | Notes & Assumptions |
|---|---|---|
| PE | 0.044 | Polyethylene found in North Pacific Gyre (value per cubic metre)1,2 |
| POPex | 0.0 | Persistent organic pollutants (ex = extracellular) that are not adhered to plastic surface |
| PEPOPex | 9.24E-5 | Persistent organic pollutants (ex = extracellular) that are adhered to the plastic surface6 |
| POPin | 0.5 | Persistent organic pollutants (in = intracellular) assumed from E. coli membrane permeability 4 |
| mRNANahR | 0.0 | NahR mRNA product |
| POPinNahR | 0.0 | Complex of the above two molecules |
| POPinNahRpSal | 0.0 | Complex of the above molecule and pSal (promoter that induces laccase transcription) |
| Lin | 0.0 | Intracellular laccase |
| Lex | 0.0 | Extracellular laccase |
| LinmRNA | 0.0 | Laccase mRNA product |
| Ldegp | 0.0 | Laccase that degrades due to suboptimal conditions and malformed laccase that cannot carry out polyethylene degradation |
| PEdegp | 0.0 | Polyethylene degraded by laccase |
Reactions taking place in the model
| Number | Reaction | Reaction rate (molecules/sec) | Notes & Assumptions |
|---|---|---|---|
| R1 | PE + POPex ↔ PEPOPex | Forward: 10000 Backward: 1 | Pops have 10000 to 100000 times greater tendency to adhere to plastic than float free in the ocean5 |
| R2 | POPex ↔ POPin | Forward: 0.6 Backward: 0.4 | Rate is based on membrane permeability4 and the diffusion gradient |
| R3 | POPin + mRNA.Nahr ↔ POPin.mRNA.Nahr | Forward: 1 Backward: 0.0001 | Based on the assumption that the chemical structure/size of POPs is similar to salycilate6. Salycilate binds to the NahR mRNA product, which complex then binds to the pSal promoter. |
| R4 | POPinmRNANahr ↔ POPinmRNANahr.Psal | Forward: 78200 Backward: 0.191 9 | NahR to pSal binding based on the assumption that POP-NahR binding has no effect on NahR-pSal binding |
| R5 | POPexmRNANahr.Psal → Lin.mRNA | 0.054 | Transcription rate of Laccase in molecules/sec (for laccase size 1500 bp10, transcription rate in E.coli 80bp/sec8) |
| R6 | Lin.mRNA → Lin | 0.04 | Translation rate of Laccase in molecules/sec (for laccase size 500 aa10, translation rate in E.coli 20aa/sec8) |
| R7 | Lin ↔ Lex | Forward: 0.9 Backward: 0.1 | Our laccase is a periplasmic enzyme, therefore most of it is released in the periplasm. However, we assumed leakage of 20 percent based on suboptimal conditions in the periplasm12, which is able to degrade polyethene. |
| R8 | Lex → PEdegp | Vm: 0.01 Km: 0.114 | Michaelis-Menten kinetics is used to represent degradation of polyethylene. As the literature values for the Km and Kcat for the polyethylene by laccase are not yet obtained experimentally for the original starin that was observed being able to degrade polyethylene13 we made an assumption that degradation of polyethylene is similar to that of lignin (due to polymeric nature of both), values for both Km and Kcat were taken from the literature14 |
| R9 | 0 ↔ mRNA.Nahr | Forward: 0.088 Backward: 0.6 | Transcription rate of NahR in molecules/sec (for NahR size 909 bp7, transcription rate in E.coli 80bp/sec8) under constitutive promoter control |
| R10 | 0 ↔ Lin | ? | Transcription rate of Lin in molecules/sec |
| R11 | Lin → Lindegp | 0.03 | Degradation rate of laccase11 must be taken into account due to suboptimal conditions |
Results
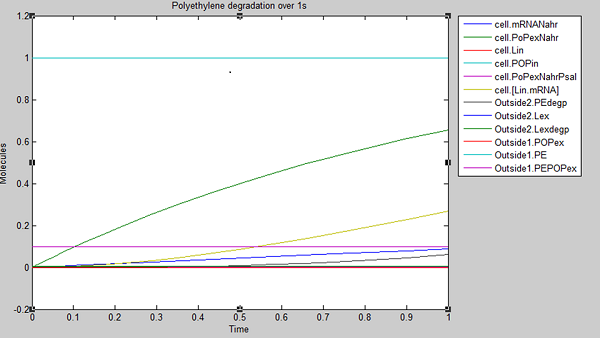
We ran three simulations in SimBiology, each over a different timespan to analyse how laccase production changed over time. In the first second of laccase production, we see polyethylene degradation beginning from around 0.6 sec:
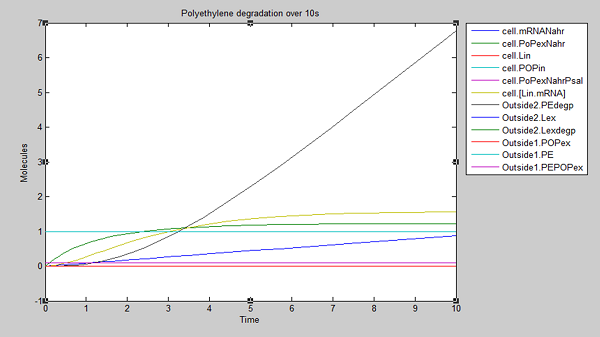
After 10 seconds, the first few molecules have been degraded. The constant diffusion of POPs into the cell is essential for the continuing degradation:
At 100 seconds, the rate of degradation has risen to almost 1 PE molecule per second and we can assume that this will continue as long as the supply of POPs remains constant:
From these results, we can see that our bacteria will degrade polyethylene linearly after an initial non-linear increase in degradation. However, these graphs do not indicate which factors, such as initial concentrations, parameter values and environmental conditions are affecting degradation. For this reason, we decided to run a sensitivity analysis on our model to test the robustness of the model.
Sensitivity analysis
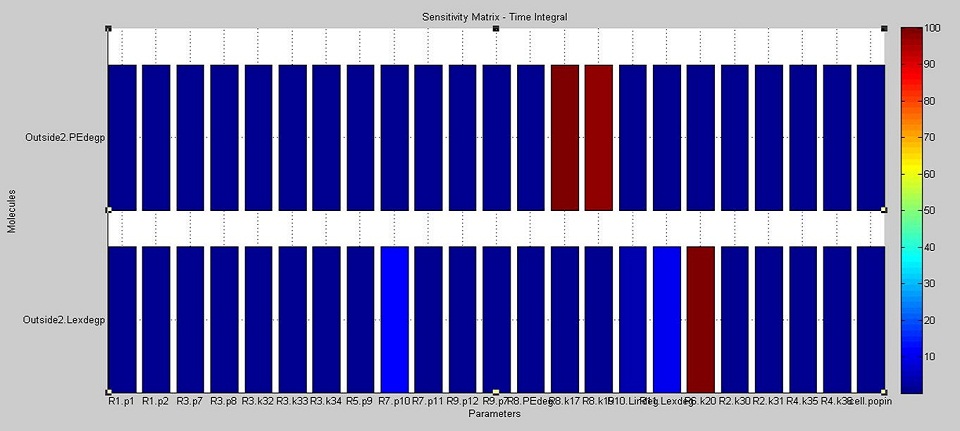
We used SimBiology's sensitivity analysis tool to compute the sensitivity of the cell to variations in each model parameter and the initial amount of each DNA species. The aim was to find out how each of these impacts on the final concentrations of degraded PE and laccase.
The results show that the amount of PE degraded is dependent on the kinetics of the laccase reaction (see the paramters labelled R8.k17 and R8.k19 in the upper bars in the diagram below, which correspond to the Vm and Km values of laccase respectively). On the other hand, the amount of laccase degraded outside the cell is most dependent on the translation rate of laccase (see the parameter R6.k20 in the lower bars of the diagram). In addition, it also moderately affected by the rate of diffusion of laccase outside of the cell (see R7.p10) and therefore on the amount of laccase which ends up outside of the cell (Lexdegp).
The original aim in the development of the degradation model was to analyse the effect of POP, which acts as an environmental factor, on PE degradation. However, through the use of sensitivity analysis, it was deduced that there are more important parameter considerations (such as enzyme activity and translation rates) to take into account. It is reasonable to assume that POP levels are present in constant amounts, hence allowing for degradation of PE which varies with the translation rates and enzyme activity.
Impact on experimental work
We initially believed that it was the amount of POPs present in the environment, rather than the specific activity of the enzyme used and the laccase translation rates, which would have the greatest effect on the amount of polyethylene degraded. Thus, although we had initially identified Rhodococcus ruber C208 laccase strain13 to use in the degradation of polyethylene, we now decided to use a laccase which was easier to obtain (E. coli).
Following the results of the sensitivity analysis, we realised that using a laccase with greater specific activity on PE would have a measurable impact on the amount of plastic our system can degrade. Hence, future modifications to our system will use R. ruber C208 laccase.
References
1. Goldstein M, Rosenberg M, Cheng L (2012) Increased oceanic microplastic debris enhances oviposition in an endemic pelagic insect, Biology Letters 10.1098
2. Andrady AL (2011) Microplastics in the marine environment. Marine Pollution Bulletin 62: 1596-1605
4. Kay J, Koivusalo M, Ma X, Wohland T, Grinstein S (2012) Phosphatidylserine Dynamics in Cellular Membranes. Molecular Biology of the Cell
5. Mato Y, Isobe T, Takada H, Kanehiro H, Ohtake C, Kaminuma T (2001) Plastic Resin Pellets as a Transport Medium for Toxic Chemicals in the Marine Environment. Environ. Sci. Technol. 35: 318-324
6. https://2011.igem.org/Team:Peking_S/project/wire/harvest
7. http://www.xbase.ac.uk/genome/azoarcus-sp-bh72/NC_008702/azo2419;nahR1/viewer
8. http://kirschner.med.harvard.edu/files/bionumbers/fundamentalBioNumbersHandout.pdf
9. Park H, Lim W, Shin H (2005) In vitro binding of purified NahR regulatory protein with promoter Psal. Biochimica et Biophysica Acta 1775: 247-255
10. Laccase size: http://partsregistry.org/Part:BBa_K729002
11. Kushner S (2002) mRNA Decay in Escherichia coli Comes of Age. J Bacteriol. 184: 4658-4665
12. Young K, Silver LL (1991) Leakage of periplasmic enzymes from envA1 strains of Escherichia coli. J Bacteriol. 173: 3609–3614
13. Santo M, Weitsman R, Sivan A (2012) The role of the copper-binding enzyme - laccase - in the biodegradation of polyethylene by the actinomycete Rhodococcus ruber. International Biodeterioration & Biodegradation 208: 1-7
14. 5. Ding Z, Peng L, Chen Y, Zhang L, Gu Z, Shi G, Zhang K (2012) Production and characterization of thermostable laccase from the mushroom, Ganoderma lucidum, using submerged fermentation. African Journal of Microbiology Research 6: 1147-1157. DOI: 10.5897/AJMR11.1257
 "
"


