Team:Goettingen/Notebook/Results
From 2012.igem.org
| Line 97: | Line 97: | ||
=== <b>Prologue</b> === | === <b>Prologue</b> === | ||
| - | The objective of the “Legendary TAR librarians” was the generation of a mutant library of the chemoreceptor Tar (<u>T</u>axis to <u>A</u>spartate and <u>R</u>epellants). Tar is one of five membrane-bound chemoreceptors of <i>E. coli</i> in order to execute chemotaxis.The X-ray structure has been elucidated and is well characterized (see [http://www.rcsb.org/pdb/explore/explore.do?structureId=1wat1 PDB file]). Residues of the Tar ligand-binding domain that interact with aspartate were identified via X-ray crystallography. It is a functional homodimer and its natural ligand is L- | + | The objective of the “Legendary TAR librarians” was the generation of a mutant library of the chemoreceptor Tar (<u>T</u>axis to <u>A</u>spartate and <u>R</u>epellants). Tar is one of five membrane-bound chemoreceptors of <i>E. coli</i> in order to execute chemotaxis. The X-ray structure has been elucidated and is well characterized (see [http://www.rcsb.org/pdb/explore/explore.do?structureId=1wat1 PDB file]). Residues of the Tar ligand-binding domain that interact with L-aspartate were identified via X-ray crystallography. It is a functional homodimer and its natural ligand is L-aspartate [1]. Here, we aimed to identify novel receptors by applying directed evolution to Tar chemoreceptors. To enable <i>E. coli</i> to perceive novel substances five amino acid residues in the ligand binding site were the target. Our method of choice is targeted saturation mutagenesis. In comparison to random mutagenesis, this has the advantage to specifically mutate the selected amino acid residues. |
=== <b>Chapter I: Finding the Library </b> === | === <b>Chapter I: Finding the Library </b> === | ||
| - | The amplification of | + | The amplification of Tar was carried out directly from the <i>E. coli</i> K12 genome. We introduced the BioBrick standard restriction sites by primer design (see [https://2012.igem.org/Team:Goettingen/Project/Computational_Data#Sequences sequencing primers]; Tar for + prefix & Tar rev + suffix). The amplified BioBrick part was then inserted into the vector pUC18. To get rid of BioBrick standard restriction sites in <i>tar</i>, a QuikChange reaction was applied. The <i>Xba</i>I site (nt 420-425) was exchanged from TCTAGt to CCTAGt while keeping the codon for the same amino acid. Our next step was to express the quikchanged <i>tar</i> (TAR_QC) under the constitutive [http://partsregistry.org/wiki/index.php?title=Part:BBa_K777001 Anderson promoters]. |
| - | [[File:Gruppe3 Figure02neu.png|500px|thumb|right| <b>Figure 1: Promoter comparison through a chemotaxis assay </b> Eight promoters of the „Anderson“ collection were cloned in front of the gene coding for the Tar receptor inside the pSB1C3 backbone. Here, we compared the swimming behavior of these strains in chemotaxis assay with M9-swimming agar plates. The chemotaxis assay was conducted as described in the methods section. | + | [[File:Gruppe3 Figure02neu.png|500px|thumb|right| <b>Figure 1: Promoter comparison through a chemotaxis assay. </b> Eight promoters of the „Anderson“ collection were cloned in front of the gene coding for the Tar receptor inside the pSB1C3 backbone. Here, we compared the swimming behavior of these strains in chemotaxis assay with M9-swimming agar plates. The chemotaxis assay was conducted as described in the methods section. L-aspartate served as the attractant in the central Whatman paper. The numbers next to each halo correspond to the promoter activities reported by the Berkley University in 2006. <b>(A)</b> The constructs were transformed in the Δtar strain. The picture was taken after 3 days incubation at 33 °C. The halos of the strongest promoters (J23100, x2547 and J23104, x1831) had a slightly bigger radius than the other promoter constructs. In addition, slight chemotaxis could be observed for these strains. The drop of the construct J23106 was smeared during the application and is therefore not evaluable. <b>(B)</b> The constructs were transformed in the BL21 strain, that naturally expresses the Tar receptor. The picture was taken after 1 day incubation at 33 °C. In general, halo size did not vary strongly. The halos of the strongest promoters (J23100, x2547 and J23104, x1831) had the biggest radius. The halo of J23106 (x1185) showed the smallest radius, although this promoter has the third stronges activity. Chemotaxis could be observed for every strain.]] |
| - | With these various promoter constructs in hand, a swimming assay was performed testing promoter activity. This experiment revealed promoter J23100_TAR_QC in pUC18 background having the best swimming abilities (data not shown). To generate a chemoreceptor library our method of choice requires the absence of the <i>Bsa</i>I restriction site in both, the insert and the vector backbone, of the cloned plasmid. Since pUC18 contains a <i>Bsa</i>I restriction site in the plasmid backbone within the selection marker <i>bla</i> gene, this vector is not appropriate for targeted saturation mutagenesis. Thus, the construct was cloned in the BioBrick vector pSB1C3. There are two advantages coming along: Firstly, we need to send our designed BioBricks in this particular vector this year and secondly, this vector contains a chloramphenicol resistance gene and hence | + | With these various promoter constructs in hand, a swimming assay was performed testing promoter activity. This experiment revealed promoter J23100_TAR_QC in pUC18 background having the best swimming abilities (data not shown). To generate a chemoreceptor library our method of choice requires the absence of the <i>Bsa</i>I restriction site in both, the insert and the vector backbone, of the cloned plasmid. Since pUC18 contains a <i>Bsa</i>I restriction site in the plasmid backbone within the selection marker <i>bla</i> gene, this vector is not appropriate for targeted saturation mutagenesis. Thus, the construct was cloned in the BioBrick vector pSB1C3. There are two advantages coming along: Firstly, we need to send our designed BioBricks in this particular vector this year and secondly, this vector contains a chloramphenicol resistance gene and hence it is lacking the undesired <i>Bsa</i>I site. |
| - | The promoter constructs in the new vector backbone were tested in chemotaxis assays for swimming towards L-aspartate (Fig. 1). Thereby, all eight tested promoter constructs were dropped around in the same distance to an octahedron Whatman paper soaked with L-aspartate. As control serves the strain BL21 transformed with Tar_QC under the control of the | + | The promoter constructs in the new vector backbone were tested in chemotaxis assays for swimming towards L-aspartate (Fig. 1). Thereby, all eight tested promoter constructs were dropped around in the same distance to an octahedron Whatman paper soaked with L-aspartate. As a control serves the strain BL21 transformed with Tar_QC under the control of the eight promoters. ∆Tar was complemented with Tar_QC. As expected, the strongest promoters (18C = K777001, 18K = K777002) show the strongest movement. It was not possible to evaluate 18O (K777004). All in all, the complementation worked, but not to the expected extend. |
| Line 114: | Line 114: | ||
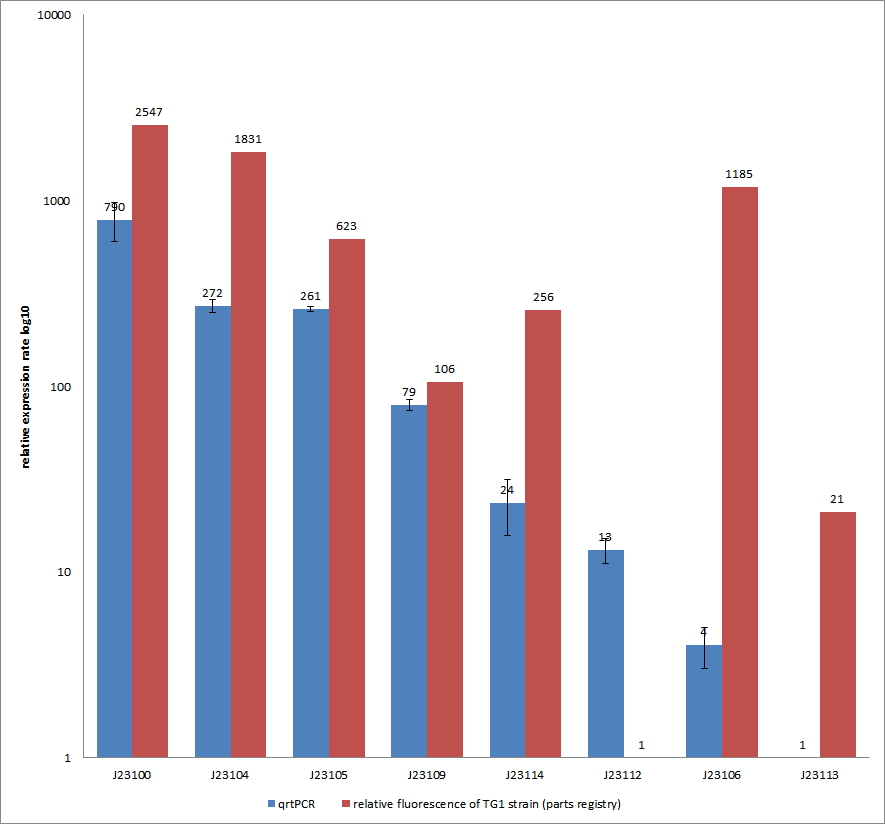
| - | [[File:QrtPCR new.png|500px|thumb|right| <b>Figure 2: Comparison of relative expression rates of the chemoreceptor Tar from constitutive promoters by qrtPCR and relative fluorescence or RFP expressed by the same promoters (see parts registry, [http://partsregistry.org/Promoters/Catalog/Anderson Anderson family]).</b> The blue bar indicates the measured expression rates for our constructs (J23100, J23104, J23105, J23106, J23109, J23112, J23113, J23114) and the red ones those for the literature values represented in the | + | [[File:QrtPCR new.png|500px|thumb|right| <b>Figure 2: Comparison of relative expression rates of the chemoreceptor Tar from constitutive promoters by qrtPCR and relative fluorescence or RFP expressed by the same promoters (see parts registry, [http://partsregistry.org/Promoters/Catalog/Anderson Anderson family]).</b> The blue bar indicates the measured expression rates for our constructs (J23100, J23104, J23105, J23106, J23109, J23112, J23113, J23114) and the red ones those for the literature values represented in the parts registry. The measurements are illustrated in a logarithmic application. The standard variation was calculated for our measured values (black error bar; [https://2012.igem.org/Team:Goettingen/Project/Computational_Data#Characterization_of_constitutive_promoters_by_qrtPCR raw dataset]).]] |
| - | Additionally, our goal was to see a correlation between the mRNA expression levels and the motility of our engineered <i>E. coli</i> on swimming plates. Therefore, we used quantitative real-time PCR (qrtPCR) as a powerful tool for | + | Additionally, our goal was to see a correlation between the mRNA expression levels and the motility of our engineered <i>E. coli</i> on swimming plates. Therefore, we used quantitative real-time PCR (qrtPCR) as a powerful tool for quantification of gene expression. We used this method to examine the expression rate of the eight different constitutive promoter constructs from the parts registry that were further confirmed by swimming assays. The reported activities of these promoters are given as the relative fluorescence of these plasmids in strain TG1 (parts registry: [http://partsregistry.org/Part:BBa_J23100 Part:BBa_J23100]). The results are depicted in Figure 2. Here, promoter constructs were cloned into the vector pSB1C3 and expressed in <i>E.coli</i> BL21DE3 grown in LB-media (lysogeny broth). The measurements were performed as a triplet for each construct and a house-keeping gene coding for a 16SrRNA (<i>rrsD</i>) as reference. Additionally, we included H<sub>2</sub>O as negative no template control to predict possible contaminations. For the evaluation of our results, the 2<sup>–ΔΔCT</sup> (Livak) method was applied. We used the weakest promoter with the lowest expression rate as calibration for the calculations and as reference the housekeeping gene. The data was then compared to the predetermined expression rates from iGEM2006_Berkeley group. |
| - | Overall, as shown in Figure 2, each tested promoter construct indicated differences in expression rates in comparison to values from the parts registry. In fact, both data-sets were collected by methods which produce data at different points after gene expression. A common trend was detected for the strongest promoters J23100, J23104, J23105 and J23109 together with the weakest promoters J23112 and J23113. Conspicuously, the promoter J23109 revealed for qrtPCRand for relative fluorescence measurements nearly the same expression rates. The expression rates of J23114 and J23106 indicated massive differences in their expression rates and no common trend with the expression values from the parts registry. We detected comparable positioning in the ranking of expression rates (see [https://2012.igem.org/Team:Goettingen/Project/Computational_Data#Raw_Datasets characterization of constitutive promoters by qrtPCR])for six out of our eight promoters. The promoters characterized as relatively strong were also, in our case, responsible for higher expression rates and the other way around. In the case of promoter J23114 and J23106, the data-sets exhibited a completely different characterization compared to those in the parts registry. | + | Overall, as shown in Figure 2, each tested promoter construct indicated differences in expression rates in comparison to values from the parts registry. In fact, both data-sets were collected by methods which produce data at different points after gene expression. A common trend was detected for the strongest promoters J23100, J23104, J23105 and J23109 together with the weakest promoters J23112 and J23113. Conspicuously, the promoter J23109 revealed for qrtPCRand for relative fluorescence measurements nearly the same expression rates. The expression rates of J23114 and J23106 indicated massive differences in their expression rates and no common trend with the expression values from the parts registry. We detected comparable positioning in the ranking of expression rates (see [https://2012.igem.org/Team:Goettingen/Project/Computational_Data#Raw_Datasets characterization of constitutive promoters by qrtPCR]) for six out of our eight promoters. The promoters characterized as relatively strong were also, in our case, responsible for higher expression rates and the other way around. In the case of promoter J23114 and J23106, the data-sets exhibited a completely different characterization compared to those in the parts registry. |
All in all, these results confirm the properties of J23100 as the best swimmer. | All in all, these results confirm the properties of J23100 as the best swimmer. | ||
| Line 124: | Line 124: | ||
=== <b>Chapter II: Designing the Library</b> === | === <b>Chapter II: Designing the Library</b> === | ||
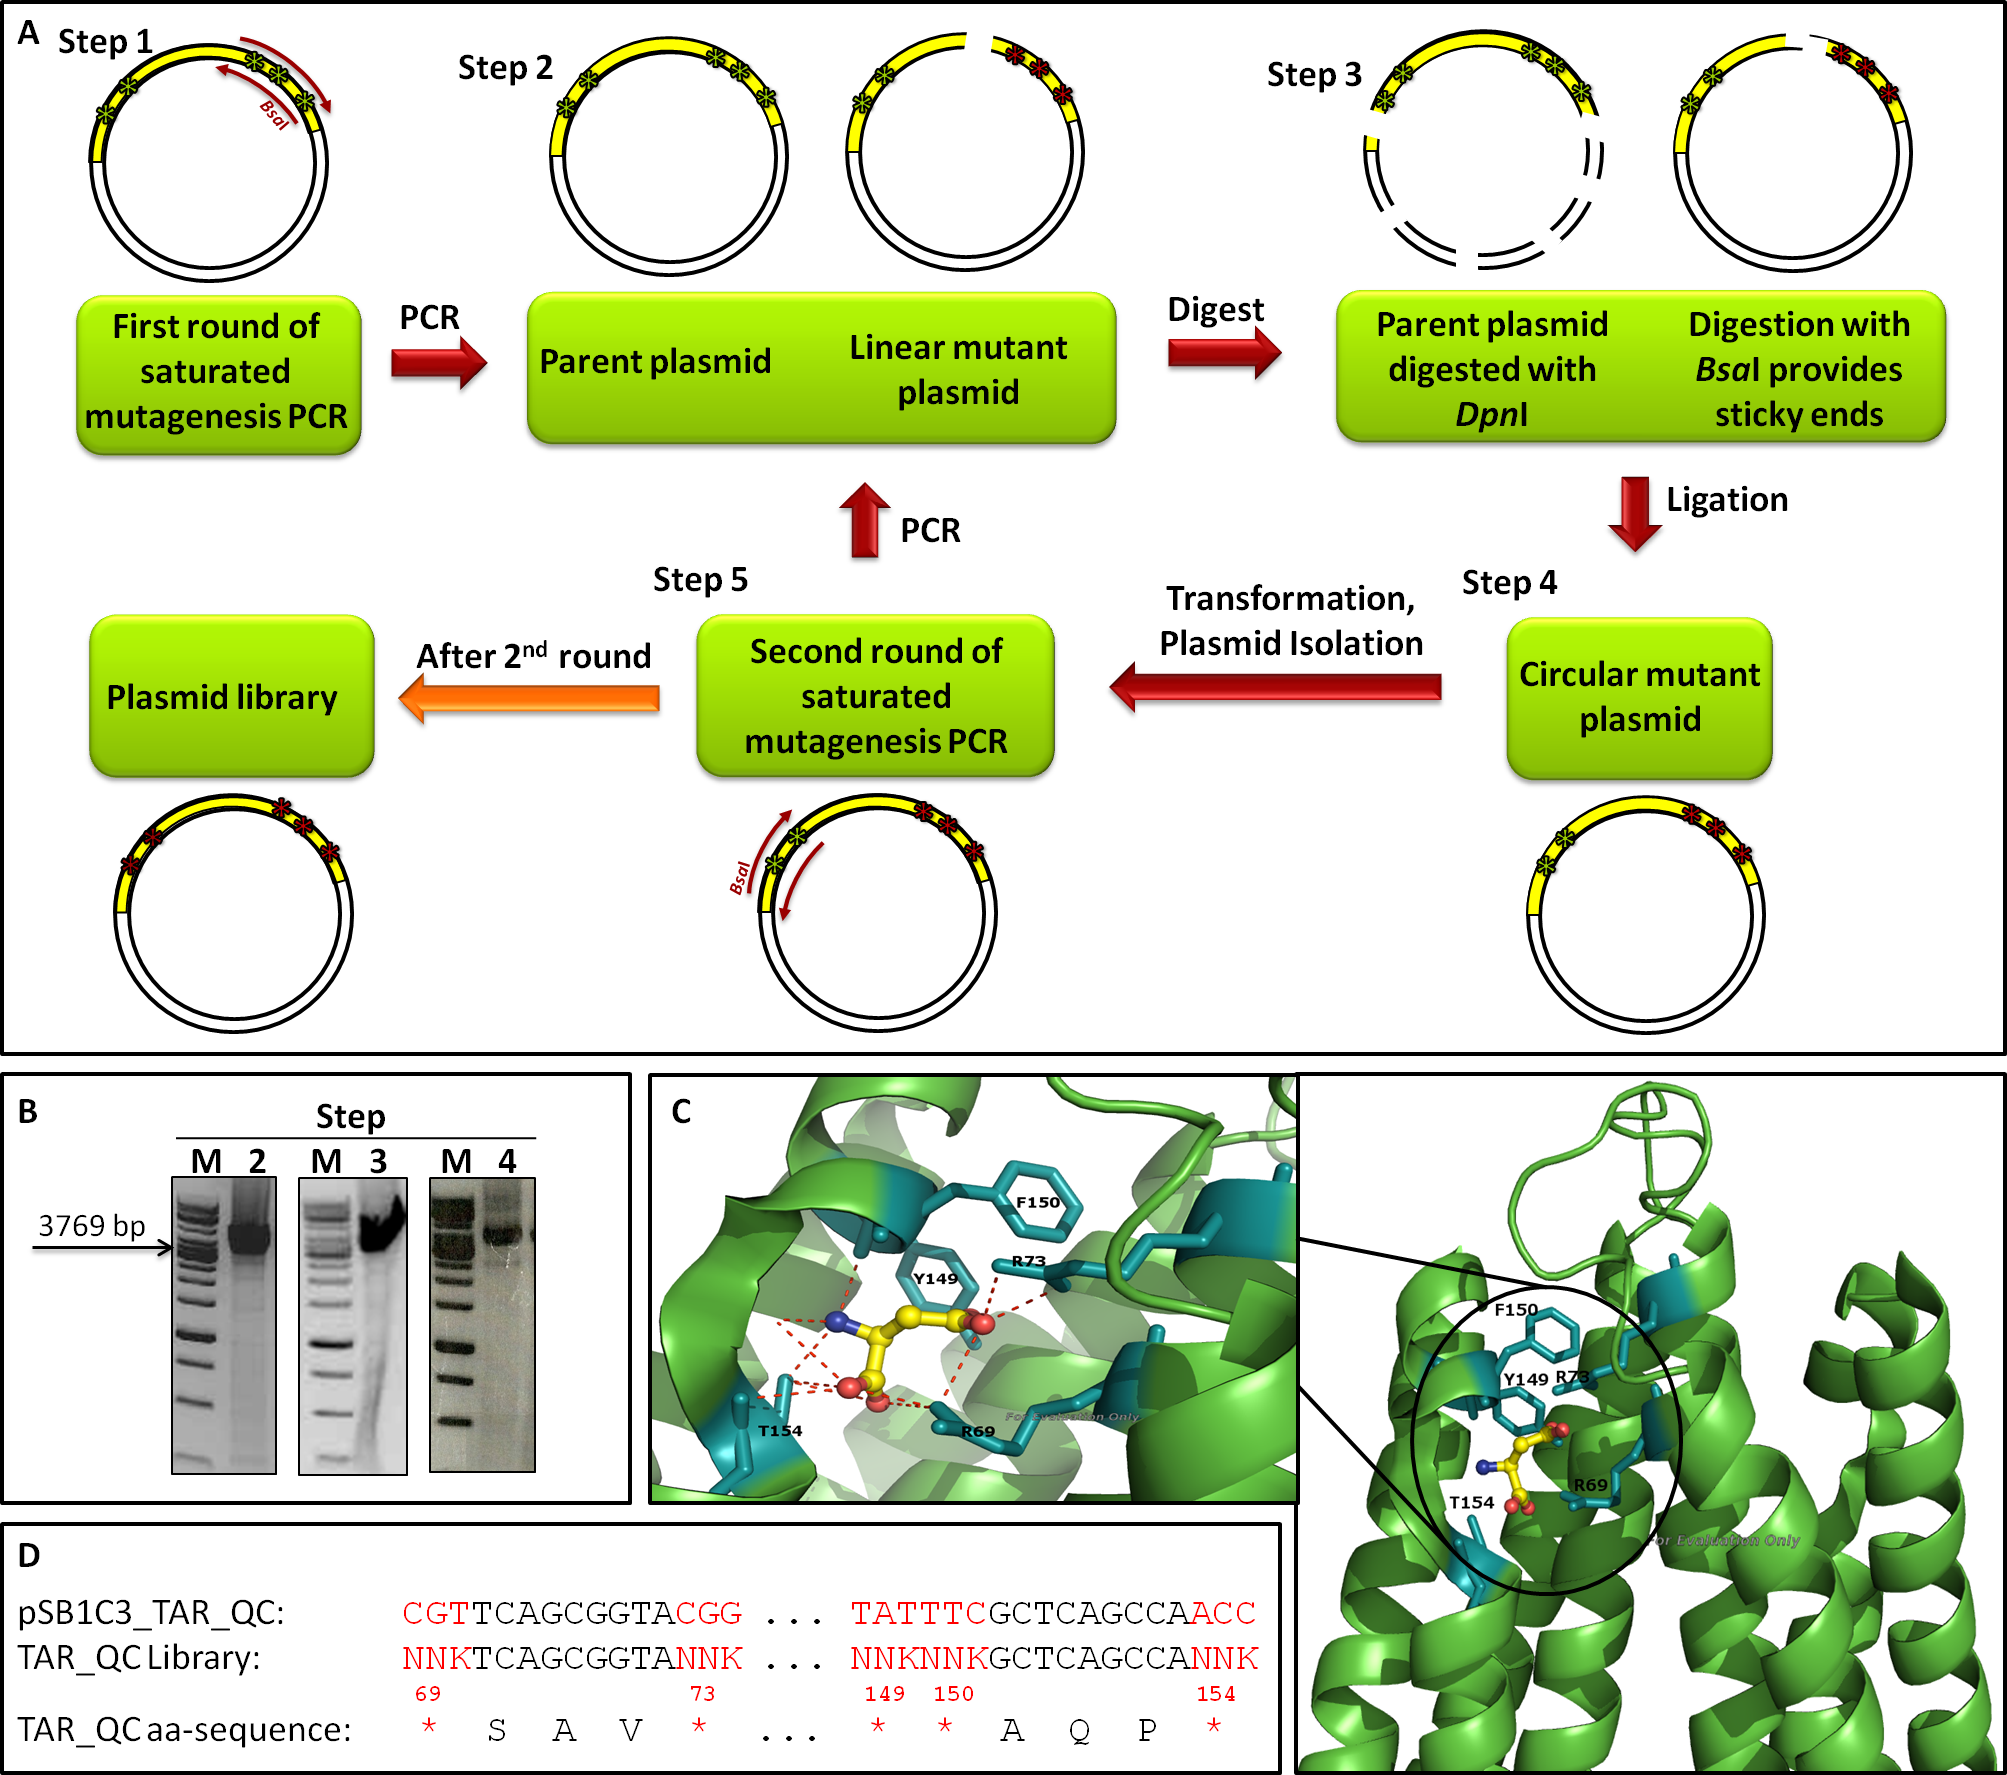
| - | [[File:Gruppe3 | + | [[File:Gruppe3 Figure03neu.png|900px|thumb|center| <b>Figure 3: Library design of the quikchanged chemoreceptor Tar. </b> <b>(A)</b> Schematic representation of the applied procedure for library generation of the quikchanged Tar_QC under a strong promoter. Saturated PCR mutagenesis was performed in two rounds. In the first step the mutagenesis primers, that randomly mutate three triplets and introduce a <i>Bsa</i>I restriction site (scarless mutagenesis), were designed. In the second step the parent plasmid was amplified with these primers hybridizing to the parent plasmid pSB1C3_18C_TAR_QC. In step three, the parent plasmid was digested with <i>Dpn</i>I and the mutated plasmid with <i>Bsa</i>I to provide sticky ends. <i>Bsa</i>I cuts outside the restriction site. In step four the plasmid was ligated and afterwards transformed with the mutated DNA into electrocompetent DH10B cells. Subsequently, the DNA was isolated for the second round of mutagenesis PCR (step five), where two other triplets were mutagenized repeating the previous steps. After finishing the 2<sup>nd</sup> round the plasmid library was isolated from the liquid culture. The 1<sup>st</sup> and 2<sup>nd</sup> round of the mutation library covered 10<sup>5</sup> clones. The two rounds were combined to one library with a final diversity of 2x 10<sup>5</sup>. <b>(B)</b> Representative pictures of 0.8% Agarose gels from the 2<sup>nd</sup> saturated PCR mutagenesis round of step two after PCR (2), step three after double digest with <i>Dpn</i>I and <i>Bsa</i>I (3) and step four after ligation of the mutant plasmid (4). The size of the plasmid is always 3769 bp. As standard a 1 kb Molecular Weight Marker (M; Fermentas) was used. <b>(C)</b> Overview (right) and detailed (left) PYMOL images of Tar with aspartate in its binding pocket (PDB ID: 1WAT). The mutated amino acid residues involved in ligand binding are labeled. <b>(D)</b> Alignment of the regions involved in ligand binding of the original DNA sequence of Tar_QC (pSB1C3_TAR_QC), the library sequence (TAR_QC Library) and the amino acid sequence (TAR_QC aa-sequence). The upper two lines show the site of mutation, here. K stands for guanine or thymine, N for any possible base. Corresponding to the DNA sequence the amino acid sequence is shown with labeled positions of mutated amino acid residues (*) above. G: guanine, C: cytosine, A: adenine, T: thymine.]] |
| - | The introduction of targeted saturation mutations requires mutant primer design ([https://2012.igem.org/Team:Goettingen/Project/Computational_Data#Primers primer mutagenesis]). We divided our library generation into two rounds, each mutating different residues (Fig. 3 A). Amino acids 149, 150 and 154 were mutated in the first (1<sup>st</sup>), amino acids 69 and 73 in the second round (2<sup>nd</sup>). Each library generation consists of the following steps: 1. | + | The introduction of targeted saturation mutations requires mutant primer design ([https://2012.igem.org/Team:Goettingen/Project/Computational_Data#Primers primer mutagenesis]). We divided our library generation into two rounds, each mutating different residues (Fig. 3 A). Amino acids 149, 150 and 154 were mutated in the first (1<sup>st</sup>), amino acids 69 and 73 in the second round (2<sup>nd</sup>). Each library generation consists of the following steps: 1. primer design, 2. saturated mutagenesis PCR, 3. <i>Dpn</i>I/<i>Bsa</i>I restriction, 4. ligation, transformation and plasmid isolation, 5. PCR for 2<sup>nd</sup> round; the template for 2<sup>nd</sup> round being the isolated mutated plasmids of the 1<sup>st</sup>. After 2<sup>nd</sup> round, the plasmid library is completed. Figure 3 B shows gels from the 2<sup>nd</sup> round of mutagenesis. The gels of step 2 (PCR), step 3 (digest) and step 4 (ligation) show a band of the expected size at 3769 bp, indicating that the intermediate steps were successful. The primers we used for the mutagenesis PCR randomly mutate five amino acids residues at positions 69, 73, 149, 150 and 154, which are known to bind to L-Aspartate (Fig. 3 C). The outcome of the mutations is depicted in Figure 3 D. |
| - | [[File:Gruppe3 | + | [[File:Gruppe3 Figure04neu.png|500px|thumb|right| <b>Figure 4: Characteristics of the generated chemoreceptor Tar_QC library. </b> <b>(A)</b> Representation of the diversity reached in the two rounds of Tar_QC library generation. Both, 1<sup>st</sup> and 2<sup>nd</sup> round, yielded 10<sup>5</sup> clones. After combination of the two diversities the merged library comtains 2x 10<sup>5</sup> clones. <b>(B)</b> Sequencing chromatogram excerpt of the generated chemoreceptor Tar_QC library in both rounds. Sequencing results of isolated DNA from the liquid cultures the 1<sup>st</sup> attempt (top) with mutations for the amino acidsat position 149, 150 and 154 and 2<sup>nd</sup> attempt (bottom) with mutations at 69 and 73. Inserted mutations are indicated by the triplets consisting of N and K, whereby K stands for guanine or thymine, N for any possible base. Only in the mutated regions no distinct peaks are present. G: guanine, C: cytosine, A: adenine, T: thymine.]] |
In order to examine the property of the generated chemoreceptor J23100_TAR_QClibrary the transformation efficiency was determined. Due to the fact that the first liquid culture of TAR_QC library only revealed 10<sup>5</sup> clones (attempt a), a repeat of the 2<sup>nd</sup> round of the library (attempt b) was carried out to increase diversity and resulted in the same diversity. Isolated DNA of attempts a and b were merged to gain a final diversity of 2x10<sup>5</sup>, covering 6% of the theoretical diversity which would be 32<sup>5</sup> (Fig. 4 A). The comparison of the sequencing chromatograms between the original and the mutated sequence excerpts indicated high quality of the TAR_QC library, because only the expected mutation sites had been changed. Every sequence of the isolated liquid culture DNA, which was not targeted, remained the same (Fig. 4 B). | In order to examine the property of the generated chemoreceptor J23100_TAR_QClibrary the transformation efficiency was determined. Due to the fact that the first liquid culture of TAR_QC library only revealed 10<sup>5</sup> clones (attempt a), a repeat of the 2<sup>nd</sup> round of the library (attempt b) was carried out to increase diversity and resulted in the same diversity. Isolated DNA of attempts a and b were merged to gain a final diversity of 2x10<sup>5</sup>, covering 6% of the theoretical diversity which would be 32<sup>5</sup> (Fig. 4 A). The comparison of the sequencing chromatograms between the original and the mutated sequence excerpts indicated high quality of the TAR_QC library, because only the expected mutation sites had been changed. Every sequence of the isolated liquid culture DNA, which was not targeted, remained the same (Fig. 4 B). | ||
| Line 139: | Line 139: | ||
| - | [[File:Gruppe3 Figure04Sequencing diversity02.png|500px|thumb|right| <b>Figure 5: Sequence alignment reflecting the diversity of generated chemoreceptor Tar_QC library. </b> Nucleotide (left) and amino acid (right) sequence alignment of the mutated regions for the <sup>st</sup> round (top) with amino acids mutated at position 149, 150 and 154 and 2<sup>nd</sup> round (bottom) at 69 and 73. Sequencesare represented 5´ to 3´ with increasing numbers standing for the nucleotide or translated amino acid position in the indicated mutation regions, respectively. The consensus of 12 or 14 randomly picked clones sequenced for 1<sup>st</sup> and 2<sup>nd</sup> round is depicted as a pictogram. The height of each letter represents the frequency of each nucleotide at that position. Original sequences: 1<sup>st</sup> round tatttcGCTCAGCCAacc / YFAQPT; 2<sup>nd</sup> round cgtTCAGCGGTAcgg / RSAVR.G: guanine, C: cytosine, A: adenine, T: thymine.]] | + | [[File:Gruppe3 Figure04Sequencing diversity02.png|500px|thumb|right| <b>Figure 5: Sequence alignment reflecting the diversity of generated chemoreceptor Tar_QC library. </b> Nucleotide (left) and amino acid (right) sequence alignment of the mutated regions for the 1<sup>st</sup> round (top) with amino acids mutated at position 149, 150 and 154 and 2<sup>nd</sup> round (bottom) at 69 and 73. Sequencesare represented 5´ to 3´ with increasing numbers standing for the nucleotide or translated amino acid position in the indicated mutation regions, respectively. The consensus of 12 or 14 randomly picked clones sequenced for 1<sup>st</sup> and 2<sup>nd</sup> round is depicted as a pictogram. The height of each letter represents the frequency of each nucleotide at that position. Original sequences: 1<sup>st</sup> round tatttcGCTCAGCCAacc / YFAQPT; 2<sup>nd</sup> round cgtTCAGCGGTAcgg / RSAVR. G: guanine, C: cytosine, A: adenine, T: thymine.]] |
| Line 162: | Line 162: | ||
| - | To exclude the possibility of a biased towards specific amino acids within the library, clones of the transformation efficiency plates were picked randomly for sequencing. The nucleotide and corresponding amino acid | + | To exclude the possibility of a biased towards specific amino acids within the library, clones of the transformation efficiency plates were picked randomly for sequencing. The nucleotide and corresponding amino acid sequence are represented in Figure 5 A. No clones were picked twice and only two deletions/frameshifts were identified. On the basis of these data the sequencing alignment was done. Figure 5 B supports the good quality of the generated library showing the DNA sequence and amino acid diversity. The sequence alignment also reflects the well-targeted mutations as conserved nucleotides are resembled according to their letter size. As shown in Figure 3 D, the used mutation primers incorporated NNK at desired positions, whereby N stands for any possible nucleotide and K for guanine or thymine. All introduced nucleotides ‘N’ show at least three diverse nucleotides, whereas all introduced nucleotides ‘K’ showed the expected pattern. The diversity of the nucleotides is reflected in the translated amino acid sequence. |
To sum up, our J23100_TAR_QC library is unbiased, well targeted and of good quality. | To sum up, our J23100_TAR_QC library is unbiased, well targeted and of good quality. | ||
| + | |||
| + | |||
| + | |||
| + | |||
| + | |||
| + | |||
| + | |||
| + | |||
| + | |||
| + | |||
| + | |||
| + | |||
| + | |||
| + | |||
| + | |||
| Line 172: | Line 187: | ||
=== <b>Chapter III: Reading the Library</b> === | === <b>Chapter III: Reading the Library</b> === | ||
| - | Based on the knowledge of the well characterized J23100_TAR_QC library we assumed to have novel chemoreceptors. Due to the modification of the binding site these should be capable recognizing new chemical substances. Therefore, we performed library selection assays using seven different chemicals. We expected <i>E. coli</i> | + | Based on the knowledge of the well characterized J23100_TAR_QC library, we assumed to have constructed novel chemoreceptors. Due to the modification of the binding site these should be capable of recognizing new chemical substances. Therefore, we performed library selection assays using seven different chemicals. We expected <i>E. coli</i> to perform chemotaxis towards these chemicals as illustrated in Figure 6. |
| - | [[File:Gruppe3 Figure03.png|500px|thumb|right| <b>Figure 7: Novel chemoreceptors recognize different tested chemicals. </b> The designed Tar_QC library was transformed into BL21 cells and then tested on swimming agar plates with seven different interesting chemicals. After three rounds of selection of the fastest swimming <i>E. coli</i>s towards these, three clones per chemical were picked. Sequencing results identified two novel chemoreceptors that were found for different chemicals: the novel receptor with amino acid sequence | + | [[File:Gruppe3 Figure03.png|500px|thumb|right| <b>Figure 7: Novel chemoreceptors recognize different tested chemicals. </b> The designed Tar_QC library was transformed into BL21 cells and then tested on swimming agar plates with seven different interesting chemicals. After three rounds of selection of the fastest swimming <i>E. coli</i>s towards these, three clones per chemical were picked. Sequencing results identified two novel chemoreceptors that were found for different chemicals: the novel receptor with amino acid sequence <b>LT</b>AQP<b>D</b>…<b>S</b>SAV<b>P</b> (red boxes) was identified for swimming towards D-aspartate, 2-ethyl-hexanol and sodium cyclamate and the novel receptor with amino acid residues <b>PP</b>AQP<b>P</b>…<b>P</b>SAV<b>T</b> (orange boxes) was identified for swimming towards L-aspartate and caffeine. The green boxes show different identified receptors. The receptor colored in yellow are structural similar to the orange boxes.]] |
| - | D-aspartate and L-aspartic acid-4-benzyl ester were chosen because of their structural similarity to D- aspartate. Moreover,the | + | D-aspartate and L-aspartic acid-4-benzyl ester were chosen because of their structural similarity to D- aspartate. Moreover, the four flavors – vanillin, geraniol, caffeine and sodium cyclamate were interesting to test. The most interesting chemical is 2-ethyl-hexanol, a volatile organic compound related to lung cancer [2]. As mentioned above, the library selection assay was performed (Fig. Gr 1). After three rounds of selection of the fastest <i>E. coli</i> were sequenced. Figure 7 depicts novel identified chemoreceptors. A particular color code reflects the sequence identity and structure similarity. The novel receptor colored in red with amino acid sequence <b>LT</b>AQP<b>D</b>…<b>S</b>SAV<b>P</b> was identified two times for D-aspartate, 2-ethyl-hexanol and sodium cyclamate. Another novel receptor colored in orange with amino acid sequence <b>PP</b>AQP<b>P</b>…<b>P</b>SAV<b>T</b> was found two times for L-aspartic acid-4-benzyl ester and once for caffeine. However, for caffeine a structural related receptor mutant to the orange colored receptor was identified since the amino acids proline and serine are similar in structure. |
In conclusion the selection method worked although the selectivity was low. Nevertheless, we hold two novel chemoreceptors in our hands. | In conclusion the selection method worked although the selectivity was low. Nevertheless, we hold two novel chemoreceptors in our hands. | ||
| Line 190: | Line 205: | ||
<b>References</b> | <b>References</b> | ||
*[1]<a href=”http://chemotaxis.biology.utah.edu/Parkinson_Lab/publications/PDFs/Hazelbauer%20et%20al.,%202008.pdf”> ] Hazelbauer G.L., Falke J. J., and Parkinson J. S. 2008. <i>Bacterial chemoreceptors: high-performance signaling in networked arrays.</i> Trends Bichem Sci. 33(1): 9–19.</a> | *[1]<a href=”http://chemotaxis.biology.utah.edu/Parkinson_Lab/publications/PDFs/Hazelbauer%20et%20al.,%202008.pdf”> ] Hazelbauer G.L., Falke J. J., and Parkinson J. S. 2008. <i>Bacterial chemoreceptors: high-performance signaling in networked arrays.</i> Trends Bichem Sci. 33(1): 9–19.</a> | ||
| - | *[2]]<a href=”http://ar.iiarjournals.org/content/29/1/419.full.pdf+html”> ] Sporing A., Filipiak W., Mikoviny T., Ager C., Schubert J., Miekisch W., Amann A., | + | *[2]]<a href=”http://ar.iiarjournals.org/content/29/1/419.full.pdf+html”> ] Sporing A., Filipiak W., Mikoviny T., Ager C., Schubert J., Miekisch W., Amann A., and Troppmair J.. 2009. <i>Release of Volatile Organic Compounds from the Lung Cancer Cell Line NCI-H2087 In Vitro.</i> Anticancer Research 29: 419-426.</a> |
{{GoettingenFooter}} | {{GoettingenFooter}} | ||
Revision as of 17:41, 26 September 2012
 | |
Deutsch  / English / English  |
 |
Contents |
Homing coli: Engineering E. coli to become tracking dogs
The model organism Escherichia coli is naturally capable of sensing substances in its environment and consequently moves directionally towards these, a phenomenon known as chemotaxis. Here, we apply directed evolution to chemoreceptors by targeting five amino acid residues in the ligand binding site to enable E. coli to perceive novel substances. In order to investigate mobility and directed movement towards a substance, an effective mobility selection method using special "swimming plates" is designed. Additionally, we attempt to improve E. coli's swimming velocity by creating new parts derived from its own motility apparatus. Based on our selection system, we identify variants of chemoreceptors with new binding specificities in the mutant library. By these means, we aim to train the bacterium to detect new molecules such as tumor cell markers. Once having established E. coli as our "tracking dog", the possible applications in medicine but also to environmental issues are virtually countless.
#1 - Selection / Swimming
#2 - Speed Improvement
The goal of our group was to enhance the motility of E. coli in order to allow them to reach their targets more efficiently in later applications. This also results in a a faster selection of our Homing Coli and quick generation of results. The BioBricks we designed are therefore primarily directed at flagellum efficiency or number. We selected five different genes that were tested along our project in different strains. E. coli strain BL21 was used as our main object of research because this is a typical lab-strain and therefore usually not very motile. Our goal was to find a way to accelerate BL21 E. coli by transforming them with our constructs. Here is an overview of the genes we tested and the corresponding results.
motA and motB
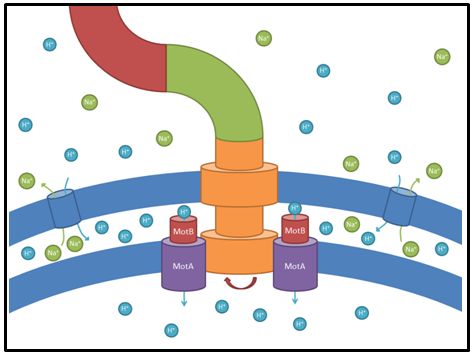
These genes code for proteins that build the stator part of the bacterial flagellum which generates torque by using a proton gradient that exists across the membrane (Fig. 5). Flagellum function depends on copy number of motA and motB (Van Way et al. 2000). Therefore we chose to test these genes, hoping that the number of stator protein copies might have a positive effect on motility (Reid et al. 2006). We first tested our strains with motA and motB constructs containing the natural 3’ and 5’ regions in puc18 because a strong overexpression might have counterproductive effects. High expressed motA might thereby lead to proton leakage and disturb the metabolism of E. coli.
- Results
- For these two stator-genes it was very hard to get reproducible data. However, after several rounds of testing on different swimming agars and conditions we were able to conclude that overexpression of motB often had a mild positive effect on motility of BL21 E. coli (Fig. 6). However, increased expression on motA seemed to have no or even a slightly negative effect.
- We did not see very strong effects after testing these two candidates. A possible explanation could be that the number of functional stator elements at one flagellum could not be increased anymore or might just not have a significant impact. Furthermore the expression of motA and motB is usually regulated in concert and if out of balance, their expression might not cause any positive effect for motility. For future projects it might be interesting to test chimeric stator proteins that could harbor higher efficiencies or use other ions for torque generation.
yhjH
This gene codes for a phosphodiesterase which reduces the levels of c-di-GMP that are involved in cell motility (Ko and Park, 2000). The protein YcgR is able to bind c-di-GMP and act as a flagellar brake which consequently reduces motility (Paul et al. 2010). The mechanism that we would like to exploit is illustrated in Figure 7. Overexpression of yhjH should therefore result in lower levels of c-di-GMP and increase E. coli's speed by diminishing the ability of YcgR to act as a brake on the flagellum. The second messenger c-di-GMP furthermore plays a role in the regulation of biofilm development. Expression of yhjH on the other hand represses biofilm formation (Suzuki et al. 2006) which could also serve our purposes and induce swimming motility.
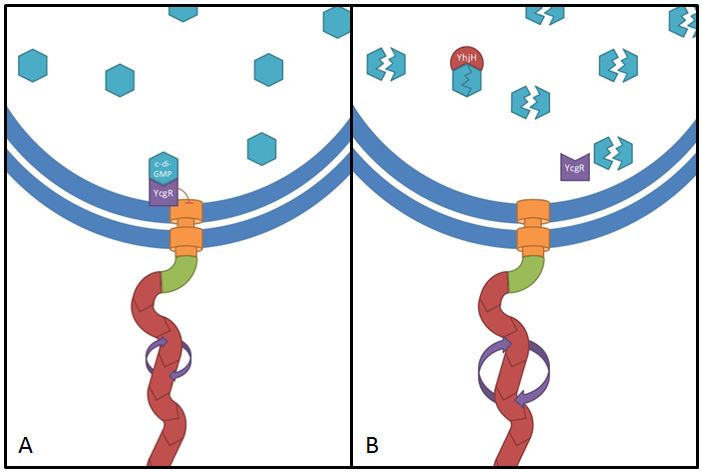 Fig. 7: The yhjH gene encodes for a c-di-GMP phosphodiesterase. The substrate, c-di-GMP, is a second messenger that binds to YcgR, a protein that functions as a flagellar brake and thus down-regulates the motor (A). We suggest that the overexpression of yhjH results in increased c-di-GMP degradation and hence in narrowed braking force. Due to a stronger rotation of the flagellum higher motility could be achieved (B). References: http://www.uniprot.org/uniprot/P37646; http://www.uniprot.org/uniprot/P76010 | 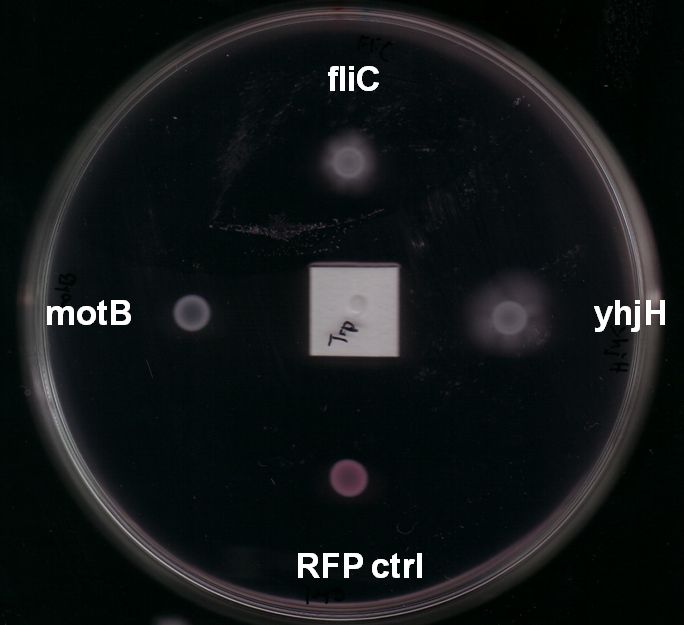 Fig. 8: BL21 E. coli carrying different constructs on Tryptone swimming agar after 12h incubation at 33°C. Cells expressing yhjH in puc18 under the natural promoter travelled approximately 0.5cm (radius) whereas no swimming could be detected for the control plasmid carrying [http://partsregistry.org/Part:BBa_K777125 K777125]. |
- Results:
- Expression of yhjH under its natural promoter in puc18 increased motility in almost all of our assays on LB or Tryptone swimming agar (Fig. 6 & Fig. 8). Not only were the yhjH expressing strains among the fastest on these swimming agar plates but also usually the first colonies to start swimming. This might be an indicator that indeed biofilm formation was inhibited and the E. coli were able to spread faster. Compared to our other tested constructs we got the most reliable results for yhjH. However the positive effect on motility was not present when we used M9 minimal medium swimming agar. Here, yhjH-transformed cells usually did not show a strong tendency for swimming. This result suggests that the motility-effects of YhjH are somehow nutrient-dependent and therefore depend on the used media.
fliC
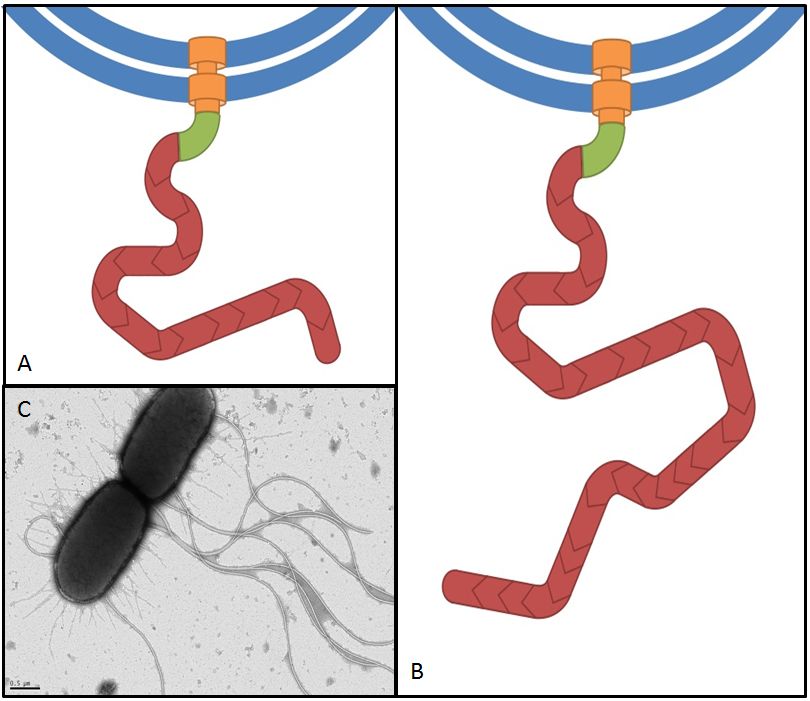
References:
http://ecocyc.org/ECOLI/NEW-IMAGE?type=POLYPEPTIDE&object=EG10321-MONOMER
Flagellin, the product of the fliC gene is the structural protein that builds up the filament of the bacterial flagellum (Fig. 9). By overexpressing fliC we hope to construct longer flagella which might have a positive impact on swimming speed (Furuo et al. 1997). At the same time we were aware that overlong flagella might cause adverse effects due to an obstructive architecture.
- The fliC gene was amplified from DH10B E. coli genomic DNA and contained four forbidden restriction sites. We had to mutate all these sites via overlap PCR. A description for this method can be found here.
- Results
- Our overlap PCR for the mutation of three PstI and one SpeI sites worked efficiently and fast. The resulting PCR product was not cut by any BioBrick standard 10 enzymes.
- In order to avoid too strong levels of expression we included 1kb of the upstream region for most of the assays to allow a certain level of regulation in the cells. Like yhjH-transformants these strains showed increased motility in almost all of our assays (Fig. 8). On the minimal medium M9 agar plates they were usually significantly faster and showed swimming motility earlier than any other cells. On Tryptone swimming agar they were in general the runner up behind yhjH-transformed E. coli. Unfortunately, we had trouble cloning our fliC constructs into pSB1C3 because of a problem in our reverse primer suffix. When we had located the source of the problem it was too late to send this part to the Registry in time.
flhDC
References:
[1] Wei et al. (2001) Positive regulation of motility and flhDC expression by the RNA-binding protein CsrA of Escherichia coli. Molecular Microbiology, 40(1):245-256
[2] Gauger et al. (2007) Role of motility and the flhDC operon in Escherichia coli MG1655 colonization of the mouse intestine. Infect immune 75(7):3315-3324
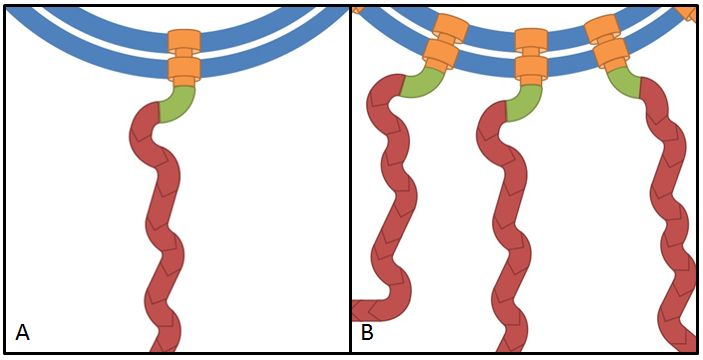
The flhDC operon is the master regulator of motility and chemotaxis in E. coli. This means that it is the main control instance for flagellar synthesis and starts the complex process of flagellar gene synthesis and flagellum assembly (Chevance and Hughes 2008). The flhDC operon codes for the transcriptional regulator FlhD4C2 which forms heterotetramers and activates class II operons in concert with sigma factor 70. Among the gene products of class II operons are several components of the flagellum and the alternative sigma factor FliA which is essential for the transcription of class III genes. It has been shown that increased expression of flhDC also enhances motility in E. coli (Ling et al. 2010). We wanted to see how different levels of flhDC expression affect the speed of our E. coli lab-strains. In theory, the number of assembled flagellums should increase (Fig. 10) and thereby have a positive impact on motility.
- Results
- Our plan was to express flhDC constitutively with a selection of 8 different Anderson-promoters to achieve different levels of transcription. And indeed BL21 E. coli transformed with these constructs showed a higher motility than empty vector controls or WT cells. However, our results were very inconsistent, especially concerning the different promoter strengths when compared to each other. The troubleshooting revealed that we were missing a RBS between the promoters and the ATG within all our constructs. This probably explains the inconsistent results that did not allow us to quantify the effect of our constructs. We hope to finish these experiments with correct constructs soon because we are eager for presentable results!
Electron microscopy
Overexpression of flagellar genes like fliC or the flhDC operon should result in alterations of the flagellum structure or number, which can be visualized. In the case of fliC, which encodes flagellin, the building block of the flagellum, we expect the emergence of longer filaments. In contrast to this, flhDC as the master regulator is thought to increase the number of flagella when overexpressed, since all genes involved in flagellum assembly should be up-regulated.
In order to visualize these alterations we investigated the E. coli strain BL21, transformed with fliC or flhDC constructs, by using transmission electron microscopy. Both genes were under control of a strong constitutive promoter promoter (J23100). As reference strains we used BL21 cells carrying the same vector with an RFP insert. Furthermore the MG1655 strain, as a more motile strain with non-degenerated flagella, was used.
- Results
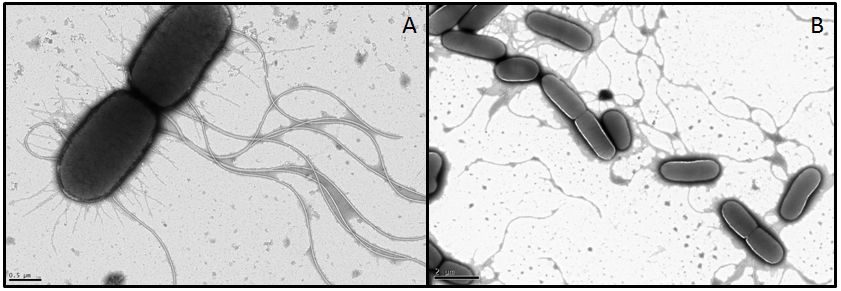
- For MG1655 nice pictures were obtained since the strain grew very fast and seems to be quite robust (Fig. 11). However, we were not able to obtain meaningful pictures showing flagella of the BL21 strain. Under stress conditions bacteria tend to lose their flagella very easily (Blum, 1971). Apparently the transport form our Lab to the EM-facility was enough to stress the BL21 E. coli. It appears that this demands quite something for MG1655 however, or the pictures we got from this strain were already in a stressed state and the flagella are usually even longer or more in number. We had a look at the different strains with a light microscope in our lab before the EM sessions and they were all motile. This consideration, that the cells were stressed during the transport was supported by their subsequent investigation under a light microscope. The cells were not motile anymore and featured very heterogeneous shapes whereby some formed very long rods. All these appearances are indications for stressed cells. Another problem with BL21 was the very low growth rate, since a high optical density is required in order to obtain an adequate number of cells during preparation. Therefore we had to centrifuge the cultures in some cases which ended up in interwoven filaments (Fig. 11).
- In conclusion, we were not able to get informative data about the flagellar structures and morphologies, but we found out, that BL21 is very sensitive and drops its flagella in no time.
- For MG1655 nice pictures were obtained since the strain grew very fast and seems to be quite robust (Fig. 11). However, we were not able to obtain meaningful pictures showing flagella of the BL21 strain. Under stress conditions bacteria tend to lose their flagella very easily (Blum, 1971). Apparently the transport form our Lab to the EM-facility was enough to stress the BL21 E. coli. It appears that this demands quite something for MG1655 however, or the pictures we got from this strain were already in a stressed state and the flagella are usually even longer or more in number. We had a look at the different strains with a light microscope in our lab before the EM sessions and they were all motile. This consideration, that the cells were stressed during the transport was supported by their subsequent investigation under a light microscope. The cells were not motile anymore and featured very heterogeneous shapes whereby some formed very long rods. All these appearances are indications for stressed cells. Another problem with BL21 was the very low growth rate, since a high optical density is required in order to obtain an adequate number of cells during preparation. Therefore we had to centrifuge the cultures in some cases which ended up in interwoven filaments (Fig. 11).
References
- Blum J.J.(1971) Existence of a breaking point in cilia and flagella. J. Theor. Biol. 33:257–263.
- Chevance F. F., Hughes K. T. 2008. Coordinating assembly of a bacterial macromolecular machine. Nat Rev Microbiol. 6: 455–465.
- Furuno, M., T. Atsumi, T. Yamada, S. Kojima, N. Nishioka, I. Kawagishi, and M. Homma. 1997. Characterization of polar-flagellar-length mutants in Vibrio alginolyticus. Microbiology. 66: 3632–3636.
- Ko M., Park C. 2000. Two novel flagellar components and H-NS are involved in the motor function of Escherichia coli. J. Mol. Biol. 303: 371-382.
- Ling H., Kang A., Tan M.H., Qi X., Chang M.W. 2010. The absence of the luxS gene Increases swimming motility and flagella synthesis in Escherichia coli K12. Biochem Biophys Res Commun. 401: 521-526.
- Paul, K., Nieto, V., Carlquist, W.C., Blair, D.F., Harshey, R.M. The c-di-GMP Binding Protein YcgR Controls Flagellar Motor Direction and Speed to Affect Chemotaxis by a “Backstop Brake” Mechanism. 2012. Mol Cell. 38: 128–139.
- Reid, S. W., M. C. Leake, J. H. Chandler, C. J. Lo, J. P. Armitage, and R. M. Berry. 2006. The maximum number of torque-generating units in the flagellar motor of Escherichia coli is at least 11. Proc. Natl. Acad. Sci. USA 103: 8066-8071.
- Suzuki, K., Babitzke, P., Kushner, S. R., Romeo, T. 2006. Identification of a novel regulatory protein (CsrD) that targets the global regulatory RNAs CsrB and CsrC for degradation by RNase E. Genes Dev. 20: 2605–2617.
- Van Way, S. M., E. R. Hosking, T. F. Braun, and M. D. Manson. 2000. Mot protein assembly into the bacterial flagellum: a model based on mutational analysis of the motB gene. J. Mol. Biol. 297: 7-24.
#3 - Chemoreceptor Library
Prologue
The objective of the “Legendary TAR librarians” was the generation of a mutant library of the chemoreceptor Tar (Taxis to Aspartate and Repellants). Tar is one of five membrane-bound chemoreceptors of E. coli in order to execute chemotaxis. The X-ray structure has been elucidated and is well characterized (see [http://www.rcsb.org/pdb/explore/explore.do?structureId=1wat1 PDB file]). Residues of the Tar ligand-binding domain that interact with L-aspartate were identified via X-ray crystallography. It is a functional homodimer and its natural ligand is L-aspartate [1]. Here, we aimed to identify novel receptors by applying directed evolution to Tar chemoreceptors. To enable E. coli to perceive novel substances five amino acid residues in the ligand binding site were the target. Our method of choice is targeted saturation mutagenesis. In comparison to random mutagenesis, this has the advantage to specifically mutate the selected amino acid residues.
Chapter I: Finding the Library
The amplification of Tar was carried out directly from the E. coli K12 genome. We introduced the BioBrick standard restriction sites by primer design (see sequencing primers; Tar for + prefix & Tar rev + suffix). The amplified BioBrick part was then inserted into the vector pUC18. To get rid of BioBrick standard restriction sites in tar, a QuikChange reaction was applied. The XbaI site (nt 420-425) was exchanged from TCTAGt to CCTAGt while keeping the codon for the same amino acid. Our next step was to express the quikchanged tar (TAR_QC) under the constitutive [http://partsregistry.org/wiki/index.php?title=Part:BBa_K777001 Anderson promoters].

With these various promoter constructs in hand, a swimming assay was performed testing promoter activity. This experiment revealed promoter J23100_TAR_QC in pUC18 background having the best swimming abilities (data not shown). To generate a chemoreceptor library our method of choice requires the absence of the BsaI restriction site in both, the insert and the vector backbone, of the cloned plasmid. Since pUC18 contains a BsaI restriction site in the plasmid backbone within the selection marker bla gene, this vector is not appropriate for targeted saturation mutagenesis. Thus, the construct was cloned in the BioBrick vector pSB1C3. There are two advantages coming along: Firstly, we need to send our designed BioBricks in this particular vector this year and secondly, this vector contains a chloramphenicol resistance gene and hence it is lacking the undesired BsaI site.
The promoter constructs in the new vector backbone were tested in chemotaxis assays for swimming towards L-aspartate (Fig. 1). Thereby, all eight tested promoter constructs were dropped around in the same distance to an octahedron Whatman paper soaked with L-aspartate. As a control serves the strain BL21 transformed with Tar_QC under the control of the eight promoters. ∆Tar was complemented with Tar_QC. As expected, the strongest promoters (18C = K777001, 18K = K777002) show the strongest movement. It was not possible to evaluate 18O (K777004). All in all, the complementation worked, but not to the expected extend.
Further proof came from a SDS-PAGE showing protein expression levels using the three strongest Anderson promoters. The results were consistent with the previous swimming study (data not shown). After election of the “winner” in this discipline it was chosen to be most suitable for our purposes.
Additionally, our goal was to see a correlation between the mRNA expression levels and the motility of our engineered E. coli on swimming plates. Therefore, we used quantitative real-time PCR (qrtPCR) as a powerful tool for quantification of gene expression. We used this method to examine the expression rate of the eight different constitutive promoter constructs from the parts registry that were further confirmed by swimming assays. The reported activities of these promoters are given as the relative fluorescence of these plasmids in strain TG1 (parts registry: [http://partsregistry.org/Part:BBa_J23100 Part:BBa_J23100]). The results are depicted in Figure 2. Here, promoter constructs were cloned into the vector pSB1C3 and expressed in E.coli BL21DE3 grown in LB-media (lysogeny broth). The measurements were performed as a triplet for each construct and a house-keeping gene coding for a 16SrRNA (rrsD) as reference. Additionally, we included H2O as negative no template control to predict possible contaminations. For the evaluation of our results, the 2–ΔΔCT (Livak) method was applied. We used the weakest promoter with the lowest expression rate as calibration for the calculations and as reference the housekeeping gene. The data was then compared to the predetermined expression rates from iGEM2006_Berkeley group.
Overall, as shown in Figure 2, each tested promoter construct indicated differences in expression rates in comparison to values from the parts registry. In fact, both data-sets were collected by methods which produce data at different points after gene expression. A common trend was detected for the strongest promoters J23100, J23104, J23105 and J23109 together with the weakest promoters J23112 and J23113. Conspicuously, the promoter J23109 revealed for qrtPCRand for relative fluorescence measurements nearly the same expression rates. The expression rates of J23114 and J23106 indicated massive differences in their expression rates and no common trend with the expression values from the parts registry. We detected comparable positioning in the ranking of expression rates (see characterization of constitutive promoters by qrtPCR) for six out of our eight promoters. The promoters characterized as relatively strong were also, in our case, responsible for higher expression rates and the other way around. In the case of promoter J23114 and J23106, the data-sets exhibited a completely different characterization compared to those in the parts registry.
All in all, these results confirm the properties of J23100 as the best swimmer.
Chapter II: Designing the Library
The introduction of targeted saturation mutations requires mutant primer design (primer mutagenesis). We divided our library generation into two rounds, each mutating different residues (Fig. 3 A). Amino acids 149, 150 and 154 were mutated in the first (1st), amino acids 69 and 73 in the second round (2nd). Each library generation consists of the following steps: 1. primer design, 2. saturated mutagenesis PCR, 3. DpnI/BsaI restriction, 4. ligation, transformation and plasmid isolation, 5. PCR for 2nd round; the template for 2nd round being the isolated mutated plasmids of the 1st. After 2nd round, the plasmid library is completed. Figure 3 B shows gels from the 2nd round of mutagenesis. The gels of step 2 (PCR), step 3 (digest) and step 4 (ligation) show a band of the expected size at 3769 bp, indicating that the intermediate steps were successful. The primers we used for the mutagenesis PCR randomly mutate five amino acids residues at positions 69, 73, 149, 150 and 154, which are known to bind to L-Aspartate (Fig. 3 C). The outcome of the mutations is depicted in Figure 3 D.
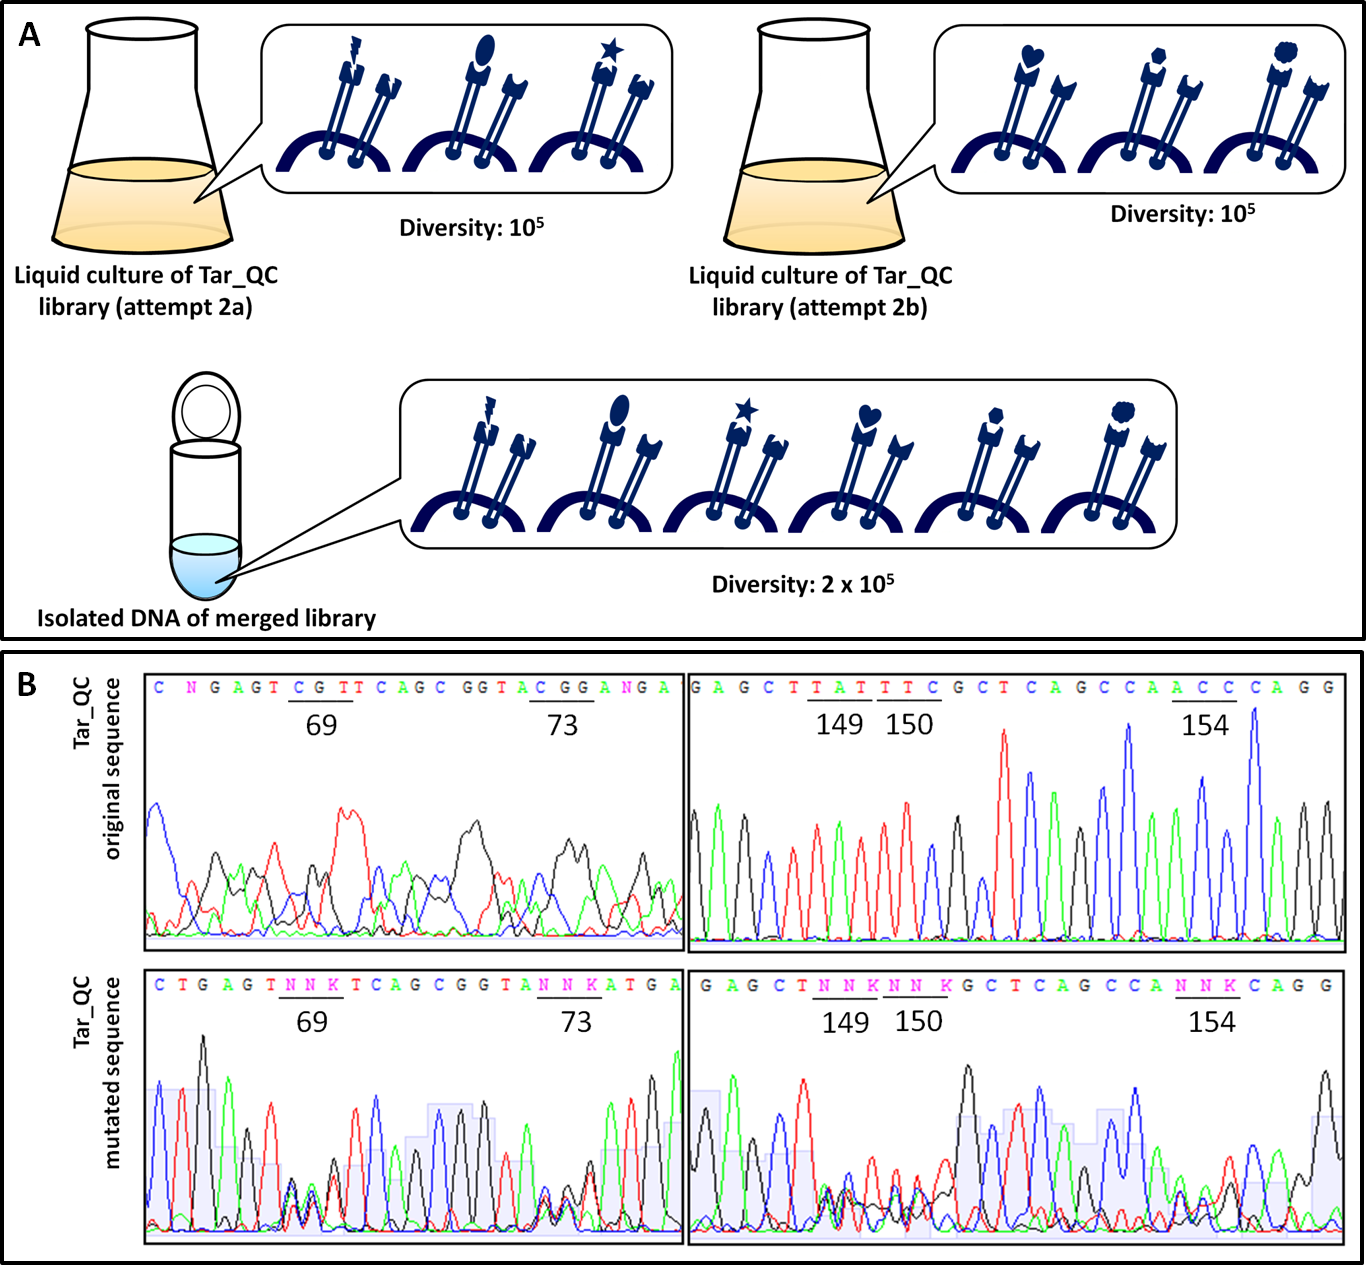
In order to examine the property of the generated chemoreceptor J23100_TAR_QClibrary the transformation efficiency was determined. Due to the fact that the first liquid culture of TAR_QC library only revealed 105 clones (attempt a), a repeat of the 2nd round of the library (attempt b) was carried out to increase diversity and resulted in the same diversity. Isolated DNA of attempts a and b were merged to gain a final diversity of 2x10⁵, covering 6% of the theoretical diversity which would be 325 (Fig. 4 A). The comparison of the sequencing chromatograms between the original and the mutated sequence excerpts indicated high quality of the TAR_QC library, because only the expected mutation sites had been changed. Every sequence of the isolated liquid culture DNA, which was not targeted, remained the same (Fig. 4 B).
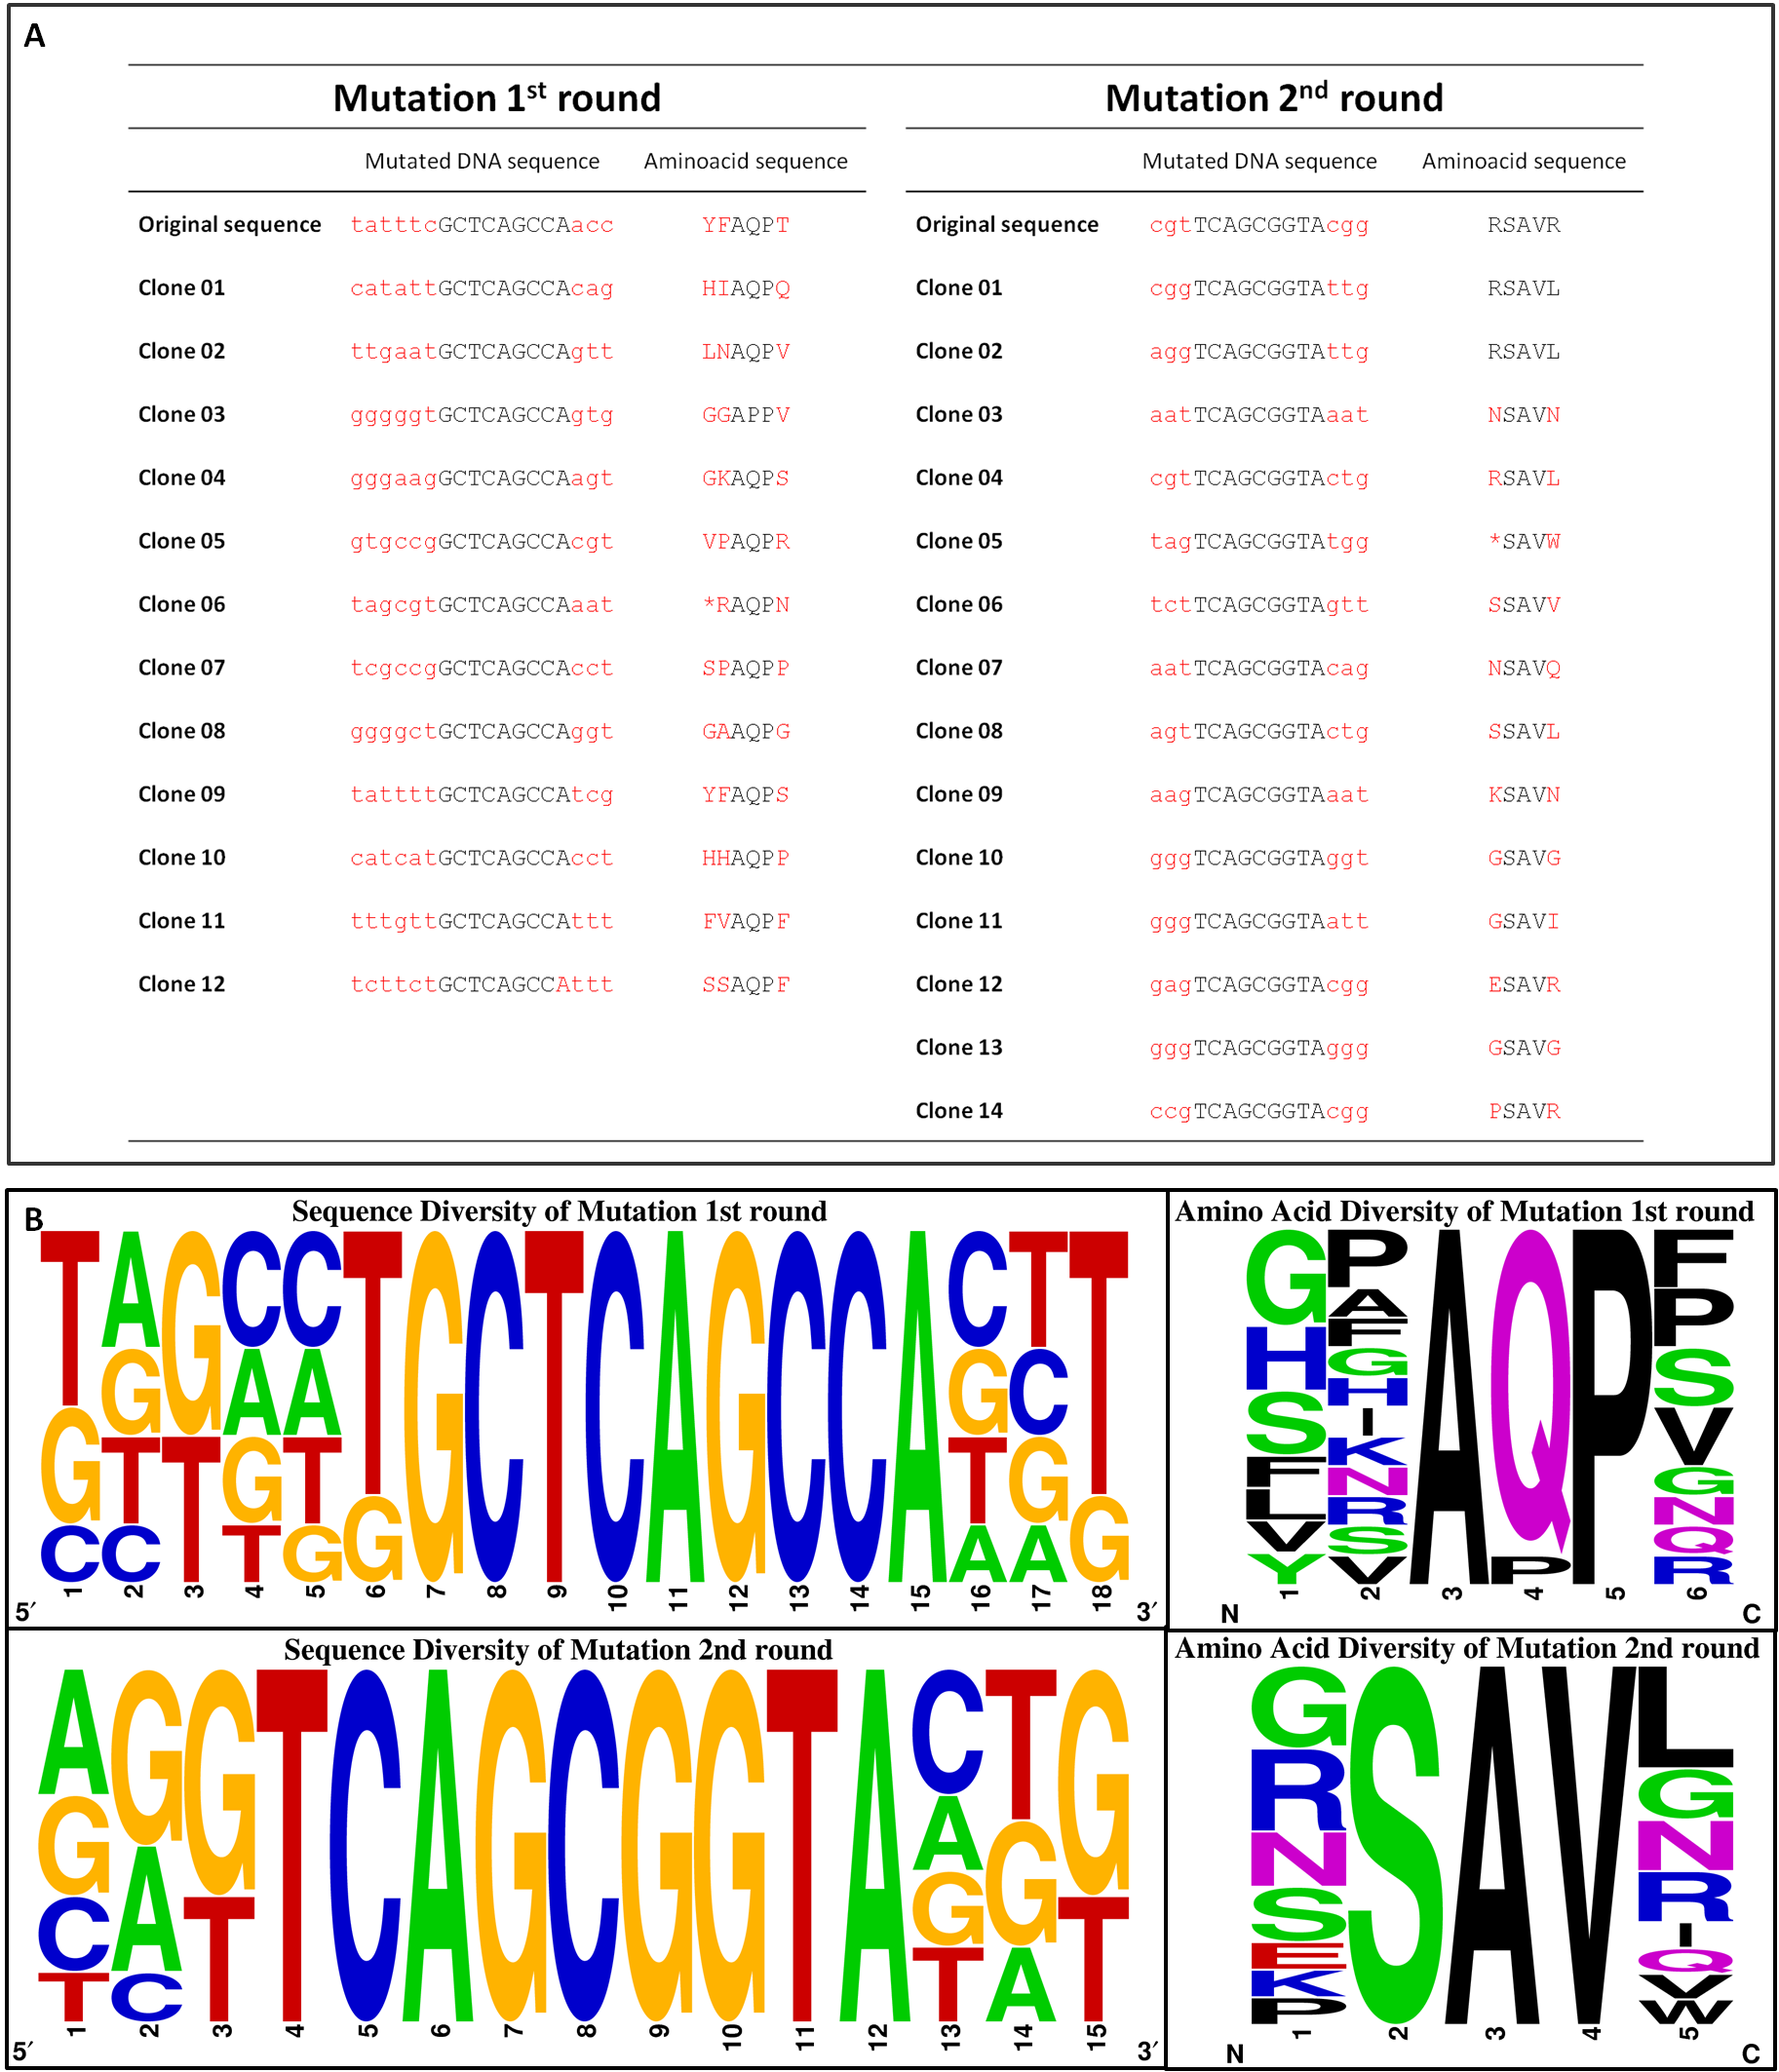
To exclude the possibility of a biased towards specific amino acids within the library, clones of the transformation efficiency plates were picked randomly for sequencing. The nucleotide and corresponding amino acid sequence are represented in Figure 5 A. No clones were picked twice and only two deletions/frameshifts were identified. On the basis of these data the sequencing alignment was done. Figure 5 B supports the good quality of the generated library showing the DNA sequence and amino acid diversity. The sequence alignment also reflects the well-targeted mutations as conserved nucleotides are resembled according to their letter size. As shown in Figure 3 D, the used mutation primers incorporated NNK at desired positions, whereby N stands for any possible nucleotide and K for guanine or thymine. All introduced nucleotides ‘N’ show at least three diverse nucleotides, whereas all introduced nucleotides ‘K’ showed the expected pattern. The diversity of the nucleotides is reflected in the translated amino acid sequence.
To sum up, our J23100_TAR_QC library is unbiased, well targeted and of good quality.
Chapter III: Reading the Library
Based on the knowledge of the well characterized J23100_TAR_QC library, we assumed to have constructed novel chemoreceptors. Due to the modification of the binding site these should be capable of recognizing new chemical substances. Therefore, we performed library selection assays using seven different chemicals. We expected E. coli to perform chemotaxis towards these chemicals as illustrated in Figure 6.
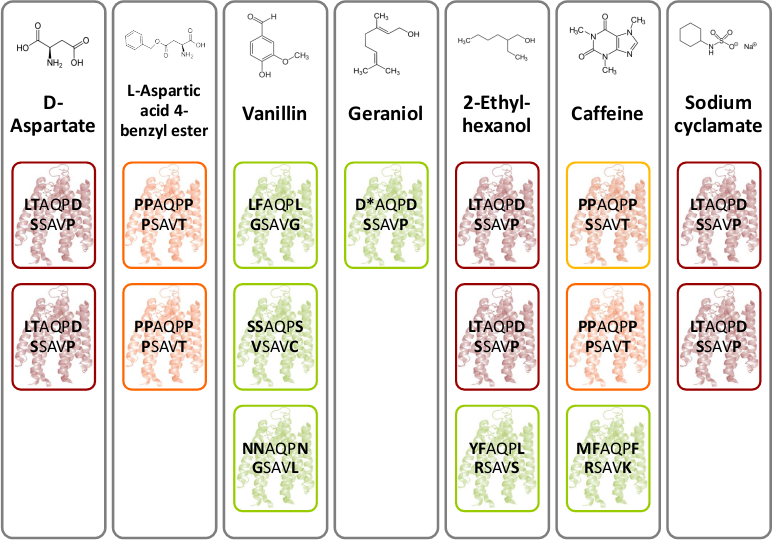
D-aspartate and L-aspartic acid-4-benzyl ester were chosen because of their structural similarity to D- aspartate. Moreover, the four flavors – vanillin, geraniol, caffeine and sodium cyclamate were interesting to test. The most interesting chemical is 2-ethyl-hexanol, a volatile organic compound related to lung cancer [2]. As mentioned above, the library selection assay was performed (Fig. Gr 1). After three rounds of selection of the fastest E. coli were sequenced. Figure 7 depicts novel identified chemoreceptors. A particular color code reflects the sequence identity and structure similarity. The novel receptor colored in red with amino acid sequence LTAQPD…SSAVP was identified two times for D-aspartate, 2-ethyl-hexanol and sodium cyclamate. Another novel receptor colored in orange with amino acid sequence PPAQPP…PSAVT was found two times for L-aspartic acid-4-benzyl ester and once for caffeine. However, for caffeine a structural related receptor mutant to the orange colored receptor was identified since the amino acids proline and serine are similar in structure.
In conclusion the selection method worked although the selectivity was low. Nevertheless, we hold two novel chemoreceptors in our hands. All these experiments provide evidence for the functionality of the BioBrick K777001.
References
- [1]<a href=”http://chemotaxis.biology.utah.edu/Parkinson_Lab/publications/PDFs/Hazelbauer%20et%20al.,%202008.pdf”> ] Hazelbauer G.L., Falke J. J., and Parkinson J. S. 2008. Bacterial chemoreceptors: high-performance signaling in networked arrays. Trends Bichem Sci. 33(1): 9–19.</a>
- [2]]<a href=”http://ar.iiarjournals.org/content/29/1/419.full.pdf+html”> ] Sporing A., Filipiak W., Mikoviny T., Ager C., Schubert J., Miekisch W., Amann A., and Troppmair J.. 2009. Release of Volatile Organic Compounds from the Lung Cancer Cell Line NCI-H2087 In Vitro. Anticancer Research 29: 419-426.</a>
| ↑ Back to top! |

|
 "
"
