Team:Groningen/Notebook/Modeling 24July2012
From 2012.igem.org
(Difference between revisions)
m |
m |
||
| Line 10: | Line 10: | ||
margin-top:0px; | margin-top:0px; | ||
margin-bottom:20px; | margin-bottom:20px; | ||
| - | margin-left: | + | margin-left:150px; |
| - | margin-right: | + | margin-right:250px; |
} | } | ||
</style> | </style> | ||
| Line 17: | Line 17: | ||
<body> | <body> | ||
| + | <br> | ||
| + | <br> | ||
| + | <br> | ||
<p class="margin"> | <p class="margin"> | ||
| - | Tom ran multiple experiments to observe the effect of temperature on generation time on SMM. Based on his data, the following relationship is given for starting OD between 0.103 and 0.106. When the starting OD was greater than 0.3, there was no doubling. The biomass hit a limit. As such, a curve cannot be created as there are more factors at play at that starting OD. | + | Tom ran multiple experiments to observe the effect of temperature on generation time on SMM. |
| + | Based on his data, the following relationship is given for starting OD between 0.103 and 0.106. | ||
| + | When the starting OD was greater than 0.3, there was no doubling. The biomass hit a limit. As such, | ||
| + | a curve cannot be created as there are more factors at play at that starting OD. | ||
<br> | <br> | ||
<A HREF="https://2012.igem.org/Team:Groningen/Notebook"><FONT COLOR=#ff6700>Back to notebook</FONT></A> | <A HREF="https://2012.igem.org/Team:Groningen/Notebook"><FONT COLOR=#ff6700>Back to notebook</FONT></A> | ||
Latest revision as of 14:49, 26 September 2012


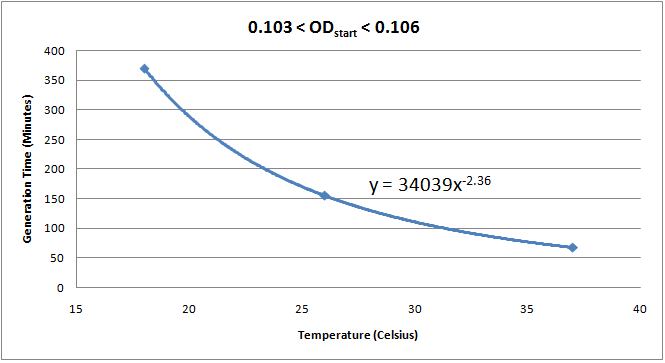
Tom ran multiple experiments to observe the effect of temperature on generation time on SMM.
Based on his data, the following relationship is given for starting OD between 0.103 and 0.106.
When the starting OD was greater than 0.3, there was no doubling. The biomass hit a limit. As such,
a curve cannot be created as there are more factors at play at that starting OD.
Back to notebook
 "
"


