Team:TU-Delft/Snifferometer
From 2012.igem.org
(→Test) |
|||
| Line 48: | Line 48: | ||
= Test = | = Test = | ||
| - | + | Since the fluorescence signal emitted from yeast is not very strong to reach the sensitivity of our prototype, the E-coli with TagGFP2 overexpression is then used to test the feasibility of our device. TagGFP2 has 483nm and 506nm for its excitement and emission peak wavelength which is similar with EGFP. | |
| - | 483nm and 506nm | + | |
| - | + | Eppendorf tubes are used to contain the liquid. The Control sets are M9 medium with E-coli, while the Test sets are M9 medium with E-coli overexpressing TagGFP2. M9 medium is used because it has low autofluorescence. | |
| - | + | ||
| - | + | ||
| - | + | ||
| - | + | ||
| - | + | ||
| - | + | ||
| - | M9 medium is used because it has low autofluorescence. | + | |
[[File:Data Sniff.png|580px|Right|thumb|'''Figure 4''': Measured data]] | [[File:Data Sniff.png|580px|Right|thumb|'''Figure 4''': Measured data]] | ||
Revision as of 15:19, 26 October 2012

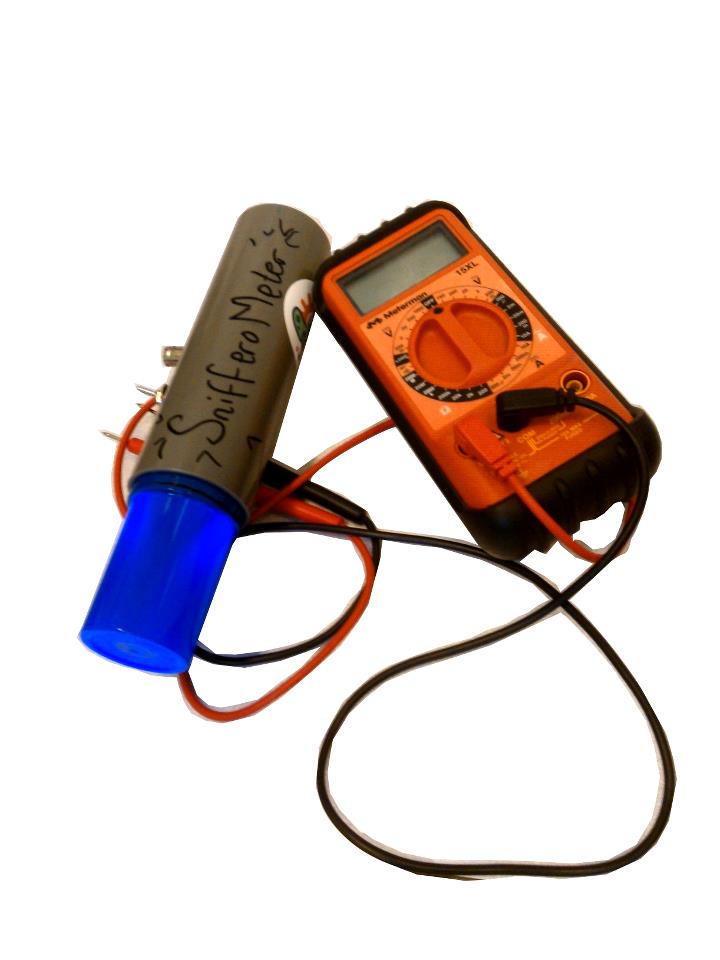
In order to assess the feasibility using our Snifferomyces cells as a diagnosis method, a device called "Snifferometer" was built to measure the status of fluorescence. The purpose of building such a device is to overcome the complexity, incalculability, and the high cost of using fluorescence microscope.
Contents |
Construction of Snifferometer
Scheme of the Device
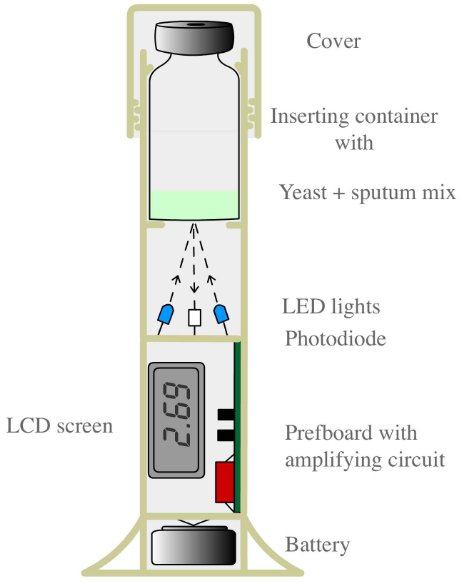
Figure 1 shows the concept of how the device works. The LEDs emit blue light on the liquid mixing Snifferomyces and sputum of the patient. Later, the photodiode collects the glowing light and transfers it into an amplified signal of voltage. Thus, by reading the number of voltmeter, the status of TB smelling cells in sputum can be detected.
Circuit of Snifferometer
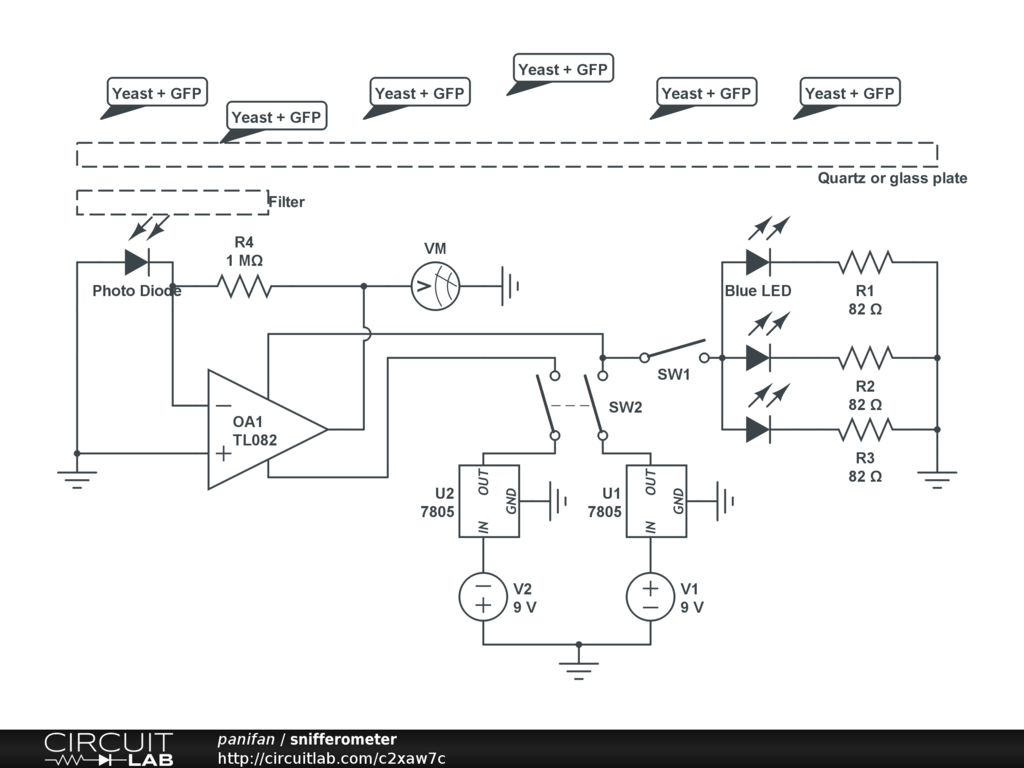
The photodiode converts the light intensity into small current, and op amp is needed to amplify the small current signal.
Wavelength
By looking up in the Table of Fluorochrome, the peak excitement and emission wavelengthes of EGFP are known, which are 488nm and 507nm respectively.
Blue LEDs are chosen with the dominant wavelength of 470nm.
And the responsibility spectrum of photodiode can be seen here.
Thus a high-pass filter is needed which has a cutoff frequency around 500nm. Two filters were tested to give a comparison:
Test
Since the fluorescence signal emitted from yeast is not very strong to reach the sensitivity of our prototype, the E-coli with TagGFP2 overexpression is then used to test the feasibility of our device. TagGFP2 has 483nm and 506nm for its excitement and emission peak wavelength which is similar with EGFP.
Eppendorf tubes are used to contain the liquid. The Control sets are M9 medium with E-coli, while the Test sets are M9 medium with E-coli overexpressing TagGFP2. M9 medium is used because it has low autofluorescence.
- reduce background light intensity: right filter
- increase green light intensity
- increase the sensitivity of the circuit
- enlarge the area of fluorescent

 "
"


