 "
"
Team:TU-Delft/Analysis
From 2012.igem.org
(→Purpose of sensitivity analysis) |
(→Purpose of sensitivity analysis) |
||
| Line 48: | Line 48: | ||
Sensitivity analysis is to study how system variables depend on model parameters such as kinetic parameters and initial concentrations of components. | Sensitivity analysis is to study how system variables depend on model parameters such as kinetic parameters and initial concentrations of components. | ||
<ul> | <ul> | ||
| - | <li>Validation of model with respect to uncertainty. When there is limited or no data for a conceptual model, one venue for model validation is to test the sensitivity of a given parameter fit. Thus, a model that is touted for its qualitative behaviour without quantitative behaviour can show that these properties are conserved when there is perturbation to the presented model.</li> | + | <li>[[Validation of model with respect to uncertainty]]. When there is limited or no data for a conceptual model, one venue for model validation is to test the sensitivity of a given parameter fit. Thus, a model that is touted for its qualitative behaviour without quantitative behaviour can show that these properties are conserved when there is perturbation to the presented model.</li> |
<li>Better choice for parameter estimation. In the presence of a small data set and many parameters, responses will not change equally to similar changes in parameters: some are sensitive and some are not. The parameter space we wish to fit can be reduced by examining which parameters are sensitive and which are not.</li> | <li>Better choice for parameter estimation. In the presence of a small data set and many parameters, responses will not change equally to similar changes in parameters: some are sensitive and some are not. The parameter space we wish to fit can be reduced by examining which parameters are sensitive and which are not.</li> | ||
</ul> | </ul> | ||
Revision as of 12:31, 22 September 2012


Contents |
Stability analysis
In figure 3.1, we can see the receptor activation is the prerequisite to activate the whole pathway. The stability of the whole pathway is decided by the state of receptor. The full structure of receptor is showed in Figure 1. However, before parameter estimation by using experimental data, because both values of rates to synthesize and to degrade the receptor are unknown, there are two possibilities for the evolution of receptor: dissipation or constant.

In the case of dissapating Ste2
If the rate of receptor degradation is larger than the rate of receptor generation, the structure of receptor can be functionally simplified as Figure 2. The receptor will dissipate towards zero in the end. As a consequence, the states in the following pathway will recover to the initial states based on mass balance. Thus, GFP will definitely degrade to zero asymptotically.

In this sense, there is only one steady state and no bifurcation, and the system seems to be stable. The steady states are listed in Table 1.

In order to test the stability around the steady states, the linearization method is used for this nonlinear system.
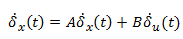
By computation, the eigenvalues of full Jacobian A contain both zeros and the values with negative real-part, leading to undertermined conclusion for the stability of original nonlinear system. However, because of mass balance, there are some conserved values which can be reduced. They are linear combinations of particle numbers that do not vary during the time evolution of the system. Each conservation relation can be used to eliminate one variable of the system, leading to a reduced system with a smaller number of variables. These variables are called the independent variables of the system; the dependent variables are defined as linear combinations of independent variables.Technically finding the conservation relation means finding rows in the stoichiometry matrix that can be expressed as linear combinations of other rows. [1]

By using COPASI which uses Householder QR factorization [2] to reduce model, the Jacobian of reduced model can be calculated and its eigenvalues are showed in Table 2. 6 out of total 17 species are conserved values including Sst2a (Sst2), Fus3a (Fus3), Ste12 (Ste12a), and GaGTP, C, D in the big cycle of combining G-protein and MAPK cascade.
In the case of accumulating or constant Ste2

If the rate of receptor degradation is smaller than the rate of receptor generation, the receptor will accumulate till reaching the possible maximum value. The pathway will keep activating once activated, and GFP will accumulate without limit, so the system is unstable.
Sensitivity analysis
Values can be tuned: initial concentration of Ste2, Vht2hd, VGa2ht, VGFPmRNAsyn
Purpose of sensitivity analysis
Sensitivity analysis is to study how system variables depend on model parameters such as kinetic parameters and initial concentrations of components.
- Validation of model with respect to uncertainty. When there is limited or no data for a conceptual model, one venue for model validation is to test the sensitivity of a given parameter fit. Thus, a model that is touted for its qualitative behaviour without quantitative behaviour can show that these properties are conserved when there is perturbation to the presented model.
- Better choice for parameter estimation. In the presence of a small data set and many parameters, responses will not change equally to similar changes in parameters: some are sensitive and some are not. The parameter space we wish to fit can be reduced by examining which parameters are sensitive and which are not.
Time-dependant sensitivity analysis
References
1. COPASI Documentation, Version 4.6 (Build 32)
2. R. R. Vallabhajosyula, V. Chickarmane, and H. M. Sauro. Conservation analysis of large biochemical networks. Bioinformatics. 22(3). 346 - 353. 2006