"
"
Team:NTU-Taida/Modeling/System-Analysis
From 2012.igem.org
| Line 5: | Line 5: | ||
==Parameter Sweeping== | ==Parameter Sweeping== | ||
Our system analysis model is an extension of our single cell model. In order to perform the parameter sweeping, we replace the constant values of parameters with a range of values. For simplicity, we focus only on the steady state of our circuit. The steady states of each species are derived using Maple, and are then ported to Matlab for simulation. The input of our system, the fatty acid, is also included as our sweeping parameters in each sweep, enabling us to observe the threshold of the filter in our circuit. The combined input and parameter sweeping gives us a 3-dimensional graph, with x-axis, y-axis and z-axis being the parameter under analysis, the input fatty acid concentration and the output GLP1 concentration, respectively. | Our system analysis model is an extension of our single cell model. In order to perform the parameter sweeping, we replace the constant values of parameters with a range of values. For simplicity, we focus only on the steady state of our circuit. The steady states of each species are derived using Maple, and are then ported to Matlab for simulation. The input of our system, the fatty acid, is also included as our sweeping parameters in each sweep, enabling us to observe the threshold of the filter in our circuit. The combined input and parameter sweeping gives us a 3-dimensional graph, with x-axis, y-axis and z-axis being the parameter under analysis, the input fatty acid concentration and the output GLP1 concentration, respectively. | ||
| - | [[File:Team-NTU-Taida-Sys01.png|450px | + | [[File:Team-NTU-Taida-Sys01.png|450px|center]] |
==Results== | ==Results== | ||
| Line 12: | Line 12: | ||
===System Robustness=== | ===System Robustness=== | ||
*'''Protein Production Rate''' | *'''Protein Production Rate''' | ||
| + | <html><ol style="list-style-type: lower-latin;"> | ||
| + | <li>alpha_FadR</html><br />[[File:Team-NTU-Taida-Sys_f1.png]] | ||
| + | |||
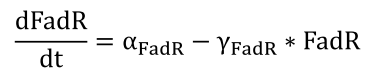
| + | <li>The expression of protein FadR is simply controlled by a constitutively expressed promoter, and therefore is governed by a simple equation</html><br />[[FIle:NTU-Taida-Single-eq1.png|center]] | ||
| + | When the FadR production rate is zero, there is no FadR existing in the cell, which means that TetR is not repressed. So that GLP-1 remains high at this value regardless of FA concentration. After the FadR production rate goes above a threshold not far from 0, sharp transitions between the maximum level of GLP1 and zero appears, as shown by the rainbow-color, nearly vertical plane. The FA value of the intersection between the vertical plane and the ground horizontal plane is the value of FA that triggers the system to produce GLP1, and therefore can represent the filtering threshold of our circuit. FadR production rate affects the value of the threshold dramatically as can be seen by the shifts of the intersection between the vertical plane and horizontal plane rapidly to higher FA values as the production rate increases. The result can be more clearly seen when plotting the y-z cut plane with different alpha_ FadR on the same two-dimensional figure, as shown in Figure 9 in the next section.<html></li> | ||
| + | |||
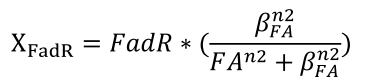
| + | <li>We describe the binding of FAs to FadR proteins by an equation derived from Michaelis-Menten kinetics, which determines the amount of effective FadR repressor, defined as X<sub>FadR</sub></html><br />[[FIle:NTU-Taida-Single-eq2.png|center|TEST]]<html></li> | ||
| + | |||
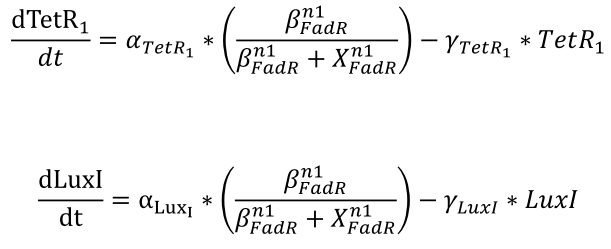
| + | <li>The effective repressors follow Hill kinetics to inhibit the expression of the genes regulated by pfadR, which determines the resulting concentration of TetR1 and LuxI.</html><br />[[FIle:NTU-Taida-Single-eq3.png|center|TEST]]<html></li> | ||
| + | </ol></html> | ||
Revision as of 19:57, 26 September 2012
System Analysis
System Analysis
Contents |
Overview
System analysis explores extensively into the parameter space by sweeping each parameters for certain range while make the others constant. In this way, we can see the corresponding output response when the value of a specific parameter varies within a certain extent. It provides deep insights into the roles each parameter plays in our single cell model. In one aspect, it examines the robustness of our system. In another aspect, it provides valuable information helping us to determine which parameters should be adjusted in order to achieve our expected circuit response, that is, to tune the threshold of our high-pass filter to the desired level.
Parameter Sweeping
Our system analysis model is an extension of our single cell model. In order to perform the parameter sweeping, we replace the constant values of parameters with a range of values. For simplicity, we focus only on the steady state of our circuit. The steady states of each species are derived using Maple, and are then ported to Matlab for simulation. The input of our system, the fatty acid, is also included as our sweeping parameters in each sweep, enabling us to observe the threshold of the filter in our circuit. The combined input and parameter sweeping gives us a 3-dimensional graph, with x-axis, y-axis and z-axis being the parameter under analysis, the input fatty acid concentration and the output GLP1 concentration, respectively.

Results
The following figures show the results of the sweeping of protein production rates, repression coefficients and degradation rates.
System Robustness
- Protein Production Rate
- alpha_FadR
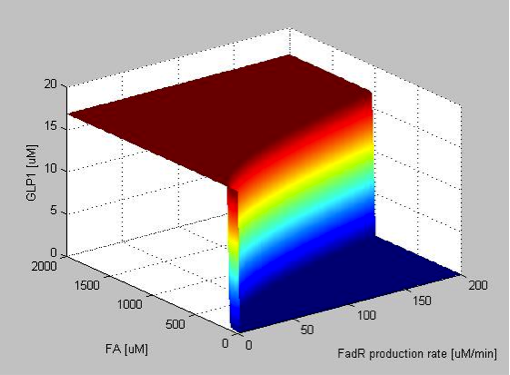
- The expression of protein FadR is simply controlled by a constitutively expressed promoter, and therefore is governed by a simple equation</html>When the FadR production rate is zero, there is no FadR existing in the cell, which means that TetR is not repressed. So that GLP-1 remains high at this value regardless of FA concentration. After the FadR production rate goes above a threshold not far from 0, sharp transitions between the maximum level of GLP1 and zero appears, as shown by the rainbow-color, nearly vertical plane. The FA value of the intersection between the vertical plane and the ground horizontal plane is the value of FA that triggers the system to produce GLP1, and therefore can represent the filtering threshold of our circuit. FadR production rate affects the value of the threshold dramatically as can be seen by the shifts of the intersection between the vertical plane and horizontal plane rapidly to higher FA values as the production rate increases. The result can be more clearly seen when plotting the y-z cut plane with different alpha_ FadR on the same two-dimensional figure, as shown in Figure 9 in the next section.
- We describe the binding of FAs to FadR proteins by an equation derived from Michaelis-Menten kinetics, which determines the amount of effective FadR repressor, defined as XFadR
- The effective repressors follow Hill kinetics to inhibit the expression of the genes regulated by pfadR, which determines the resulting concentration of TetR1 and LuxI.