Team:NTU-Taida/Modeling/Single-Cell
From 2012.igem.org
Single Cell Model
Contents |
Motivation
Inferring from our circuit design, we expect to see an anti-noise response of GLP1 in spite of the fluctuating level of fatty acid. However, since the overall response of GLP1 strongly depends on the actual dynamics and equilibrium state of the species involved in the network, we are not able to confirm the anti-noise function without a detailed, quantitative analysis. Furthermore, the overall sensing threshold of fatty acid in our circuit plays a critical role in the function of our system, determining if our system is able to distinguish between the basal fatty acid level (the noise) and the FA level after food intake (the signal) and respond properly. Therefore, we performed single cell model to confirm the function of our circuit and examine the threshold of our high pass filter.
Overview
The single cell model describes the species involved in our synthetic circuit of a single pepdex E. coli. By non-linear ordinary differential equations (ODEs), the change in species concentrations over time is simulated, with most of the ODEs following Hill kinetics. The parameters used in our single cell model are derived from studies supported by experimental evidence, as listed in our Parameters part. After thorough analysis, some of the parameters are adjusted to meet our own experimental approaches, as described separately in the following sections. Our single cell model was simulated using numerical Matlab solvers.
Our Model
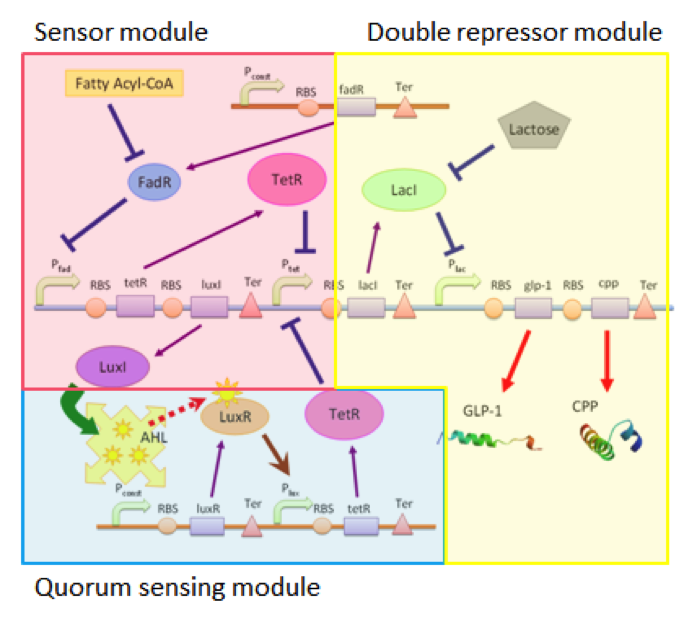
Our circuit can be divided into three connected but independent modules: the sensor module, double repressor module and the quorum sensing module, as shown in Figure 1.
The three modules are almost independent, connected between each other only by a single species. The independence of the three modules enables us to adjust each module according to different application without affecting the function of other modules. For example, we can use different sensors with the double repressor and the quorum sensing modules, allowing our cells to act as biological factories able to respond to different substances if the need arises.
Sensing Module
Our sensing module senses the presence of fatty acid by the function of the fadR promoter. Fatty acids bind to FadR proteins and block the repression activity of FadR to the fadR promoter, therefore enabling the expression of the genes regulated by pfadR. In this module, we simulate the sensor by separating the chemical pathway into three consecutive steps : (a.) the expression of protein FadR (b.) the binding of FA to FadR proteins, and (c. ) the repression of pfadR by FadR proteins.
- The expression of protein FadR is simply controlled by a constitutively expressed promoter, and therefore is governed by a simple equation $$\frac{\text{d}FadR}{\text{d}t}=\alpha_{FadR}-\gamma_{FadR}\times FadR$$
- We describe the binding of FAs to FadR proteins by an equation derived from Michaelis-Menten kinetics, which determines the amount of effective FadR repressor, defined as XFadR $$X_{FadR}=FadR\times (\frac{\beta^{n2}_{FadR}}{FA^{n2}+\beta^{n2}_{FA}})$$
- The effective repressors follow Hill kinetics to inhibit the expression of the genes regulated by pfadR, which determines the resulting concentration of TetR1 and LuxI. $$\frac{\text{d}TetR_{1}}{\text{d}t}=\alpha_{TetR_{1}}\times (\frac{\beta^{n1}_{FadR}}{\beta^{n1}_{FadR}+X^{n1}_{FadR}})-\gamma_{TetR_{1}}\times TetR_{1}$$ $$\frac{\text{d}LuxI}{\text{d}t}=\alpha_{LuxI}\times (\frac{\beta^{n1}_{FadR}}{\beta^{n1}_{FadR}+X^{n1}_{FadR}})-\gamma_{LuxI}\times LuxI $$
There were not much existing literature about the exact parameters of betaFA and betaFadR, only the overall relationship between the input FA and the expression of genes controlled by pFadR. Therefore, we fit our parameters to the experimental data shown in a recent study [1], which has a sensing threshold of approximately 200 uM to find the value of betaFA and betaFadR.
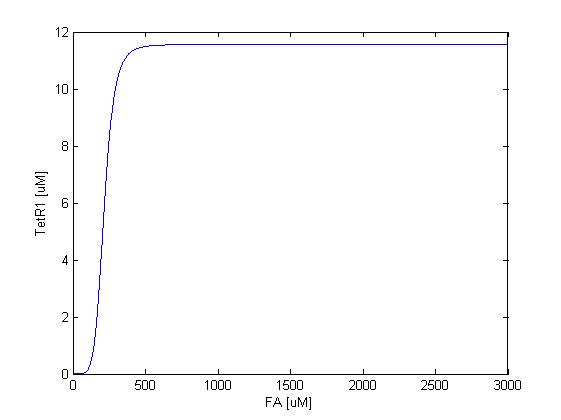
The resulting response curves of LuxI and TetR1 are shown below.
We can see in figure 2 that LuxI is expressed only at FA concentrations higher than around 200uM, consistent with our reference literature, and the expression gets almost completely repressed when the FA concentration falls below 100 uM.
As shown in figure 3, TetR1 display almost the same sensing response to the input FA concentration, except for the different expression levels, where the synthesis strength (and therefore the expression level ) of LuxI is adjusted to be higher to amplify the effect of the quorum sensing system. TetR1 is expressed only at FA concentrations higher than around 250uM and repressed when FA concentration falls below 100uM
Double Repressor Module
Recent studies have shown that longer transcriptional cascades make the steady-state switching behavior sharper[2]. Therefore, we connect our sensing module to the double repressor module, which is essentially a two stage transcriptional cascade, and expect the output of double repressor module, GLP1, to display sharper transition between steady states than output of the sensing module TetR1 or LuxI. To examine this, we use Hill functions to describe each step in the double repressor cascade.
$$\frac{\text{d}LacI}{\text{d}t}=\frac{\alpha _{LacI}}{1+(\frac{TetR_{1}+TetR_{2}}{\beta_{TetR}})^{n5}}-\gamma_{LacI}\times LacI$$ $$\frac{\text{d}GLP1}{\text{d}t}=\frac{\alpha _{GLP1}}{1+(\frac{LacI}{\beta_{LacI}})^{n6}}-\gamma_{GLP1}\times GLP1$$
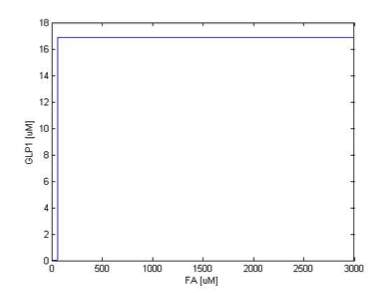
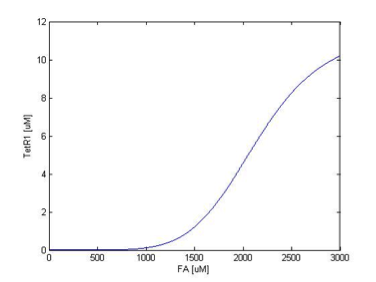
Figure 4 show the comparison between the output of the sensing module, that is, the input of double repressor module, and the output of the double repressor module. It can be seen clearly that the transition of steady state in GLP1 is much sharper than their TetR1 counterparts, which enable the overall system to play as a more sensitive high concentration pass filter (not high frequency pass filter). Although as the slope of transition zone become higher, the corresponding filtering threshold seems to drop a little, we can adjust our overall filtering threshold with the help of system analysis. Figure 5 shows the result when the sensing threshold was tuned higher. Again, by coupling with double repressor module, the transition of steady state in GLP1 is much sharper than that of TetR1. Therefore, we prove the response sharping function of our double repressor module.
Quorum Sensing Module
We incorporate the quorum sensing module to enable cells to communicate with each other as the uneven distribution of fatty acid in the intestines may cause gaps in individual detection. Cells with quorum sensing module can respond to the food intake event as long as their neighboring cells have detected fatty acid and therefore enhance the overall response to the food intake. In the quorum sensing system, besides considering the degradation and synthesis of the involved species, we included the diffusion terms to describe the diffusion of AHL. We separate the species AHL into those within cells and those outside of cells, which are named AHLi and AHLe, respectively.
Within the cells, we assume the synthesis of AHL as proportional to the level of LuxI, and degradation of AHL proportional to the level of itself. In addition, AHL will diffusion into cells if the AHL concentration outside cells is larger and vice versa.
$$\frac{\text{d}AHL_{i}}{\text{d}t}=ks1\times LuxI-ks0 \times AHL_{i}-\eta\times(AHL_{i}-AHL_{e})$$ Outside the cells, there is no synthesis, only degradation. Similarly, we consider the diffusion term.
$$\frac{\text{d}AHL_{e}}{\text{d}t}=-kse\times AHL_{e}+\eta_{Ext}\times(AHL_{i}-AHL_{e})$$ The dimerization of AHL in the cells with LuxR result in R complex, with LuxR constitutively expressed at a high level of 10 uM.
$$\frac{\text{d}R}{\text{d}t}=\rho\times (LuxR)^{2} \times (AHL_{i})^{2}-\gamma_{R}\times R$$ Finally, TetR2 acts as the output species of our quorum sensing system described by Hill kinetics.
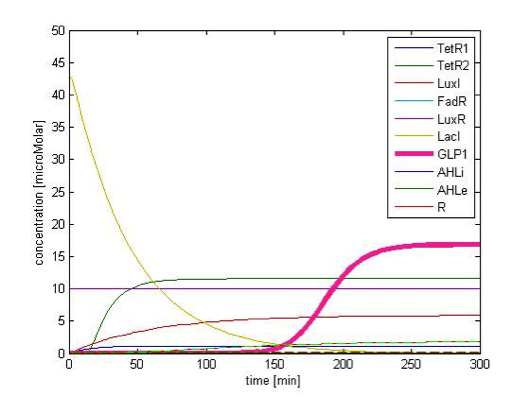
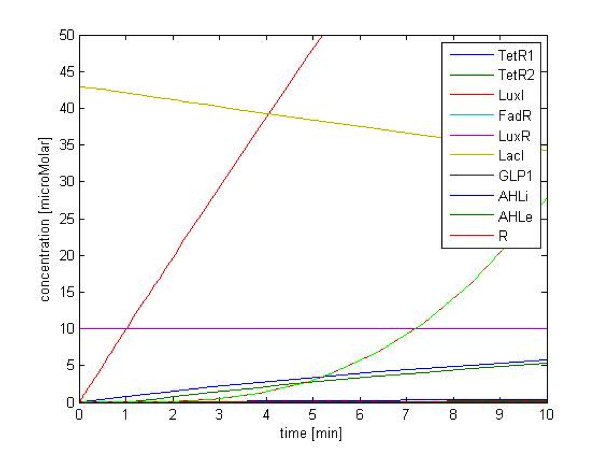
$$\frac{\text{d}TetR_{2}}{\text{d}t}=\alpha_{TetR_{2}}\times \frac{R^{n3}}{\beta^{n3}_{R}+R^{n3}}-\gamma_{TetR_{2}}\times TetR_{2}$$ In figure 6, we can see that the level of AHLi, AHLe and R rise immediately as FA appears at time=0 (FA level is not shown in the figure, FA is added at time=0 at level of 2 mM, which is at the order of normal fatty acid after food intake, and persists for the whole time span in the figure).
The effect of communication between cells cannot be demonstrated by the single cell model, but can be seen in the “cell population response model” section of “2D & 3D combined model”. In the results part below, we demonstrate another effect of the quorum sensing system, the prolonged response.
Results
Filter
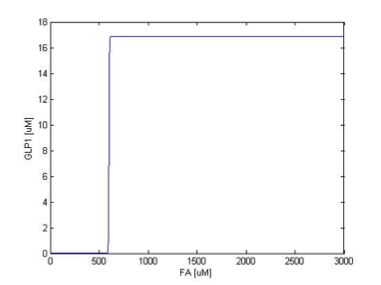
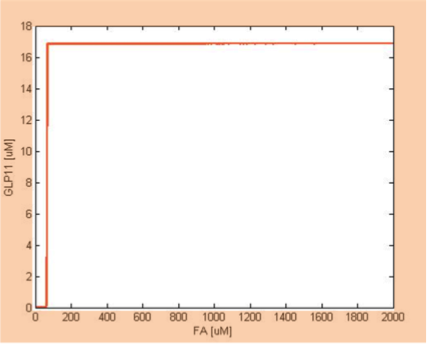
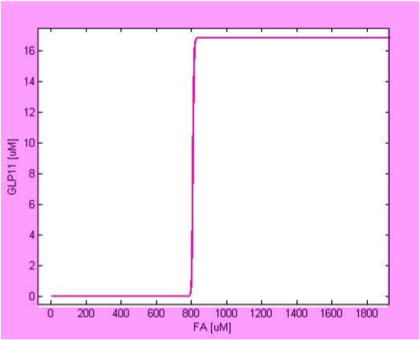
We simulate the response of output GLP to different input fatty acid concentration level to see if our circuit behaves as a high-pass filter. Figure 7 shows the result when we first performed the single cell analysis. We can see that there is indeed a sharp high pass filter, but with a relatively small filter threshold. Since the baseline concentration of fatty acid is shown in literature to be about 400uM , we want to set the threshold to be around 800 uM so as to filter out the baseline noise. With the help of system analysis, we adjust the parameters and are able to tune the threshold to our desired level, as shown in figure 8. As a result, single cell modeling confirms that our circuit can serve as a high-pass filter with tunable threshold.
Temporal response to FA input
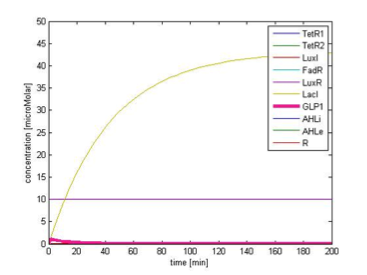
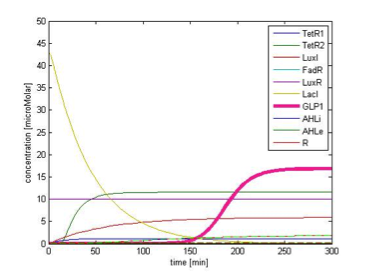
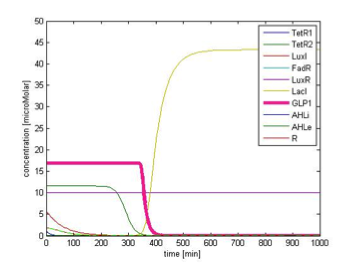
By single cell modeling, we are able to observe the dynamic change of species concentration over time. The figures below are continuous in time, that is the time=0 in Figure 9B actually begin when time=200 min, and the time=0 in the Figure 9C begin when time=450 min. We separate them in different figures for the convenience of illustration. In order to observe the change in GLP1 output, we adjust the scale of the figures to fit the level of GLP1, therefore some species, such as FadR, may not be seen in the figures due to their high expression level.
Initial Condition
Figure 9A. shows the initial conditions of our system. FadR, LuxR are constitutively expressed so they are kept at constant level. The concentration of LacI starts to rise toward its steady state level. At the beginning, because there is no LacI, the concentration of GLP1 rises. As the level of LacI increases, the level of GLP1 starts to fall. All species achieve their steady state level at about 200 min.
Response in presence of FA
Figure 9B shows the response of GLP1 when 10mM of FA is added at the time=0 of figure 9B. We can see from the figure that the concentration of GLP1 starts to rise at about 120 min after FA input and rises to its maximum level at around 210 min.
Transition to return to equilibrium
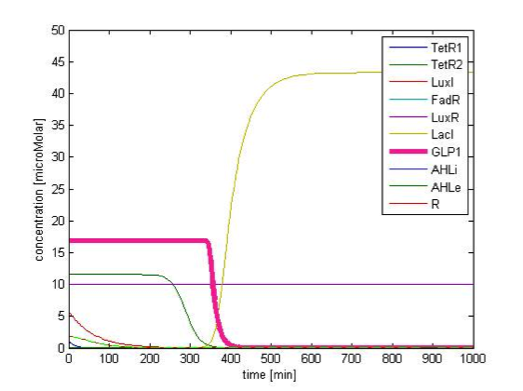
Figure 9C shows the response of GLP1 when FA input is removed. After the input disappears, our system displays sustained GLP1 response for about 350 minutes due to the effect of the quorum sensing system, as described in the next part.
Prolonged GLP1 response due to quorum sensing system
System
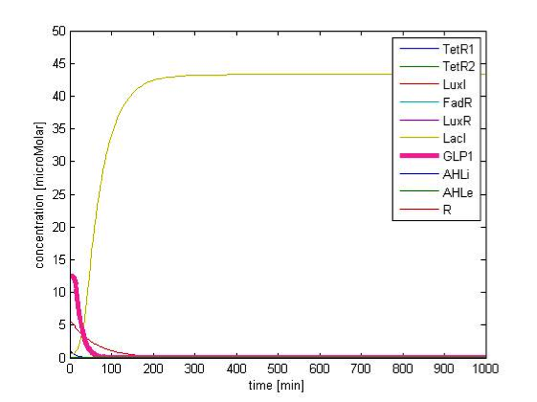
Although the effect of quorum sensing is mainly seen in behavior of a cell population, we show that by incorporating the quorum sensing system, the duration of sustained GLP1 level after the disappearance of fatty acid dramatically increases. The comparison of the GLP1 response after FA level falls between systems with and without the quorum sensing module is shown in figure 10. With the quorum sensing module, the duration increases from 50 min to 350 min, providing prolonged GLP1 response, as desired.
Resist to short period noise
In addition to the ability to filter out FA baseline level, our circuit can also filter out the perturbations which last too short in time. Figure 11 shows the GLP1 response with short lasting noise. The FA input lasts for 10 min, at the level of 10 mM, which exceed our threshold level extensively. However, GLP1 concentration doesn’t rise. This property is due to the time delay required in transcriptional cascade of the double repressor module.
Reference
- Zhang F, et al. (2012) Design of a dynamic sensor-regulator system for production of chemicals and fuels derived from fatty acids. Nature Biotechnology 30(4):354-9.
- Sara Hooshangi , Stephan Thiberge, and Ron Weiss, Ultrasensitive and noise propagation in a synthetic transcriptional cascade , pnas, vol. 102, no.10, 3581-3586, 8 2005.
 "
"


