Team:NTU-Taida/Modeling
From 2012.igem.org
Modeling Overview
Since our system is designed to work in the human intestine, it depends heavily on the physiological condition in human body. There’s usually a gap between the reality and the models, especially for those regarding true physiological conditions. To solve this, we take the real conditions into consideration as much as possible, either incorporates them into the model design or adjust our model parameters to fit to the conditions, and again, evaluate if our results are compatible to reality. Our ultimate goal is to bring our simulation closer and closer to the real conditions.
The intimate interaction between our system and the physiological environment can be seen from the very beginning in our circuit design. There is in fact a baseline level of fatty acid in the gut even during the time without food intake. However, we don’t want our E.coli cells to respond to this noise. Therefore, we designed a filter in our circuit to filter out the baseline noise. After a fatty meal, the concentration of fatty acid around the cells gradually increases. When fatty acid level rises above the threshold, the circuits in the cells are turned on and express GLP-1 in response. In this way, we aim to make our cells to respond sensitively to fat intake, but remain silent to the baseline noise.
To achieve this, we have to first ensure that the filter will work. Therefore, we start our modeling effort with the single cell model to verify the filter function of our circuit.
Contents |
Single Cell Model
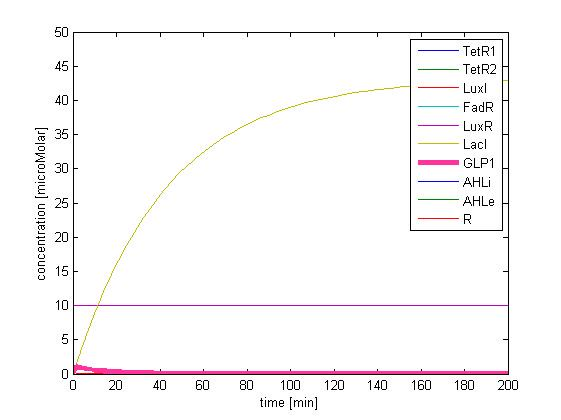
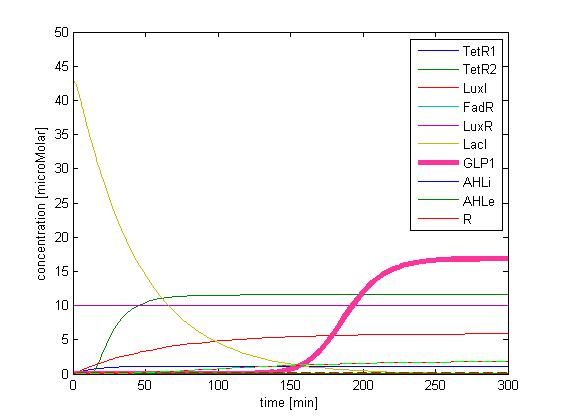
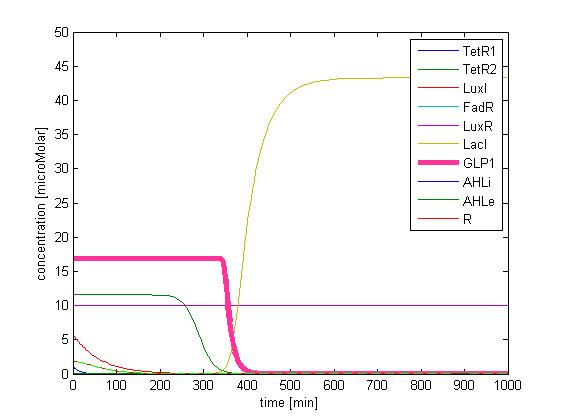
The single cell model is the basis of our modeling. It described each species involved in our circuit by a set of ordinary differential equations and shows the function of our modules. With the single cell computational model, we verified the filter function of our circuit, and found the initial threshold of the high pass filter in our circuit as 100 uM.
| $$X_{FadR}=FadR\times (\frac{\beta^{n2}_{FadR}}{FA^{n2}+\beta^{n2}_{FA}})$$
$$\frac{\text{d}TetR_{1}}{\text{d}t}=\alpha_{TetR_{1}}\times (\frac{\beta^{n1}_{FadR}}{\beta^{n1}_{FadR}+X^{n1}_{FadR}})-\gamma_{TetR_{1}}\times TetR_{1}$$ $$\frac{\text{d}LuxI}{\text{d}t}=\alpha_{LuxI}\times (\frac{\beta^{n1}_{FadR}}{\beta^{n1}_{FadR}+X^{n1}_{FadR}})-\gamma_{LuxI}\times LuxI$$ $$\frac{\text{d}FadR}{\text{d}t}=\alpha_{FadR}-\gamma_{FadR}\times FadR$$ |
In addition, the single cell model helps us to have a complete view of how modules act together as a system in a single E.coli cell and provides a quantitative visualization of the dynamical behavior of our sensor, high pass filter and quorum sensing module.
In order to have a better experimental (wet) characterization of each module, we performed functional tests for each module individually – i.e. PfadBA-RBS-mRFP (BBa_K817033) to characterize sensor, J23119 (constitutive promoter)-RBS-SP1-GLP1-xx (BBa_K817008) to characterize the effector, etc.
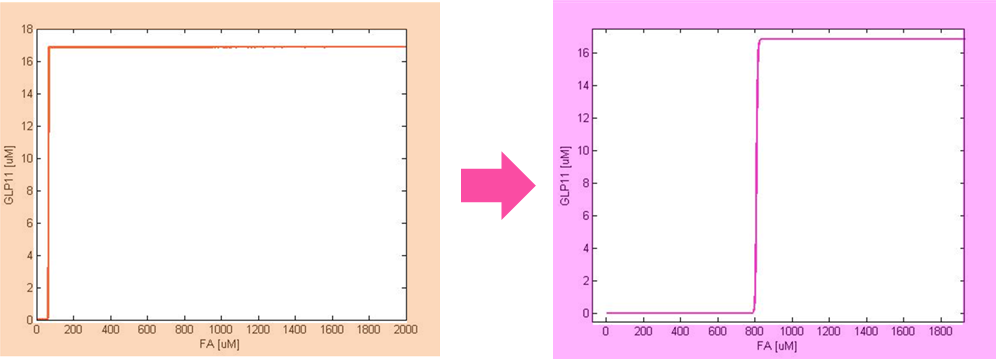
So far, we have verified the filter function of our circuit. However, we didn’t know if the current threshold, which is about 100 uM, would be appropriate for the real physiological condition. Therefore, we have to investigate the true condition of the environment in human gut. After a series of literature review, we decided to fix the filter threshold at 800 uM. Furthermore, we seek to construct a model to simulate the concentration of fatty acid after a meal.
Fatty Acid Reaction-Absorption Model
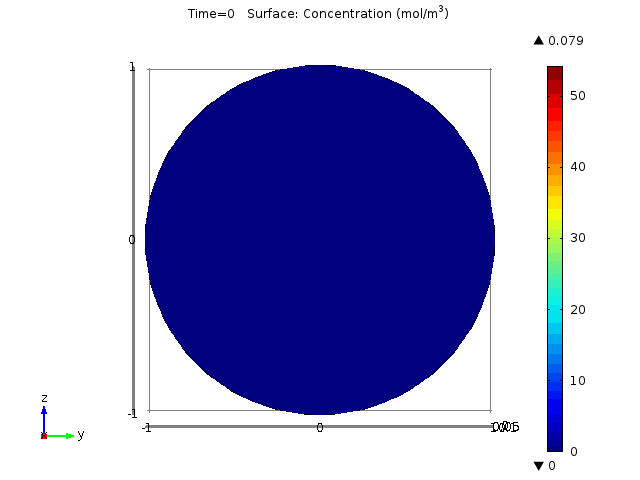
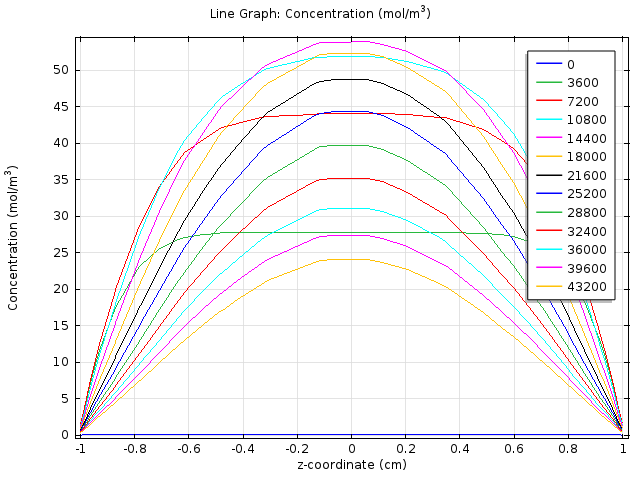
We created a two dimensional fatty acid reaction- absorption model, using the mechanical engineering software platform COMSOL, to describe the spatial-temporal change of fatty acid level in the extracellular environment after a meal. In this model, we consider the hydrolysis of fat in the lumen and the absorption of fatty acid at the gut wall and aims to determine if the response time falls in the physiological reasonable time scale.
System Analysis
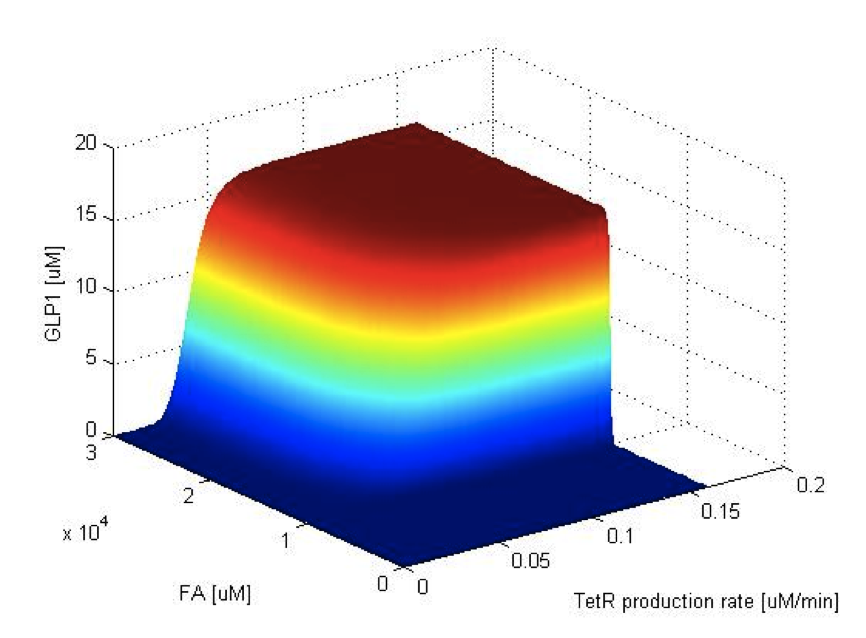
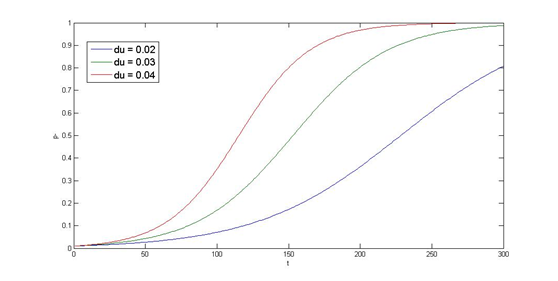
Now we have the threshold suitable for real condition, which is about 800 uM. Next we have to find the way to adjust our threshold to this value. We performed system analysis to find the most suitable parameter to adjust the threshold of our circuit. The system analysis explores extensively into the parameter space, and helps us to have better understanding of the roles each parameter plays in our single cell model.
After the analysis, we chose the production rate of FadR as the critical parameter to adjust and successfully tuned the threshold from 100uM to 800uM to fit the physiological conditions.
Stochastic Analysis
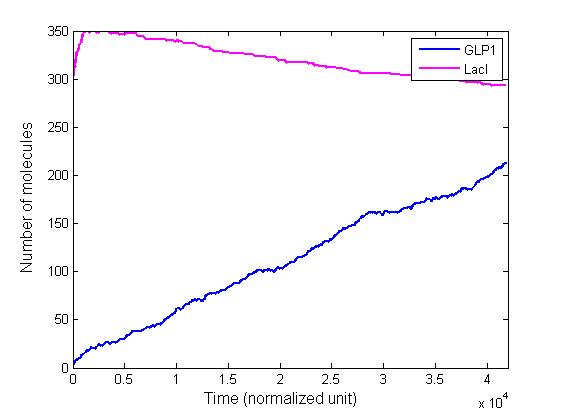
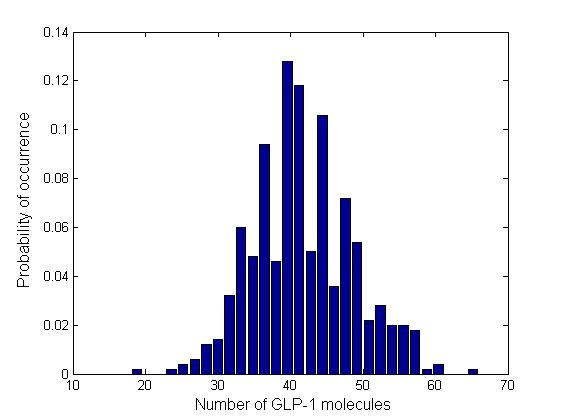
Besides the parameter space search, we performed another type of analysis to verify the robustness and the mono-stability of our system. Because gene expression is an intrinsically stochastic process, we performed stochastic simulations to see how our system reacts to noise and how it responds to perturbations. We were especially interested in the filter function, whether it is always present and whether the amount of GLP-1 produced in the cells for different concentrations of fatty acid has large fluctuations.
2D & 3D Combined Model
With the single cell model, fatty acid reaction-absorption model, and system analysis, we have verified the filter function of our circuit, simulated the real physiological fatty acid level at intestinal wall, and adjust our filter threshold to fit to the real condition. Next, we want to combine them together and see what would happen when we put cells in the intestine after a fatty meal.
The combined model is composed of three different sections.
2D Combined Model
2D combined model simulates the GLP1 response of Pepdex E-coli cells after the food intake in the x-y cross-sectional plane.
2D Cell Population Model
2D Cell population response model further considers the possible uneven concentration of fatty acid along the z-axis due to non-uniform distribution of lipase and simulates how the quorum sensing system assists our system to overcame this possible limitation and enhance the response.
3D Cell Population Model
Finally, 3D Cell population response model incorporates all the consideration to generate a full model to visualize the dynamic behavior of our system.
Plasmid Stability Model
Last but not least, we performed a simulation of the partition system. As our PepdEx system consists of several plasmids and will function outside of the laboratory (human gut) which lacks of antibiotic selection pressure, plasmid segregation stability is critical that determines whether every single E. Coli cell contains the original system with the designated function. Inspired by natural plasmid & mobile gene element, we cope with segregation instability by incorporating three modules, i.e. partition system, Multimer resolution system and toxin antitoxin system, on top of our system. Choosing which module to stabilize the system needs modeling and stability assay, at this section, we will use cooper’s model as an example.
Overall, we think that modeling was valuable to the decision process in constructing our synthetic network. With the communication between the biologists and modelers, we will be able to, from a simulation result, guide experimentalists in choosing a ‘part’ with appropriate parameter sets (e.g. promoter strength, protein degradation rates) from the sea of iGEM registry, and provide quantitative insights to our flexible and expandable PepdEx system.
 "
"


