Team:Bielefeld-Germany/Results/Summary
From 2012.igem.org
KevinJarosch (Talk | contribs) |
KevinJarosch (Talk | contribs) (→Harvesting and Purification of BPUL) |
||
| Line 140: | Line 140: | ||
<br style="clear: both" /> | <br style="clear: both" /> | ||
| + | At the bginning of the elution the chromatogramm shows a remarkable widespread peak at the begining of the elution. This peak can be explained by the elution of bounded proteins at the weak imidazol concentration. The corresponding fractions were analysed by SDS-PAGE. Afterwads there is an upwards trend of the UV-signal. This trend is caused by the increasing Imidazol concentration during the Eltution gradient. Towards the end of the elution procedure there are different and strong peaks detectable. These peaks results from a problem with the tube between the conductivity sensor and the UV-detector. During the elution the connector of the tube has become detached in front of the UV-detector. The Connection were not screwed corretly which leaded to a lost of volume of the corresponding fractions and most probably the measured peaks caused by air bubbles. Just to be on the safe side, the corresponding fractions were analysed by SDS-PAGE analysis. The results of the SDS-PAGE are shown in the following pictures. | ||
::::::::::: '''!!SDS-Page!!''' | ::::::::::: '''!!SDS-Page!!''' | ||
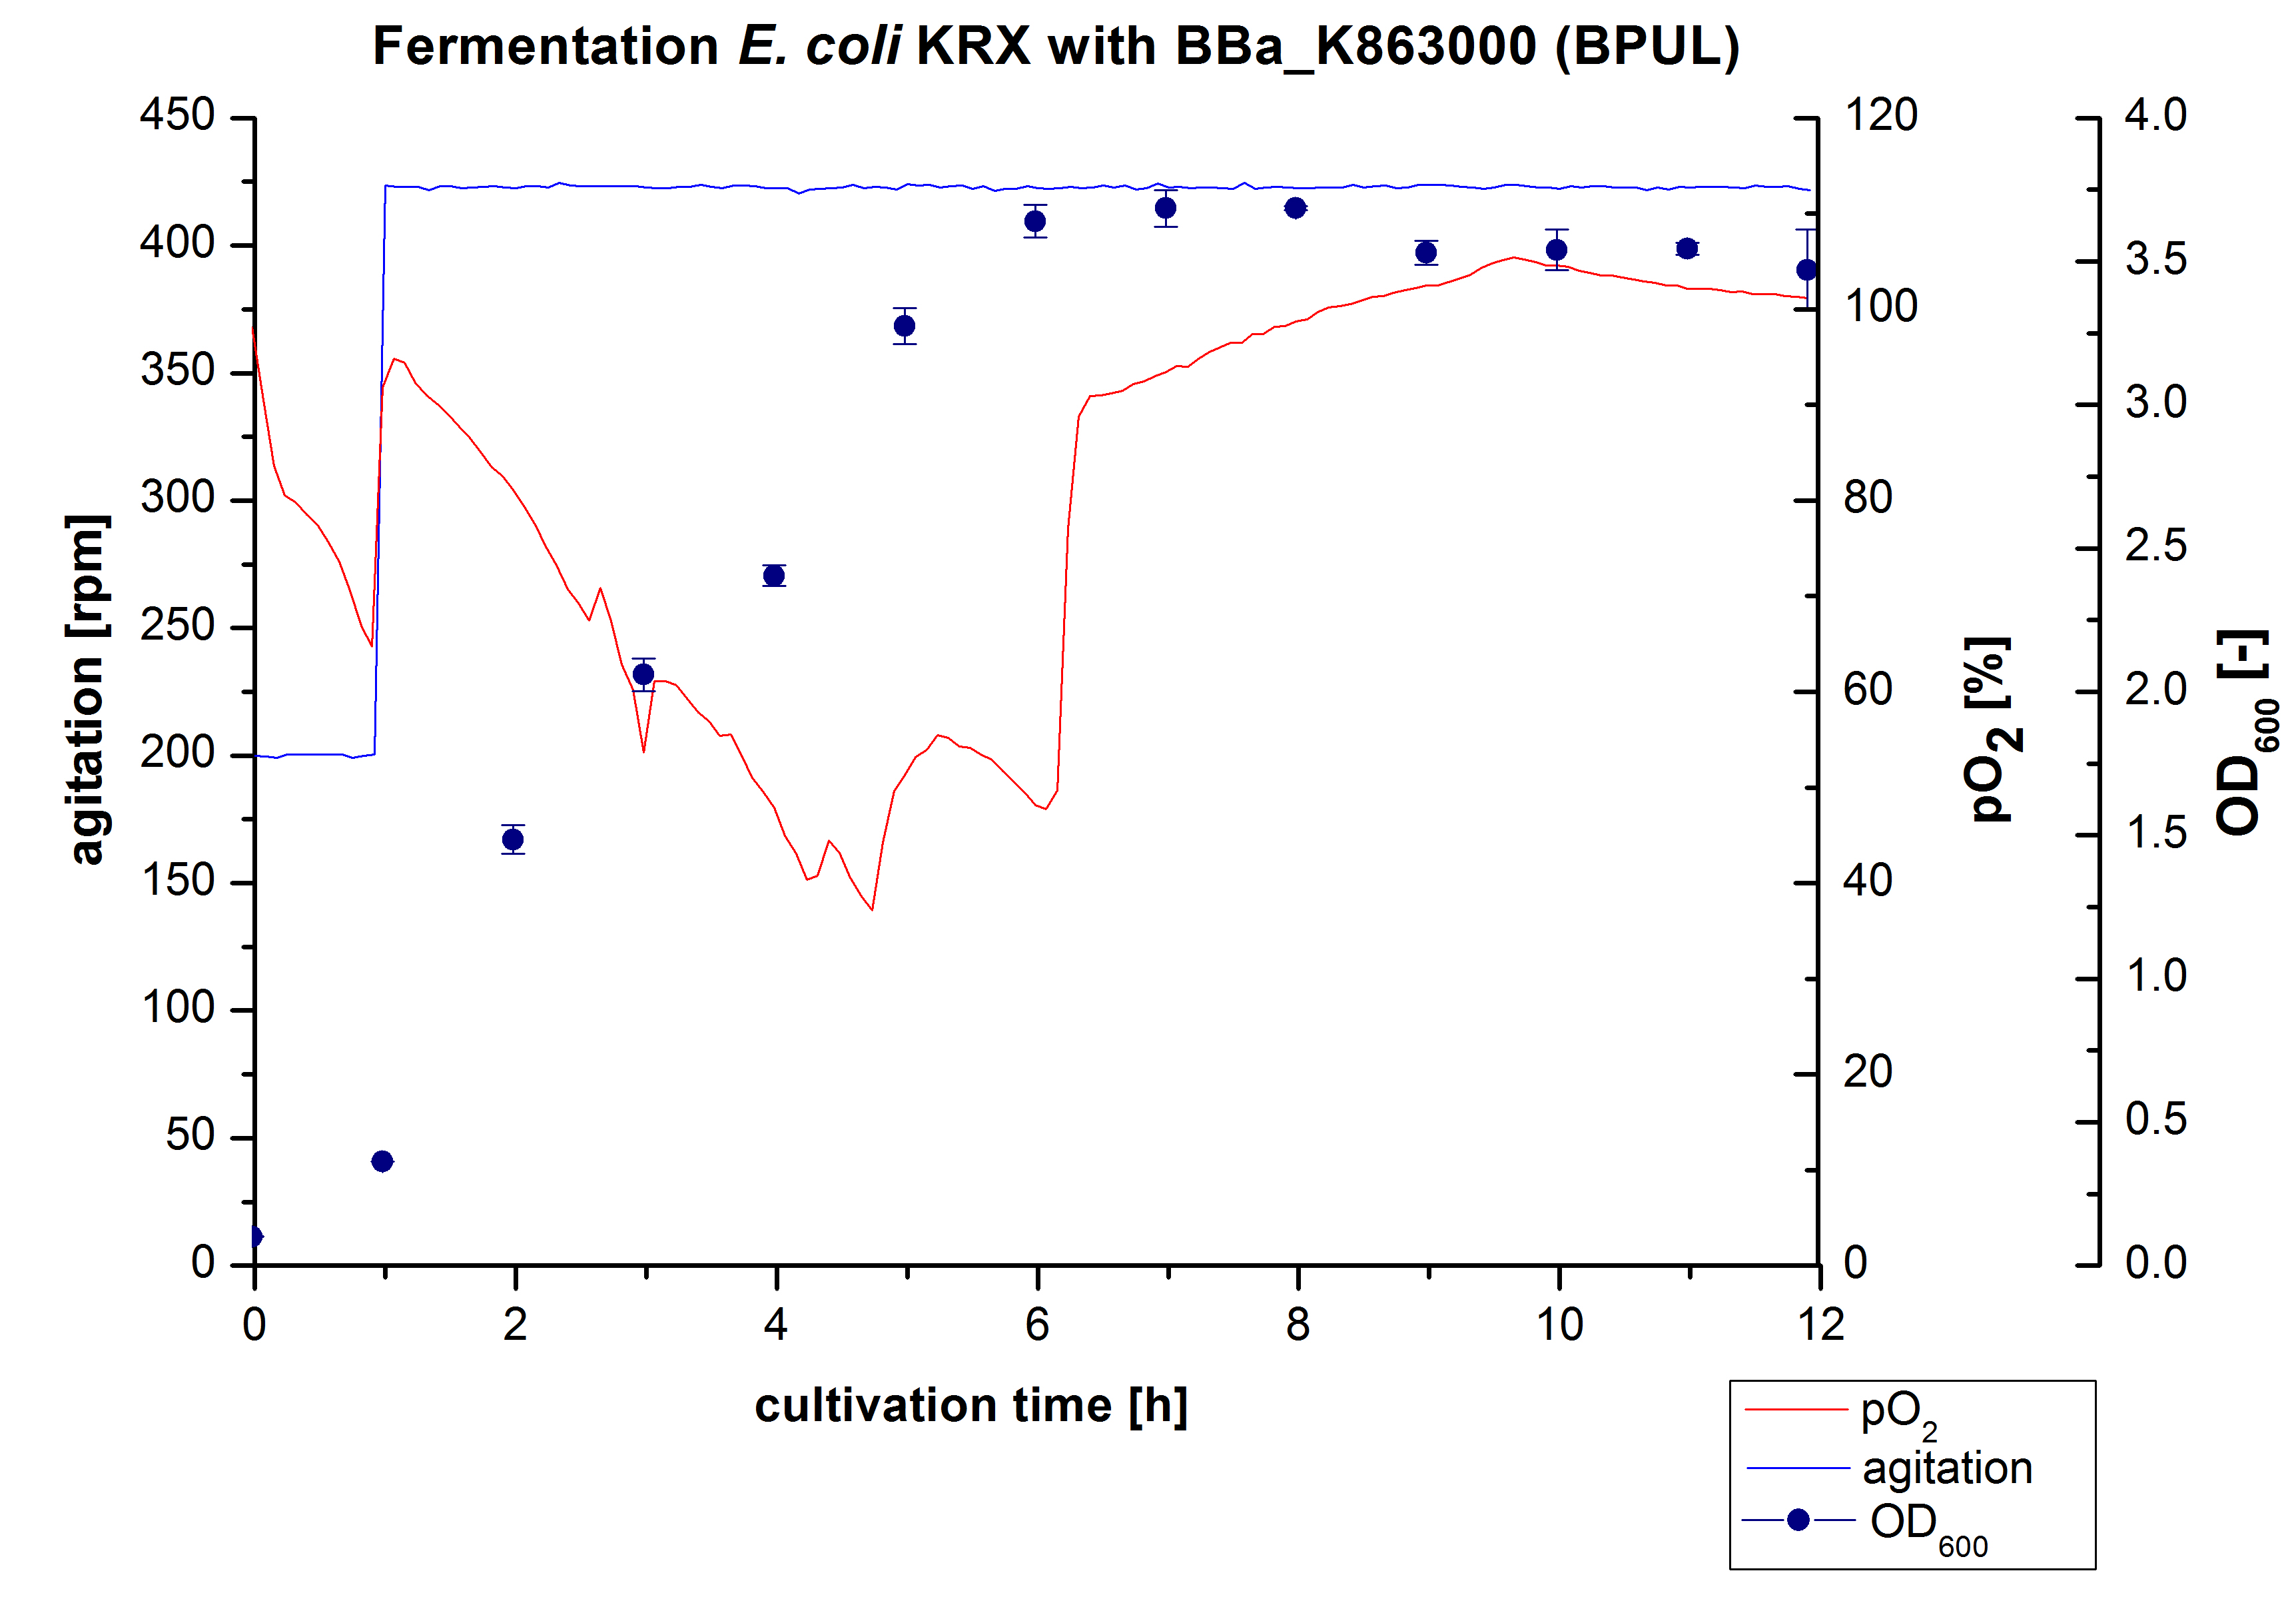
Another scale-up of the fermentation of ''E. coli'' KRX with <partinfo>BBa_K863000</partinfo> was made up to a final working volume of 6 L in Bioengineering NFL22. Agitation speed, pO<sub>2</sub> and OD<sub>600</sub> were determined and illustrated in Figure 3. There was no noticeable lag phase and the cells immediatly began to grow. Agitation speed was increased up to 425 rpm after one hour due to control problems. Then the pO<sub>2</sub> sank until a cultivation time of 4,75 hours, when the deceleration phase started. Then it increased again. There is no visible break through induction of protein expression. A maximal OD<sub>600</sub> of 3,68 was reached after 7/8 hours of cultivation, which is similar to the 3 L fermentation (OD<sub>600</sub> = 3,58 after 10 hours, time shift due to long lag phase). The cells were harvested after 12 hours. | Another scale-up of the fermentation of ''E. coli'' KRX with <partinfo>BBa_K863000</partinfo> was made up to a final working volume of 6 L in Bioengineering NFL22. Agitation speed, pO<sub>2</sub> and OD<sub>600</sub> were determined and illustrated in Figure 3. There was no noticeable lag phase and the cells immediatly began to grow. Agitation speed was increased up to 425 rpm after one hour due to control problems. Then the pO<sub>2</sub> sank until a cultivation time of 4,75 hours, when the deceleration phase started. Then it increased again. There is no visible break through induction of protein expression. A maximal OD<sub>600</sub> of 3,68 was reached after 7/8 hours of cultivation, which is similar to the 3 L fermentation (OD<sub>600</sub> = 3,58 after 10 hours, time shift due to long lag phase). The cells were harvested after 12 hours. | ||
| Line 149: | Line 150: | ||
<br style="clear: both" /> | <br style="clear: both" /> | ||
| - | + | ||
::::::::::: '''!!SDS-Page!!''' | ::::::::::: '''!!SDS-Page!!''' | ||
Revision as of 16:37, 23 September 2012
Summary
BPUL - Laccase from Bacillus pumilus DSM 27 (ATCC7061)
Fermentation E. coli KRX with <partinfo>BBa_K863000</partinfo>
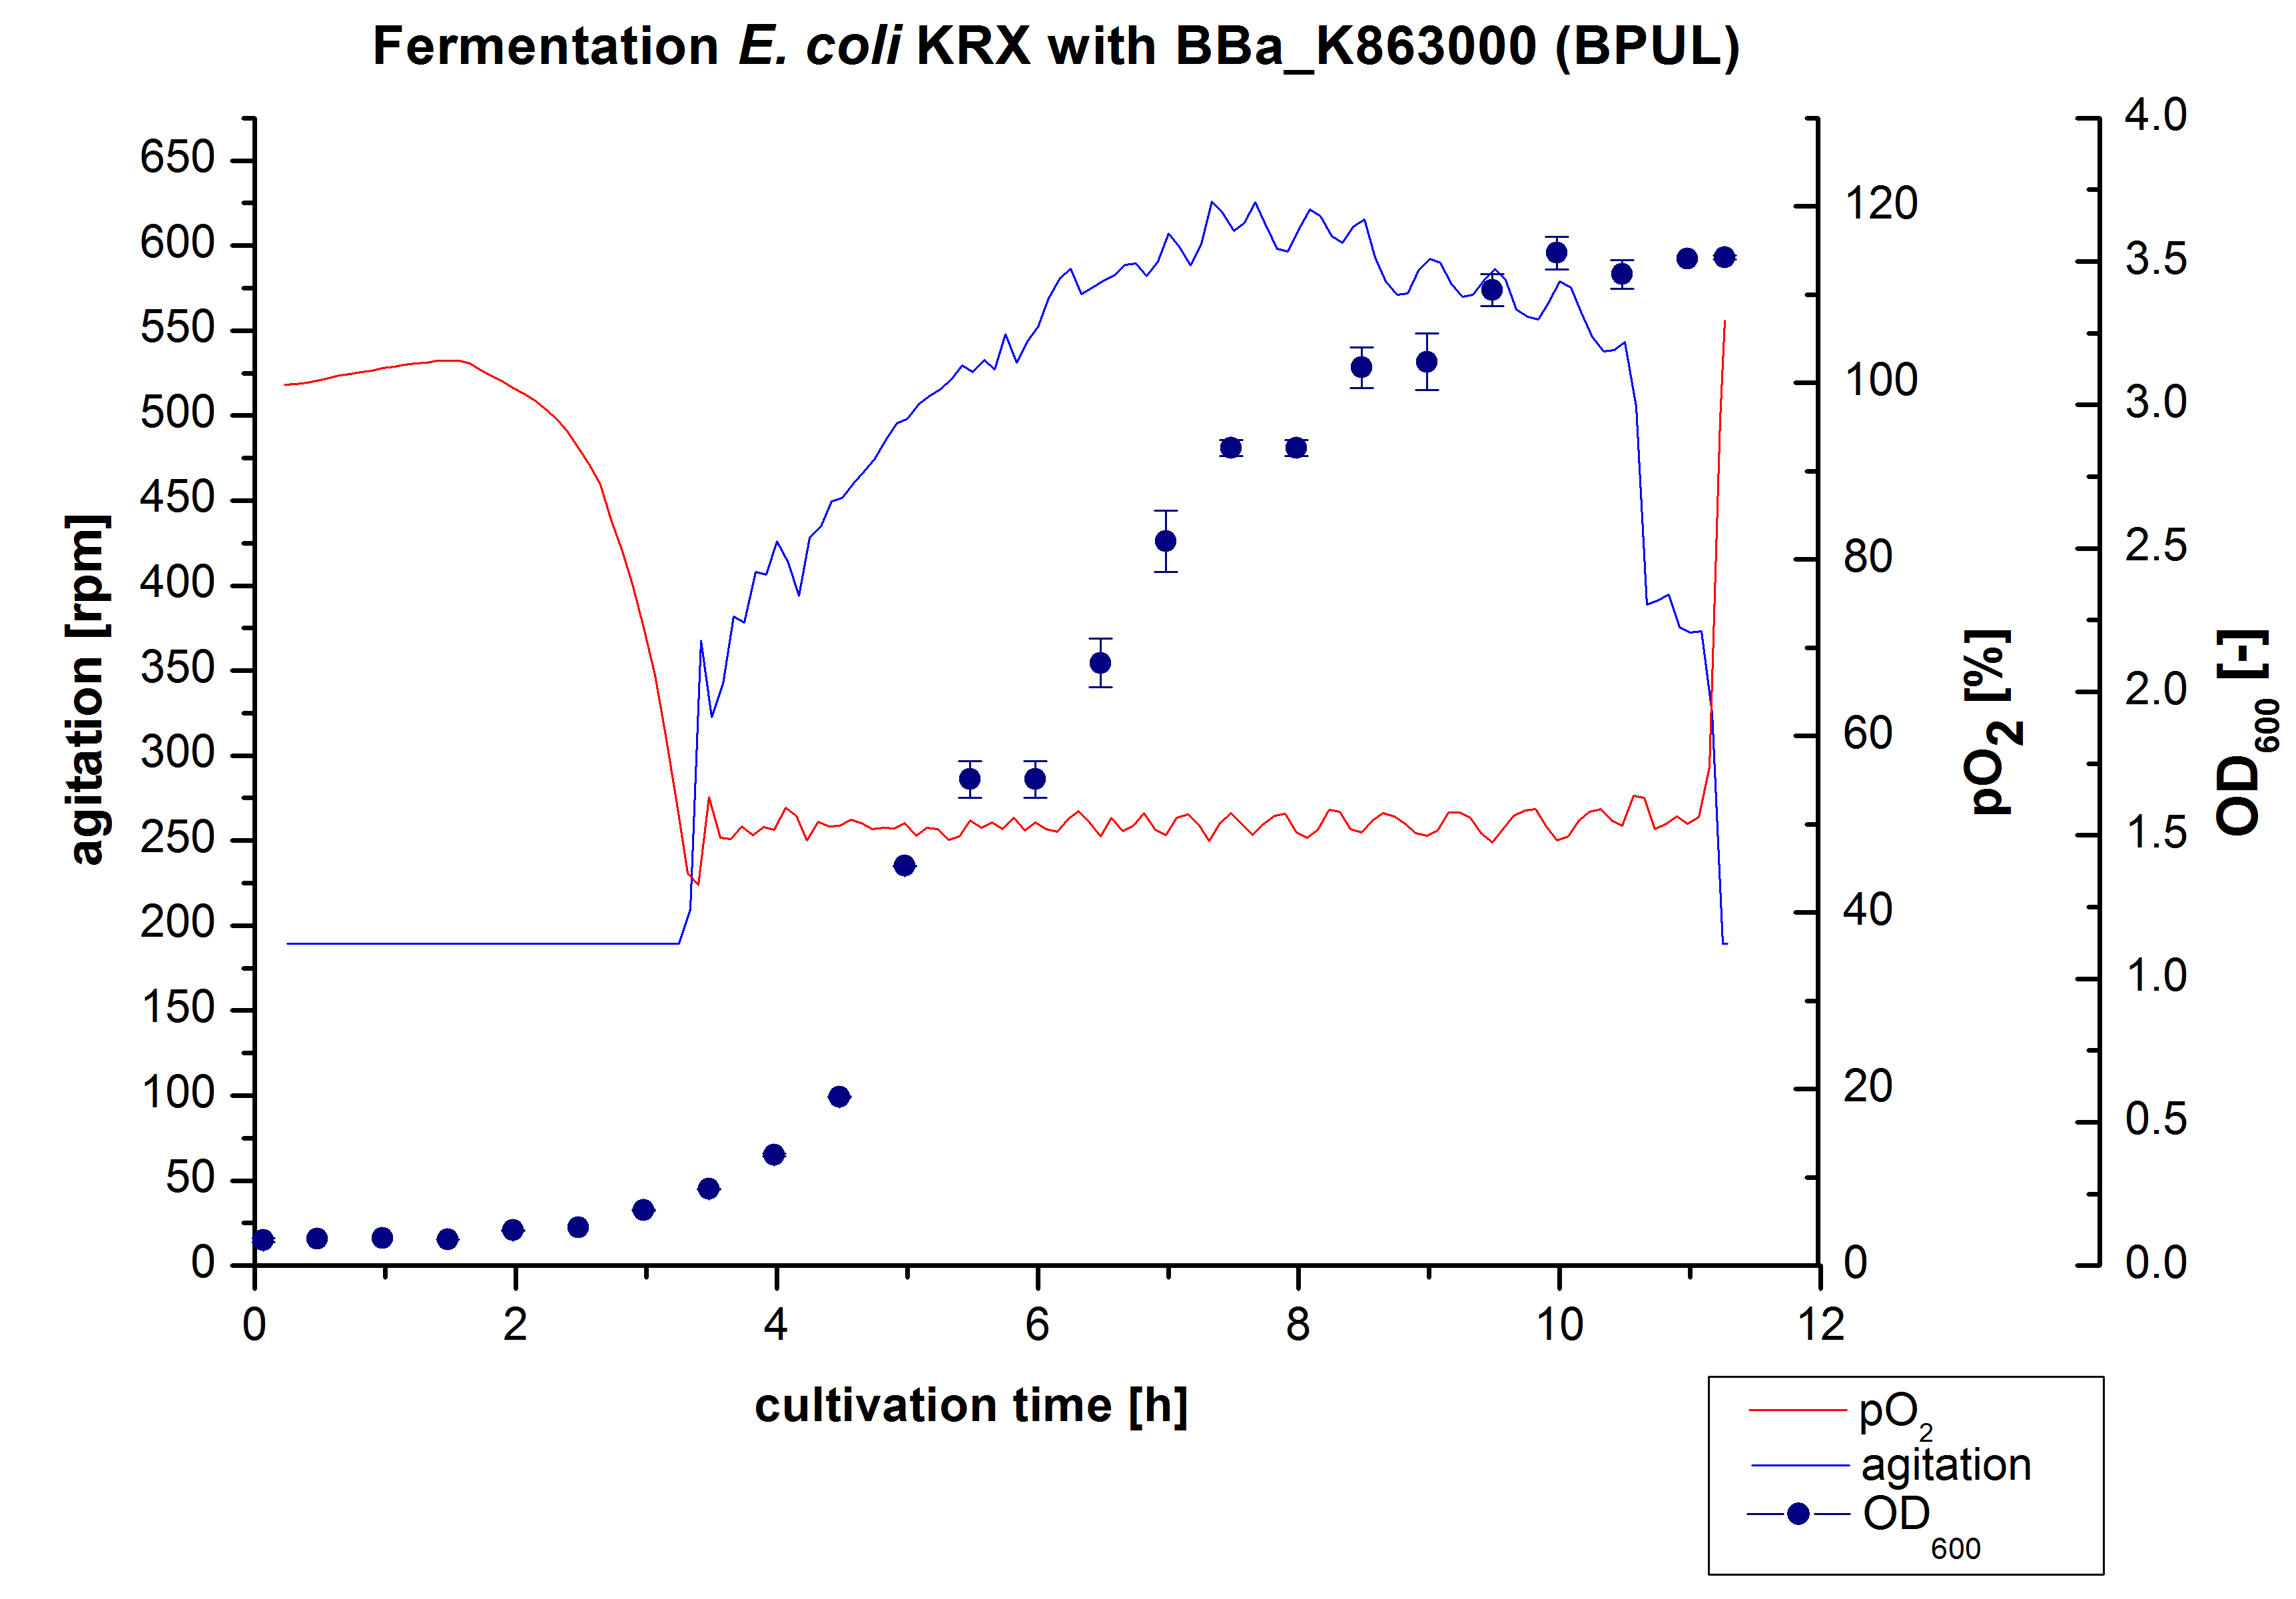
After the measurement of activity of BPUL we made a scale-up and fermented E. coli KRX with <partinfo>BBa_K863000</partinfo> in Braun Biostat B with a total volume of 3 L. Agitation speed, pO2 and OD600 were determined and illustrated in Figure 1. We got a long lag phase of 2 hours due to a relativly old preculture. The cell growth caused a decrease in pO2 and after 3 hours the value fell below 50 %, so that the agitation speed increased automatically. After 8,5 hours the deceleration phase started and therefore the agitation speed was decreased. There is no visible break in cell growth through induction of protein expression. It is probably that we did not produce such a great amount of BPUL that it had any influence on cell growth or that it is not active so far. The maximal OD600 of 3,53 was reached after 10 hours, which means a decrease of 28 % in comparison to the fermentation of E. coli KRX under the same conditions(OD600,max =4,86 after 8,5 hours, time shift due to long lag phase). The cells were harvested after 11 hours.
Harvesting and Purification of BPUL
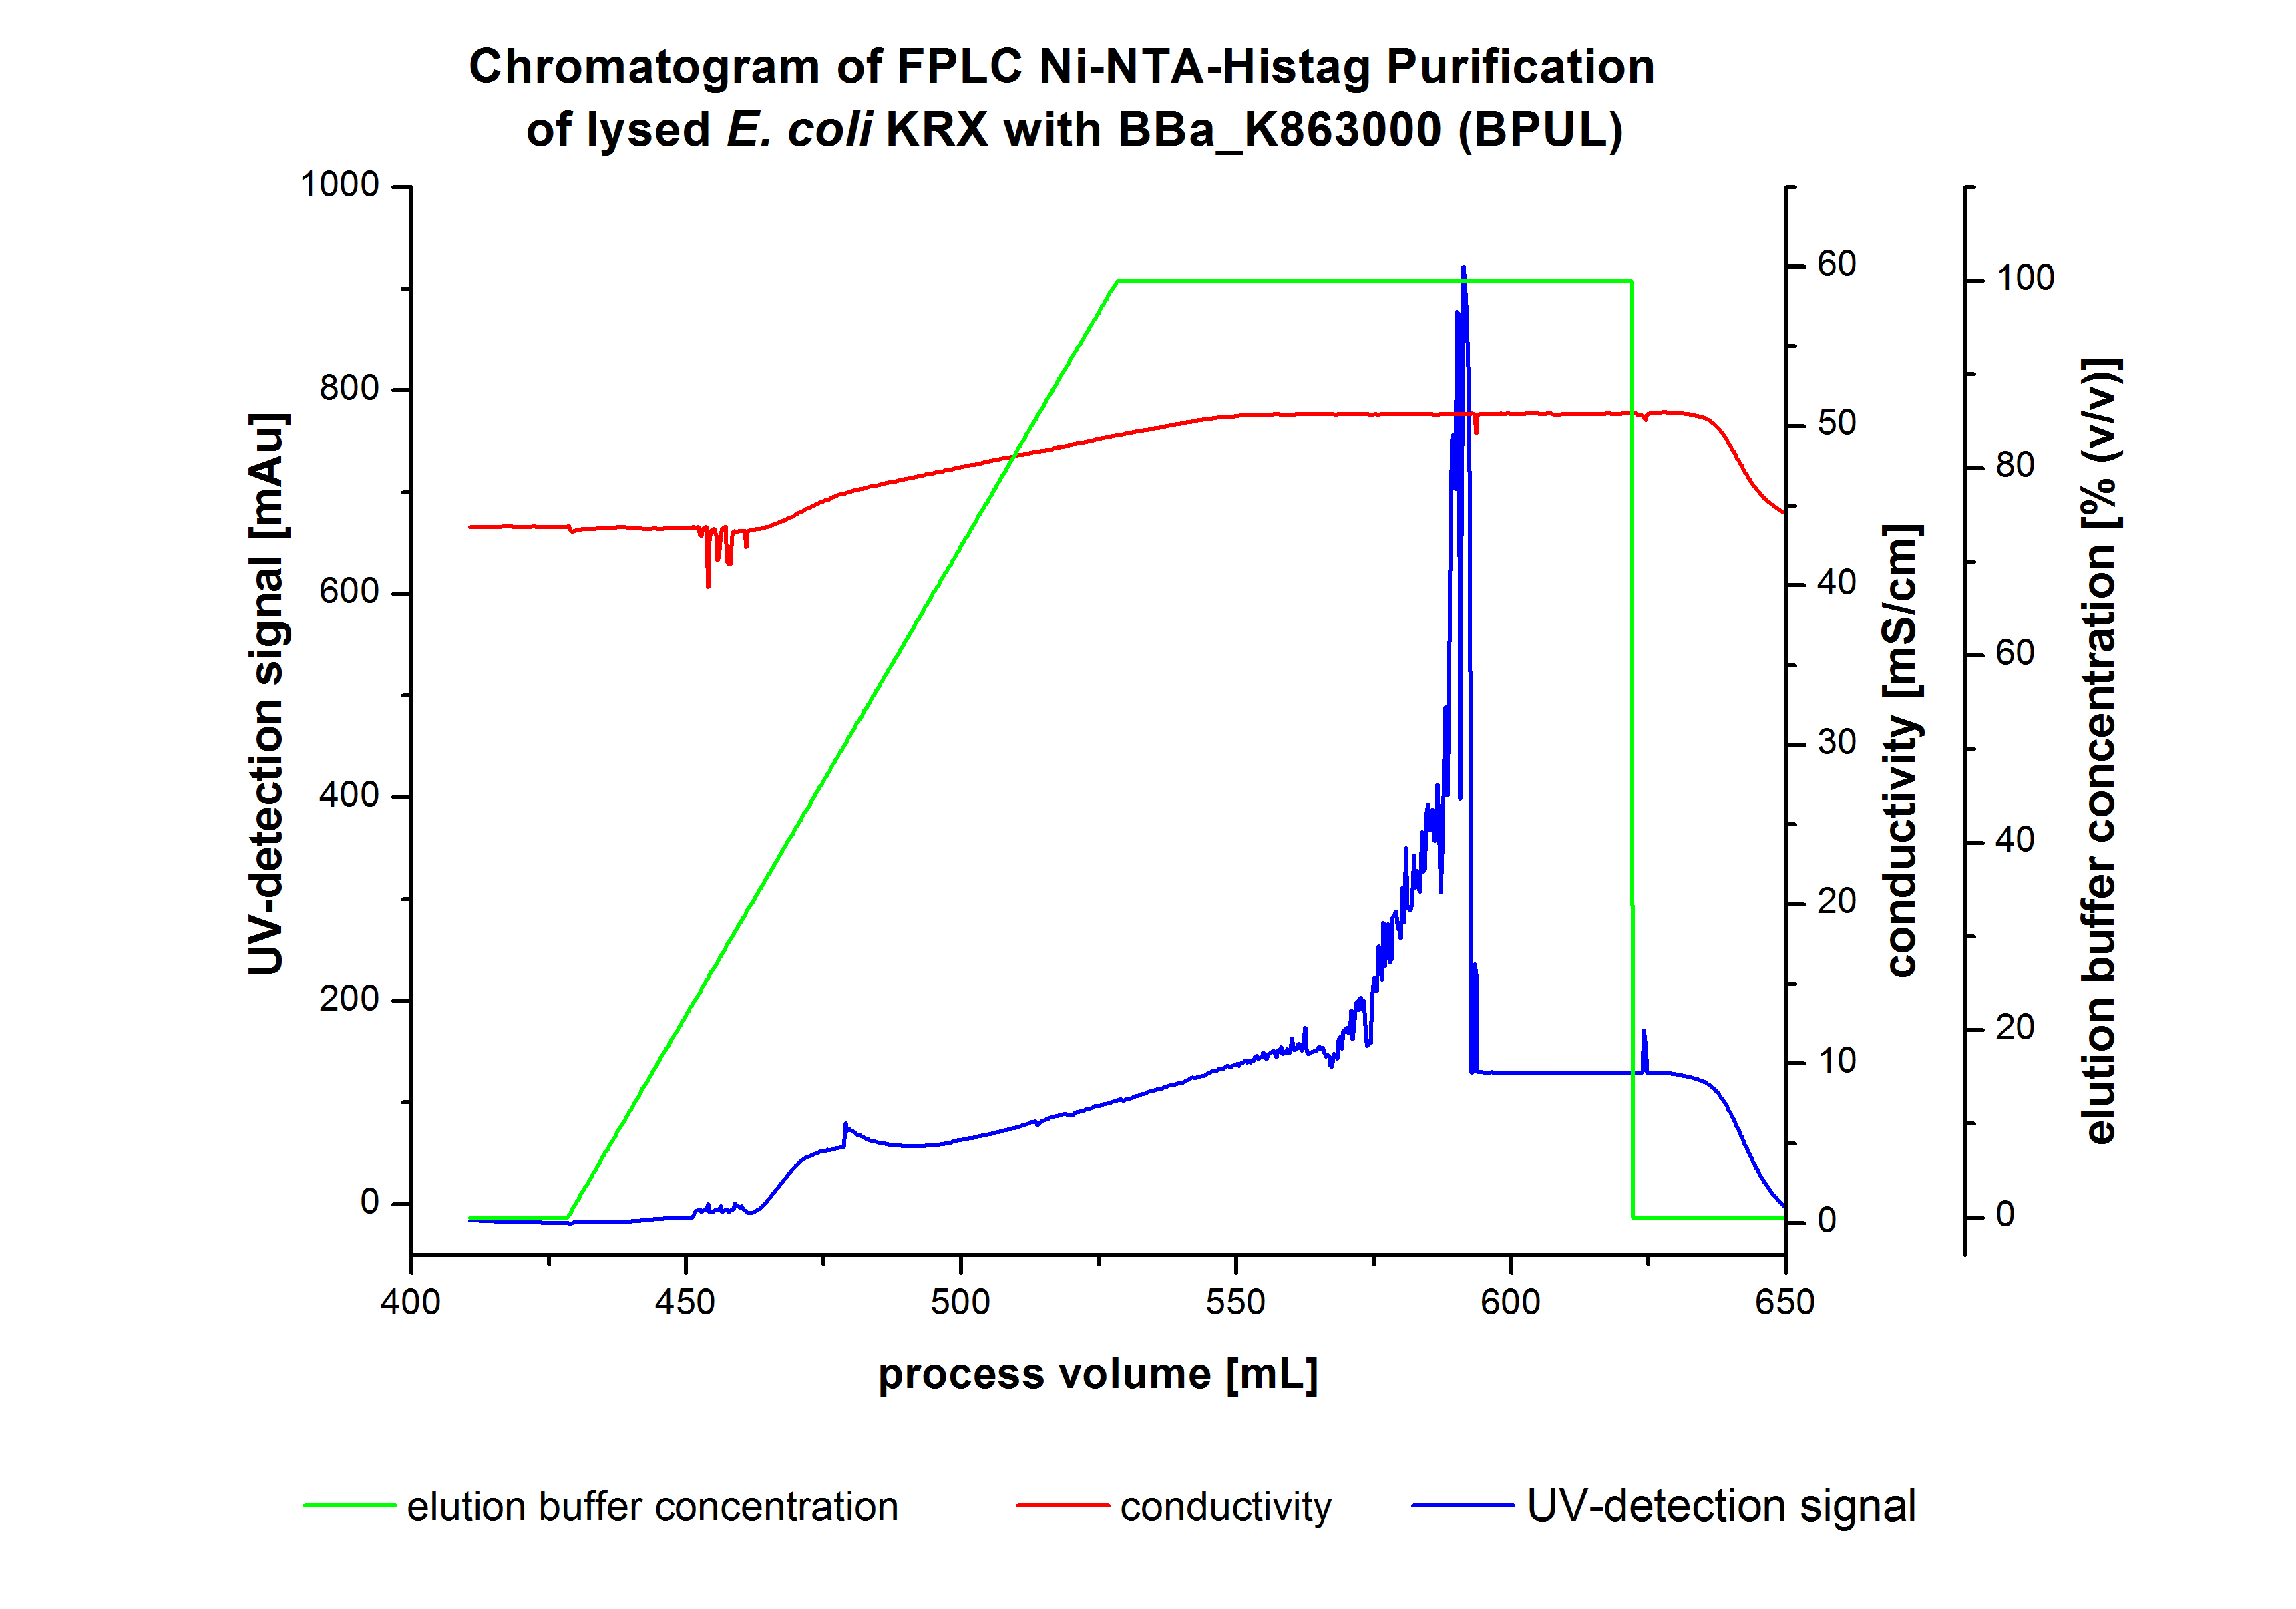
The harvested cells were resuspended in Ni-NTA-euquilibrationbuffer, mechanically lysed by homogenization and centrifuged. The supernatant of the lysed cell paste was loaded on the Ni-NTA-column (15 ml Ni-NTA resin) with a flowrate of 1 mL min-1 cm-2. After loading the supernatant on the column, the column was washed by 10 column volumes (CV) with equilibrationbuffer.The bounded Protein's were eluted by an increasing elutionbuffer gradient from 0% to 100% with a length of 200 mL and the elution was collected in 10 mL Fraction. The chromatogramm of the BPUL-elution is shown in the following graph:
At the bginning of the elution the chromatogramm shows a remarkable widespread peak at the begining of the elution. This peak can be explained by the elution of bounded proteins at the weak imidazol concentration. The corresponding fractions were analysed by SDS-PAGE. Afterwads there is an upwards trend of the UV-signal. This trend is caused by the increasing Imidazol concentration during the Eltution gradient. Towards the end of the elution procedure there are different and strong peaks detectable. These peaks results from a problem with the tube between the conductivity sensor and the UV-detector. During the elution the connector of the tube has become detached in front of the UV-detector. The Connection were not screwed corretly which leaded to a lost of volume of the corresponding fractions and most probably the measured peaks caused by air bubbles. Just to be on the safe side, the corresponding fractions were analysed by SDS-PAGE analysis. The results of the SDS-PAGE are shown in the following pictures.
- !!SDS-Page!!
Another scale-up of the fermentation of E. coli KRX with <partinfo>BBa_K863000</partinfo> was made up to a final working volume of 6 L in Bioengineering NFL22. Agitation speed, pO2 and OD600 were determined and illustrated in Figure 3. There was no noticeable lag phase and the cells immediatly began to grow. Agitation speed was increased up to 425 rpm after one hour due to control problems. Then the pO2 sank until a cultivation time of 4,75 hours, when the deceleration phase started. Then it increased again. There is no visible break through induction of protein expression. A maximal OD600 of 3,68 was reached after 7/8 hours of cultivation, which is similar to the 3 L fermentation (OD600 = 3,58 after 10 hours, time shift due to long lag phase). The cells were harvested after 12 hours.
- !!SDS-Page!!
ECOL - Laccase from Escherichia coli BL21 (DE3)
Fermentation E. coli KRX with <partinfo>BBa_K863005</partinfo>
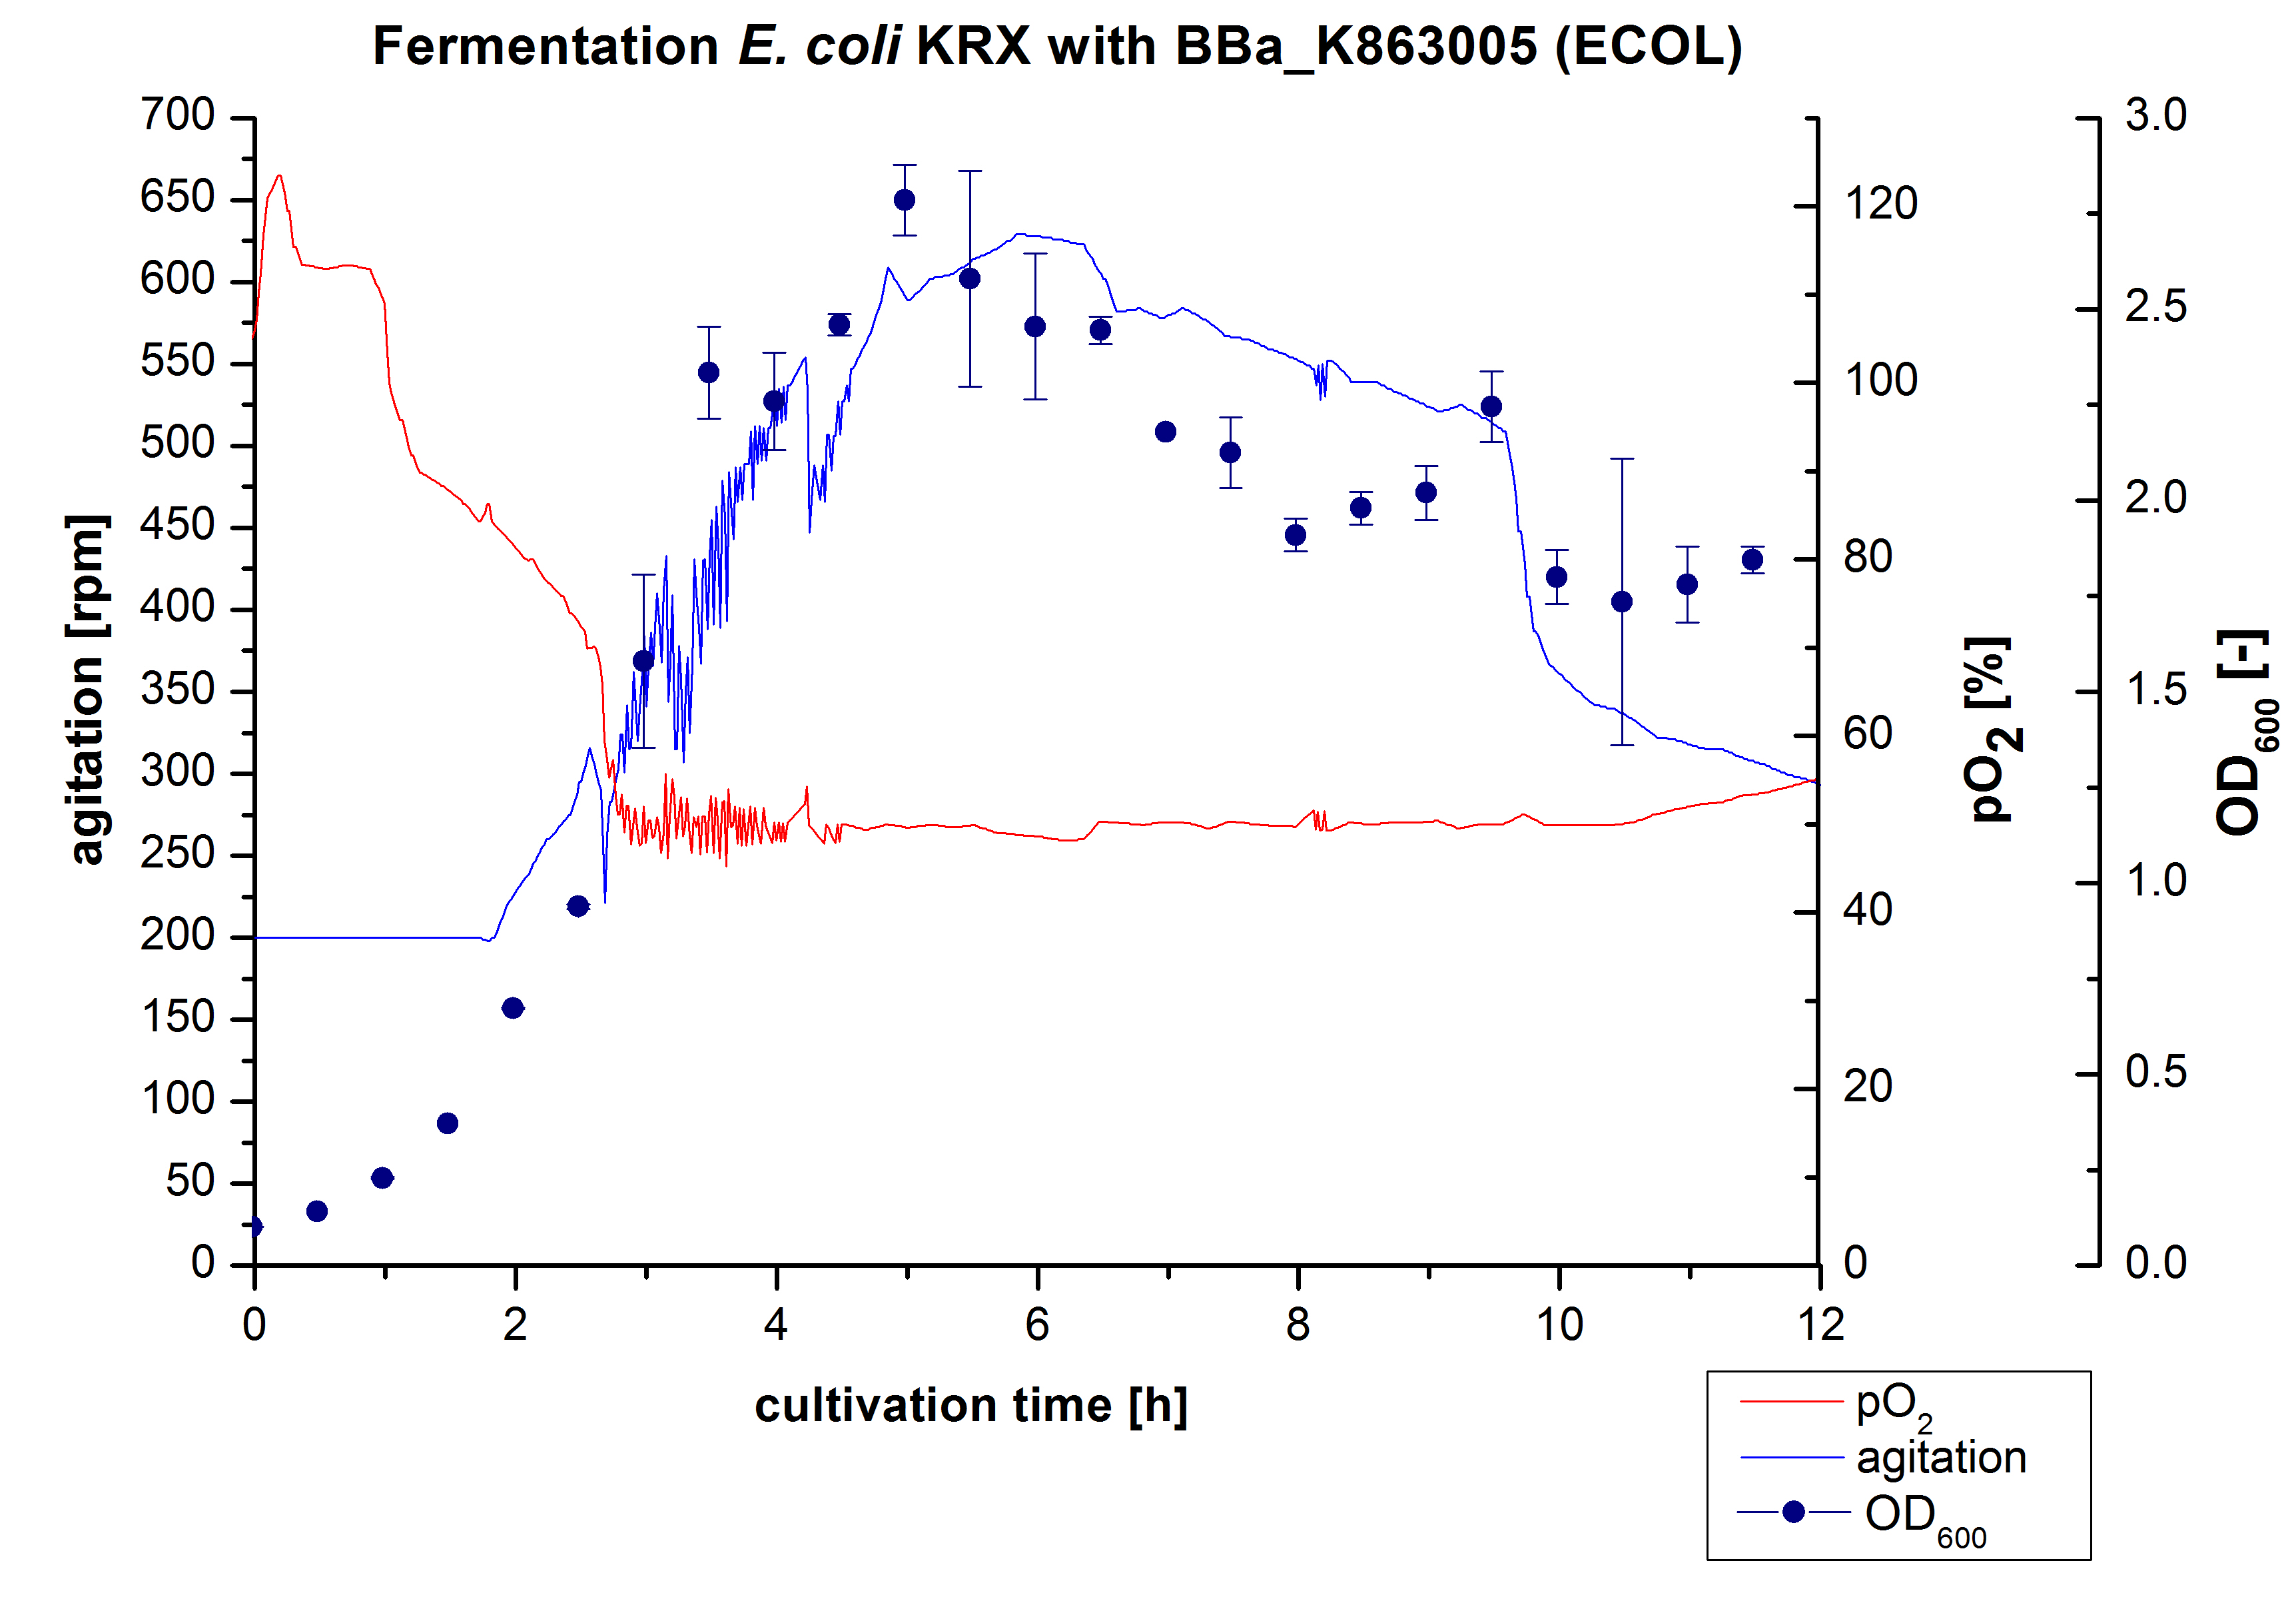
After the measurement of activity of ECOL we made a scale-up and fermented E. coli KRX with <partinfo>BBa_K863005</partinfo> in Infors Labfors with a total volume of 3 L. Agitation speed, pO2 and OD600 were determined and illustrated in Figure 1. The exponential phase started after 1,5 hours of cultivation. The cell growth caused a decrease in pO2. After 2 hours of cultivation the agitation speed increased up to 629 rmp (5,9 hours) to hold the minimal pO2 level of 50 %. After 4 hours there was a break in cell growth due to induction of protein expression. The maximal OD600 of 2,78 was reached after 5 hours. In comparison to E. coli KRX (OD600,max =4,86 after 8,5 hours) and to E. coli KRX with <partinfo>BBa_K863000</partinfo> (OD600,max =3,53 after 10 hours, time shift due to long lag phase) the OD600,max is 22 % or rather 43 % lower. In the following hours the cells began to die because of the celltoxicity of ECOL (reference: DBU final report) , therefore they were harvested after 12 hours.
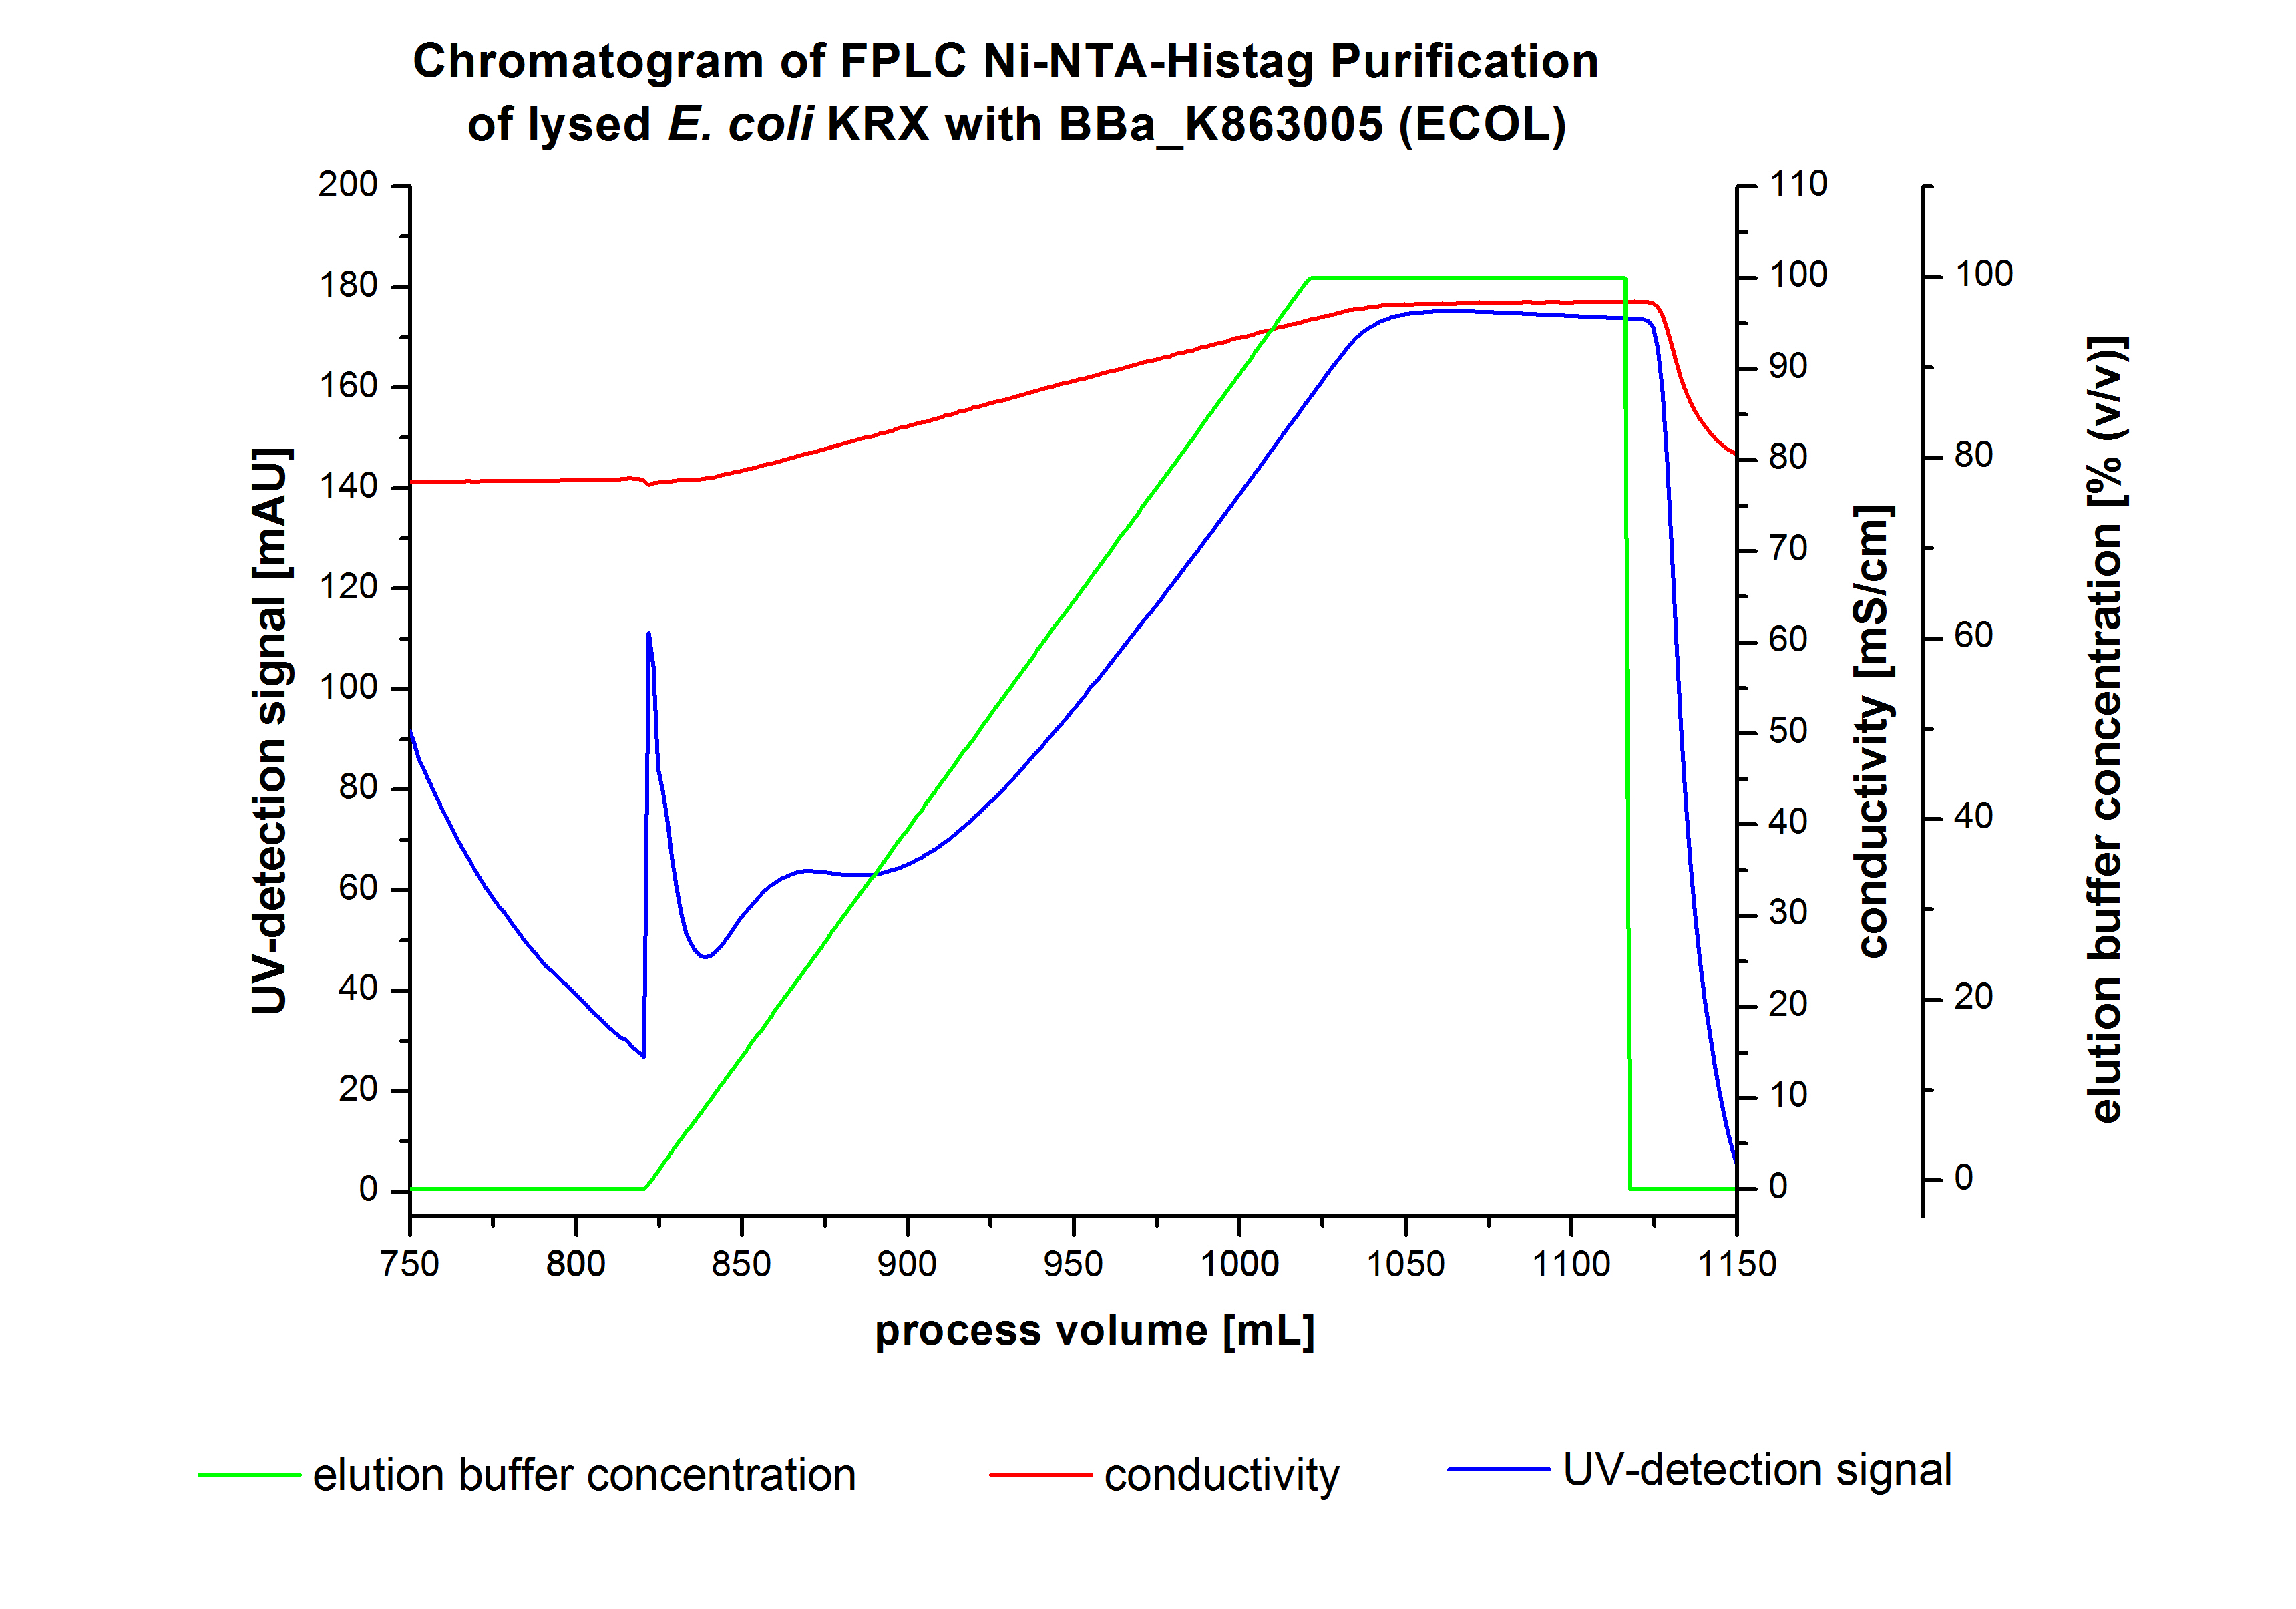
Purification of ECOL
- !!SDS-Page!!
Fermentation E. coli KRX with <partinfo>BBa_K863005</partinfo>
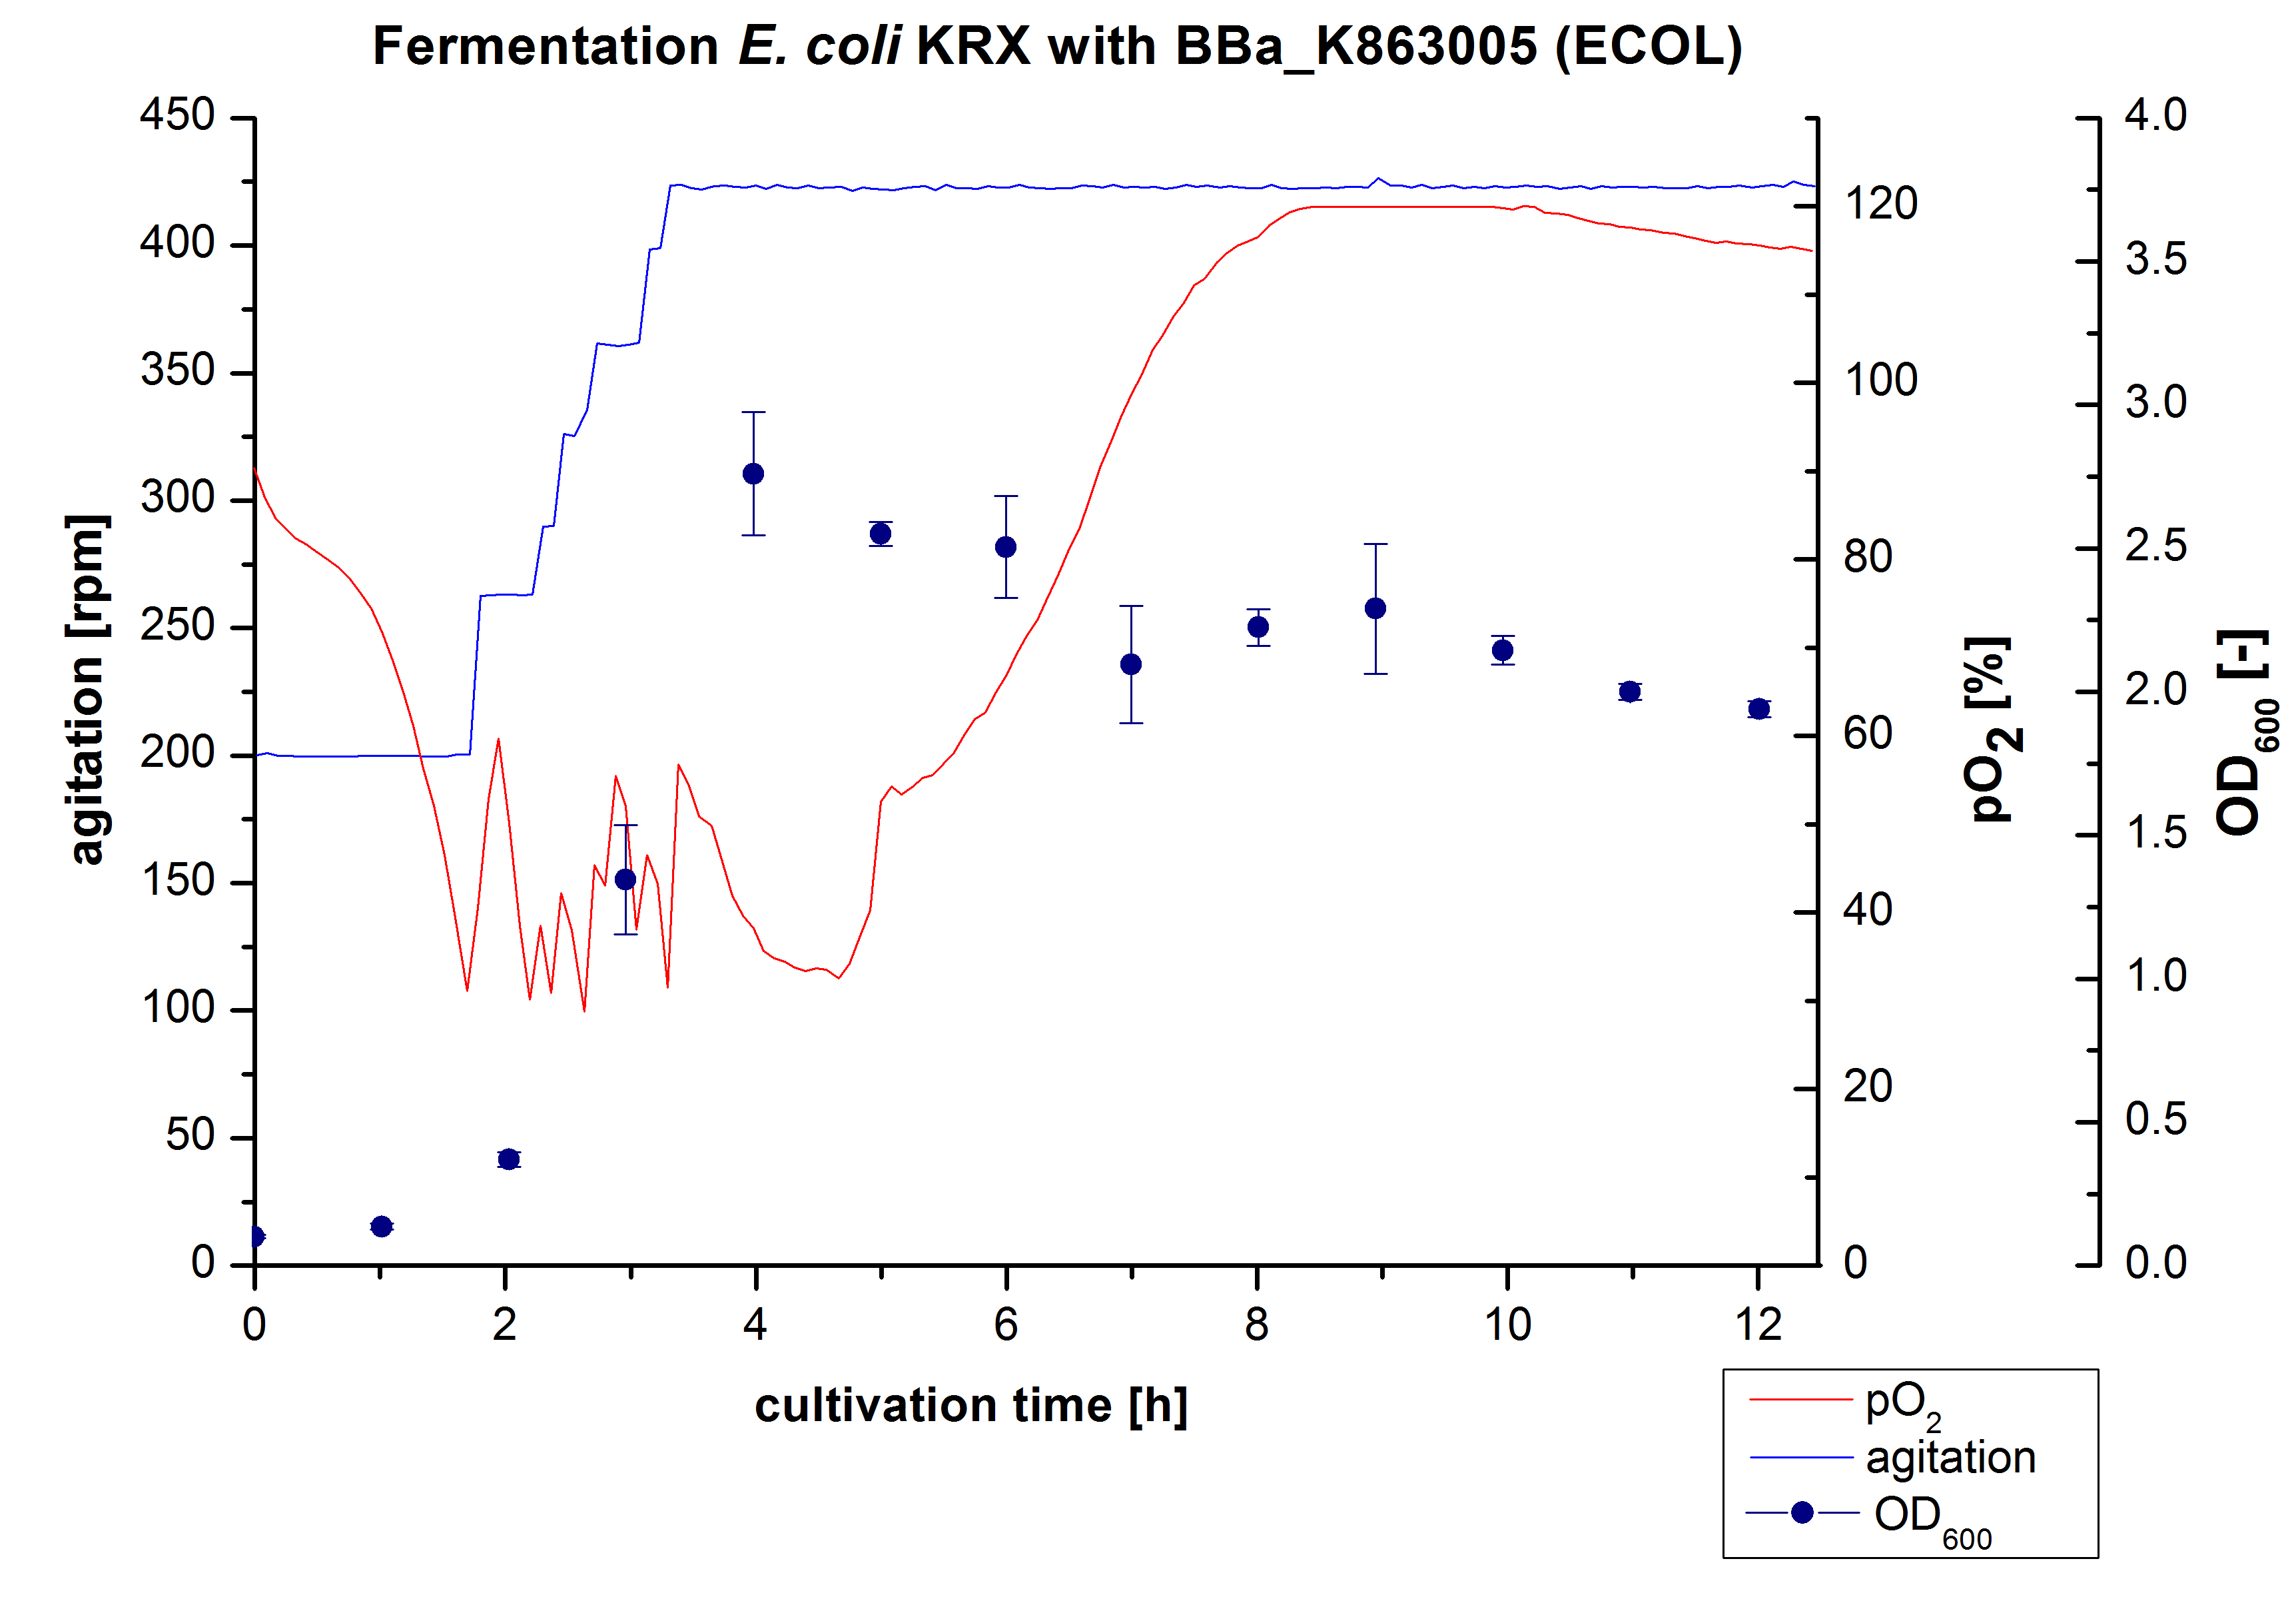
Another scale-up of the fermentation of E. coli KRX with <partinfo>BBa_K863005</partinfo> was made up to a final working volume of 6 L in Bioengineering NFL22. Agitation speed, pO2 and OD600 were determined and illustrated in Figure 3. There was no noticeable lag phase and the cells immediatly began to grow. The cells were in an exponential phase between 2 and 4 hours of cultivation, which results in an decrease of pO2 value and therefore in an increase of agitation speed. After 4 hours of cultivation the maximal OD600 of 2,76, which is comparable to the 3 L fermentation of E. coli KRX with <partinfo>BBa_K863005</partinfo>. Due to induction of protein expression there is a break in cell growth then and the cells began to die. This demonstrates the cytotoxity of the laccases for E. coli, which was reportet by the DBU. In comparison to the fermentation of E. coli KRX with <partinfo>BBa_K863000</partinfo> under the same conditions (OD600,max= 3,53), the OD600,max was 22 %. Cells were harvested after 12 hours.
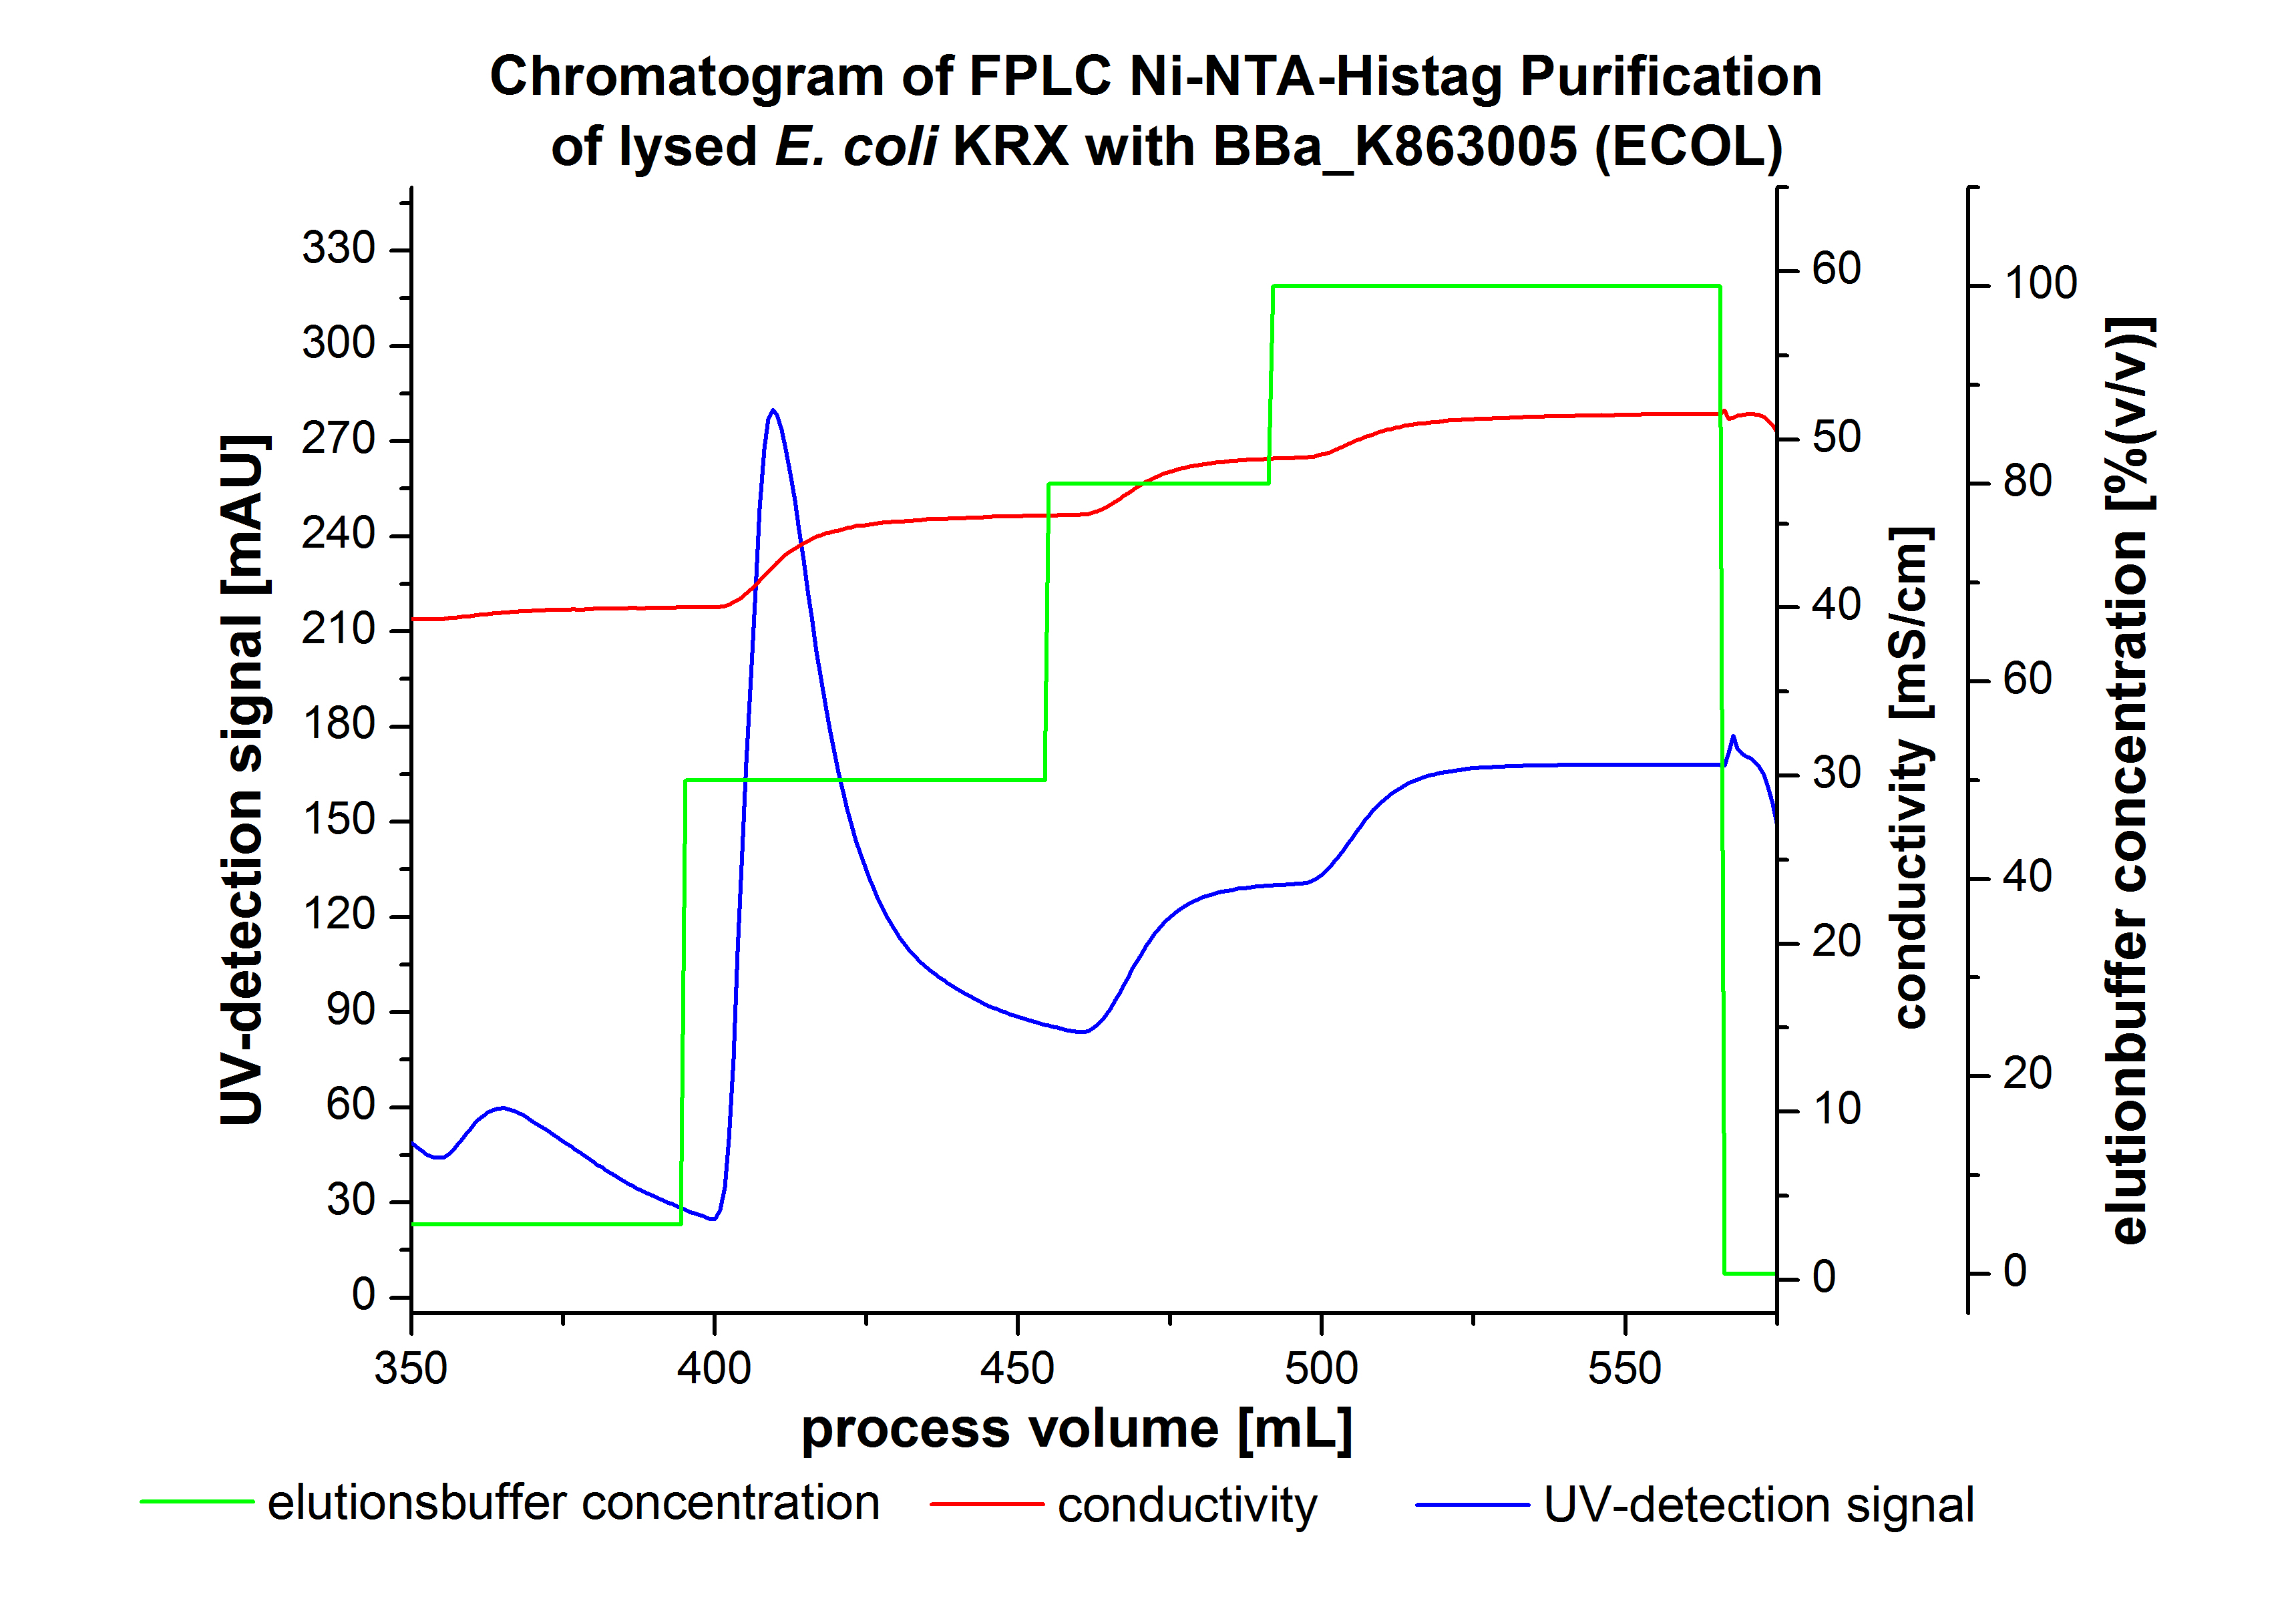
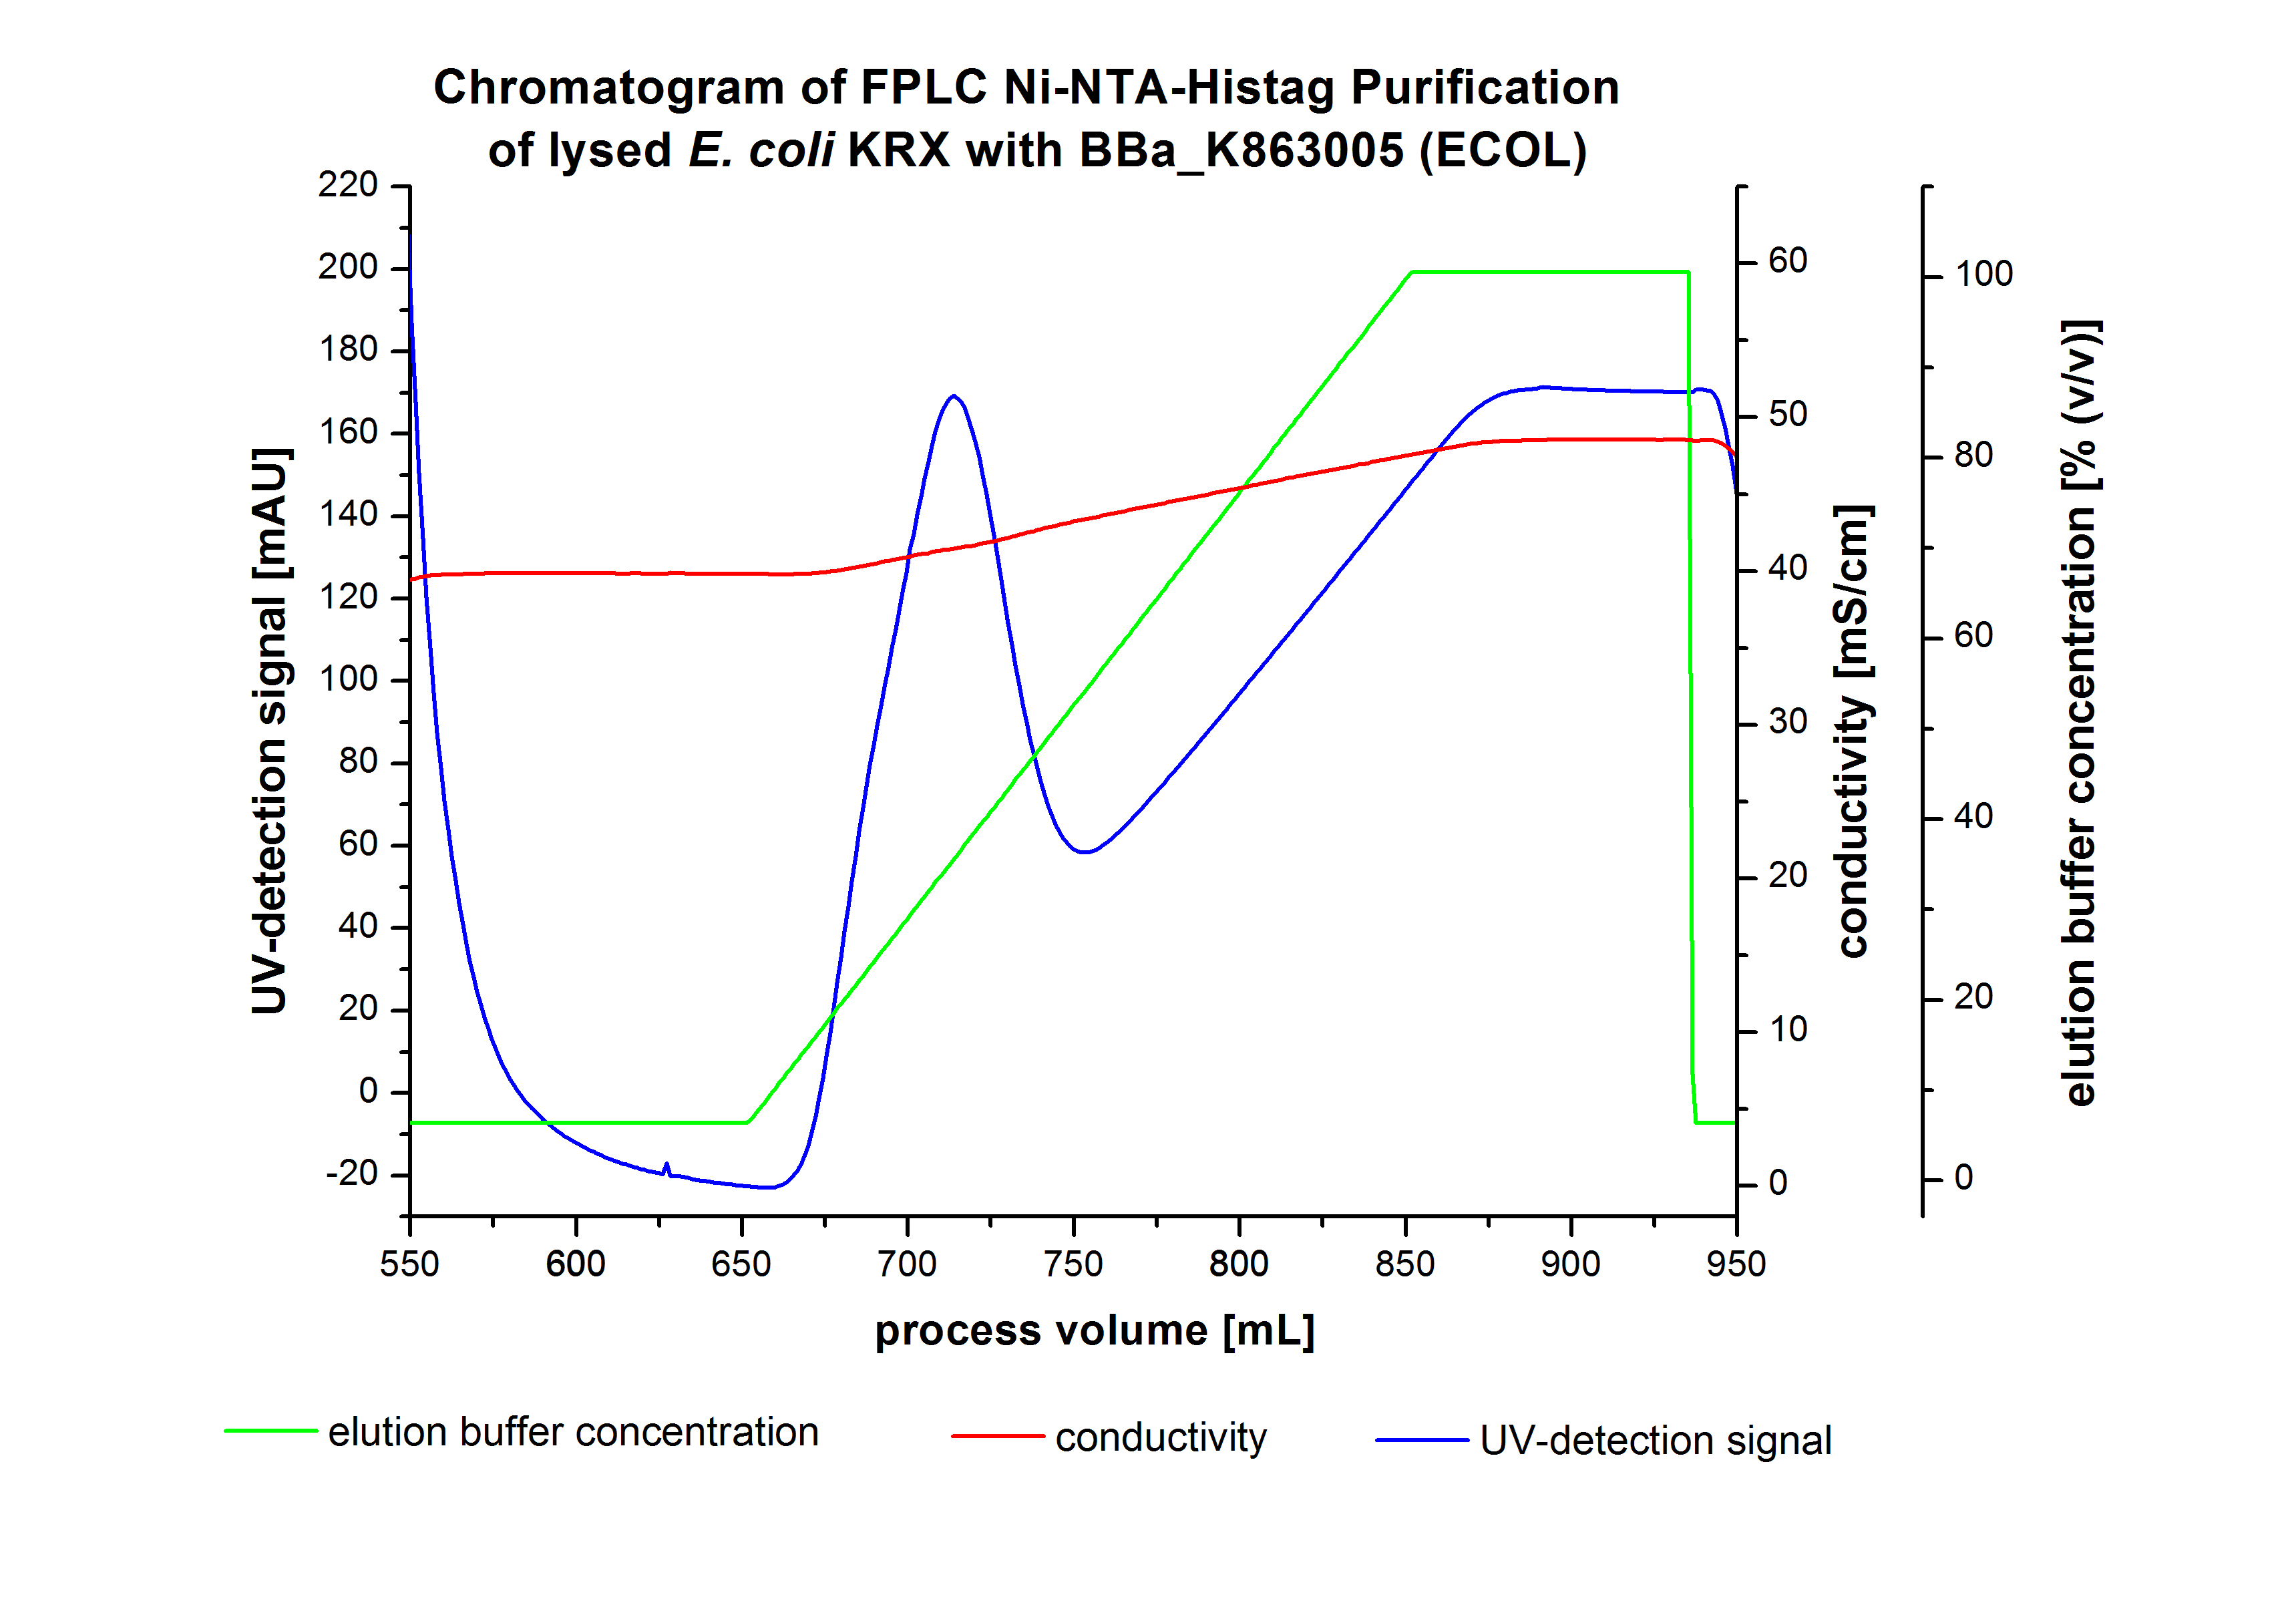
Purification of ECOL
- !!SDS-Page!!
XCCL - Laccase from Xanthomonas campestris pv. campestris B100
BHAL - Laccase from Bacillus halodurans C-125
TTHL - Laccase from Thermus thermophilus HB27

- !!SDS-Page!!
PCIL - Laccase from Pycnoporus cinnabarinus
TVEL5 - Laccase from Trametes versicolor
TVEL10 - Laccase from Trametes versicolor
TVEL13 - Laccase from Trametes versicolor
TVEL20 - Laccase from Trametes versicolor
| 55px | | | | | | | | | | |
 "
"


