Team:Bielefeld-Germany/Results/immo
From 2012.igem.org

Contents |
First Approach
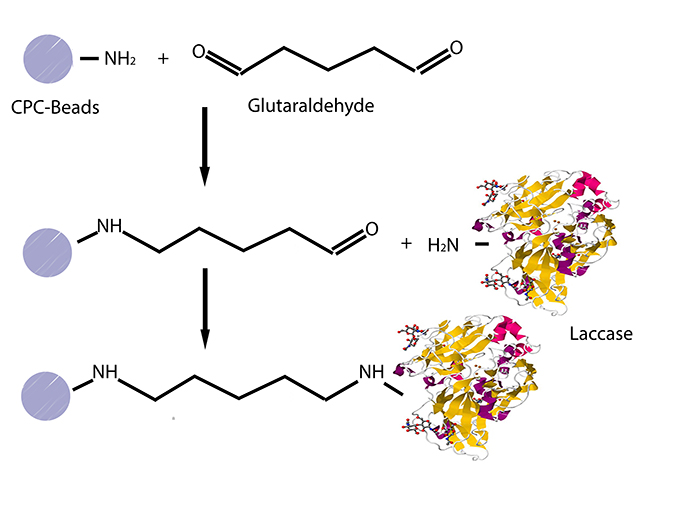
The initial step was to find out a convenient method of immobilization using commercially acquired laccases from Trametes versicolor (named TVEL0) as a standard. The first alternative was the use of silica dioxide beads from the lab. Different bead concentrations were used (ratio 1:500, 1:1000 and 1:1500) and different buffers (HBSS buffer, recrystallization buffer and Britton-Robinson buffer). However, no significant activity could be detected. Hence, it was agreed to try out CPC-(controlled pore carrier) silica beads, to which laccases covalently bind, especially that some papers provide protocols and activity tests which prove the efficiency of these beads (see Fig. 1).
Immobilization Strategy and Optimization of CPC-beads:
In order to identify the best conditions for TVEL0, different bead concentrations: 0.01, 0.02, 0.04, 0.06, and 0.08 g mL-1, as well as different incubation time periods: 18 h and 36 h were examined. Britton-Robinson buffer (pH 5) was used, since TVEL0 showed the highest activity in pH 5. The beads were first immersed in 2.5 % glutaraldehyde and incubated for two hours under light vacuum in order to allow as much beads’ surface area to be coated with aldehyde groups, which crosslink the laccases to the beads. After that, the beads were washed 3 times with Britton-Robinson Buffer and then immersed in 1mg mL-1 laccases from TVEL0 and placed on a rotator at 4 °C for 18 h and 36 h respectively. These time periods were selected according to different protocols describing this immobilization method. After incubation, the supernatants were gathered to be tested for laccase activity. The beads were then washed with Britton-Robinson Buffer, then with 0.5 M NaCl solution in order to wash away all noncovalently bound laccases and again twice with the same buffer. Subsequently, the beads were immersed in 2.5 mg -1 glycine for 18 h at 4 °C. Finally, the beads were rinsed again with Britton-Robinson Buffer, then with 0.5 M NaCl solution and again twice with the same buffer.
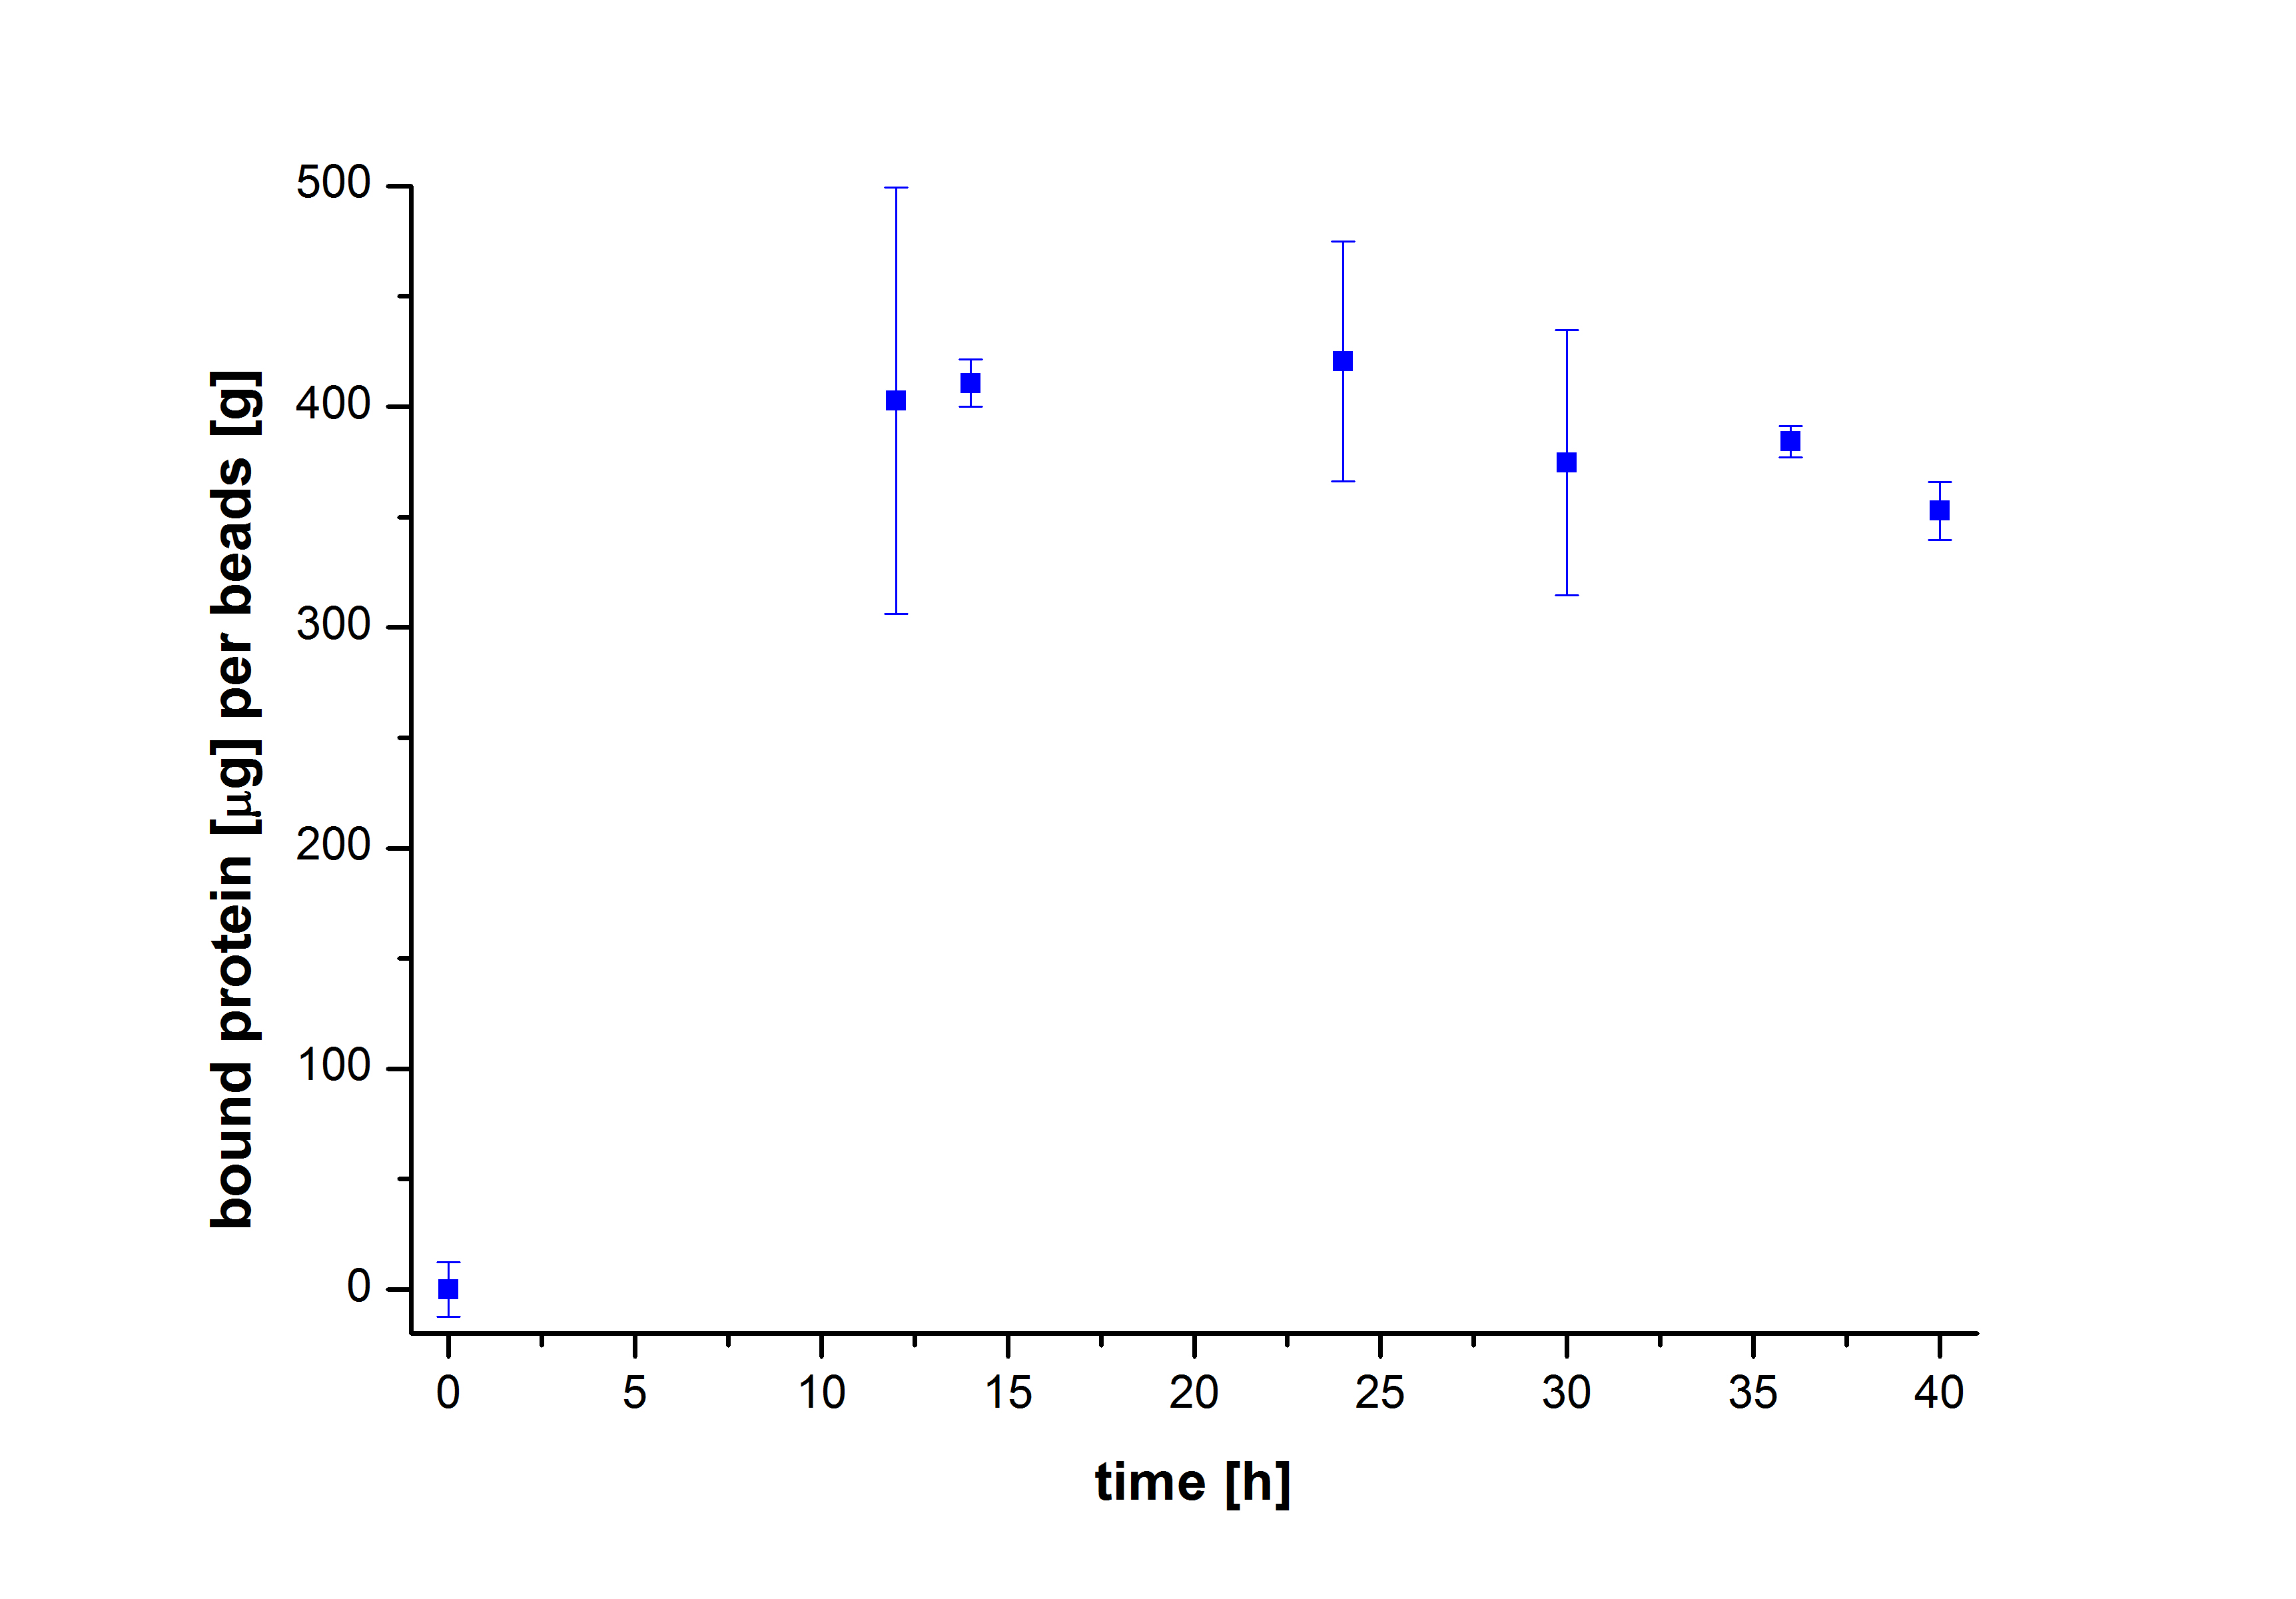
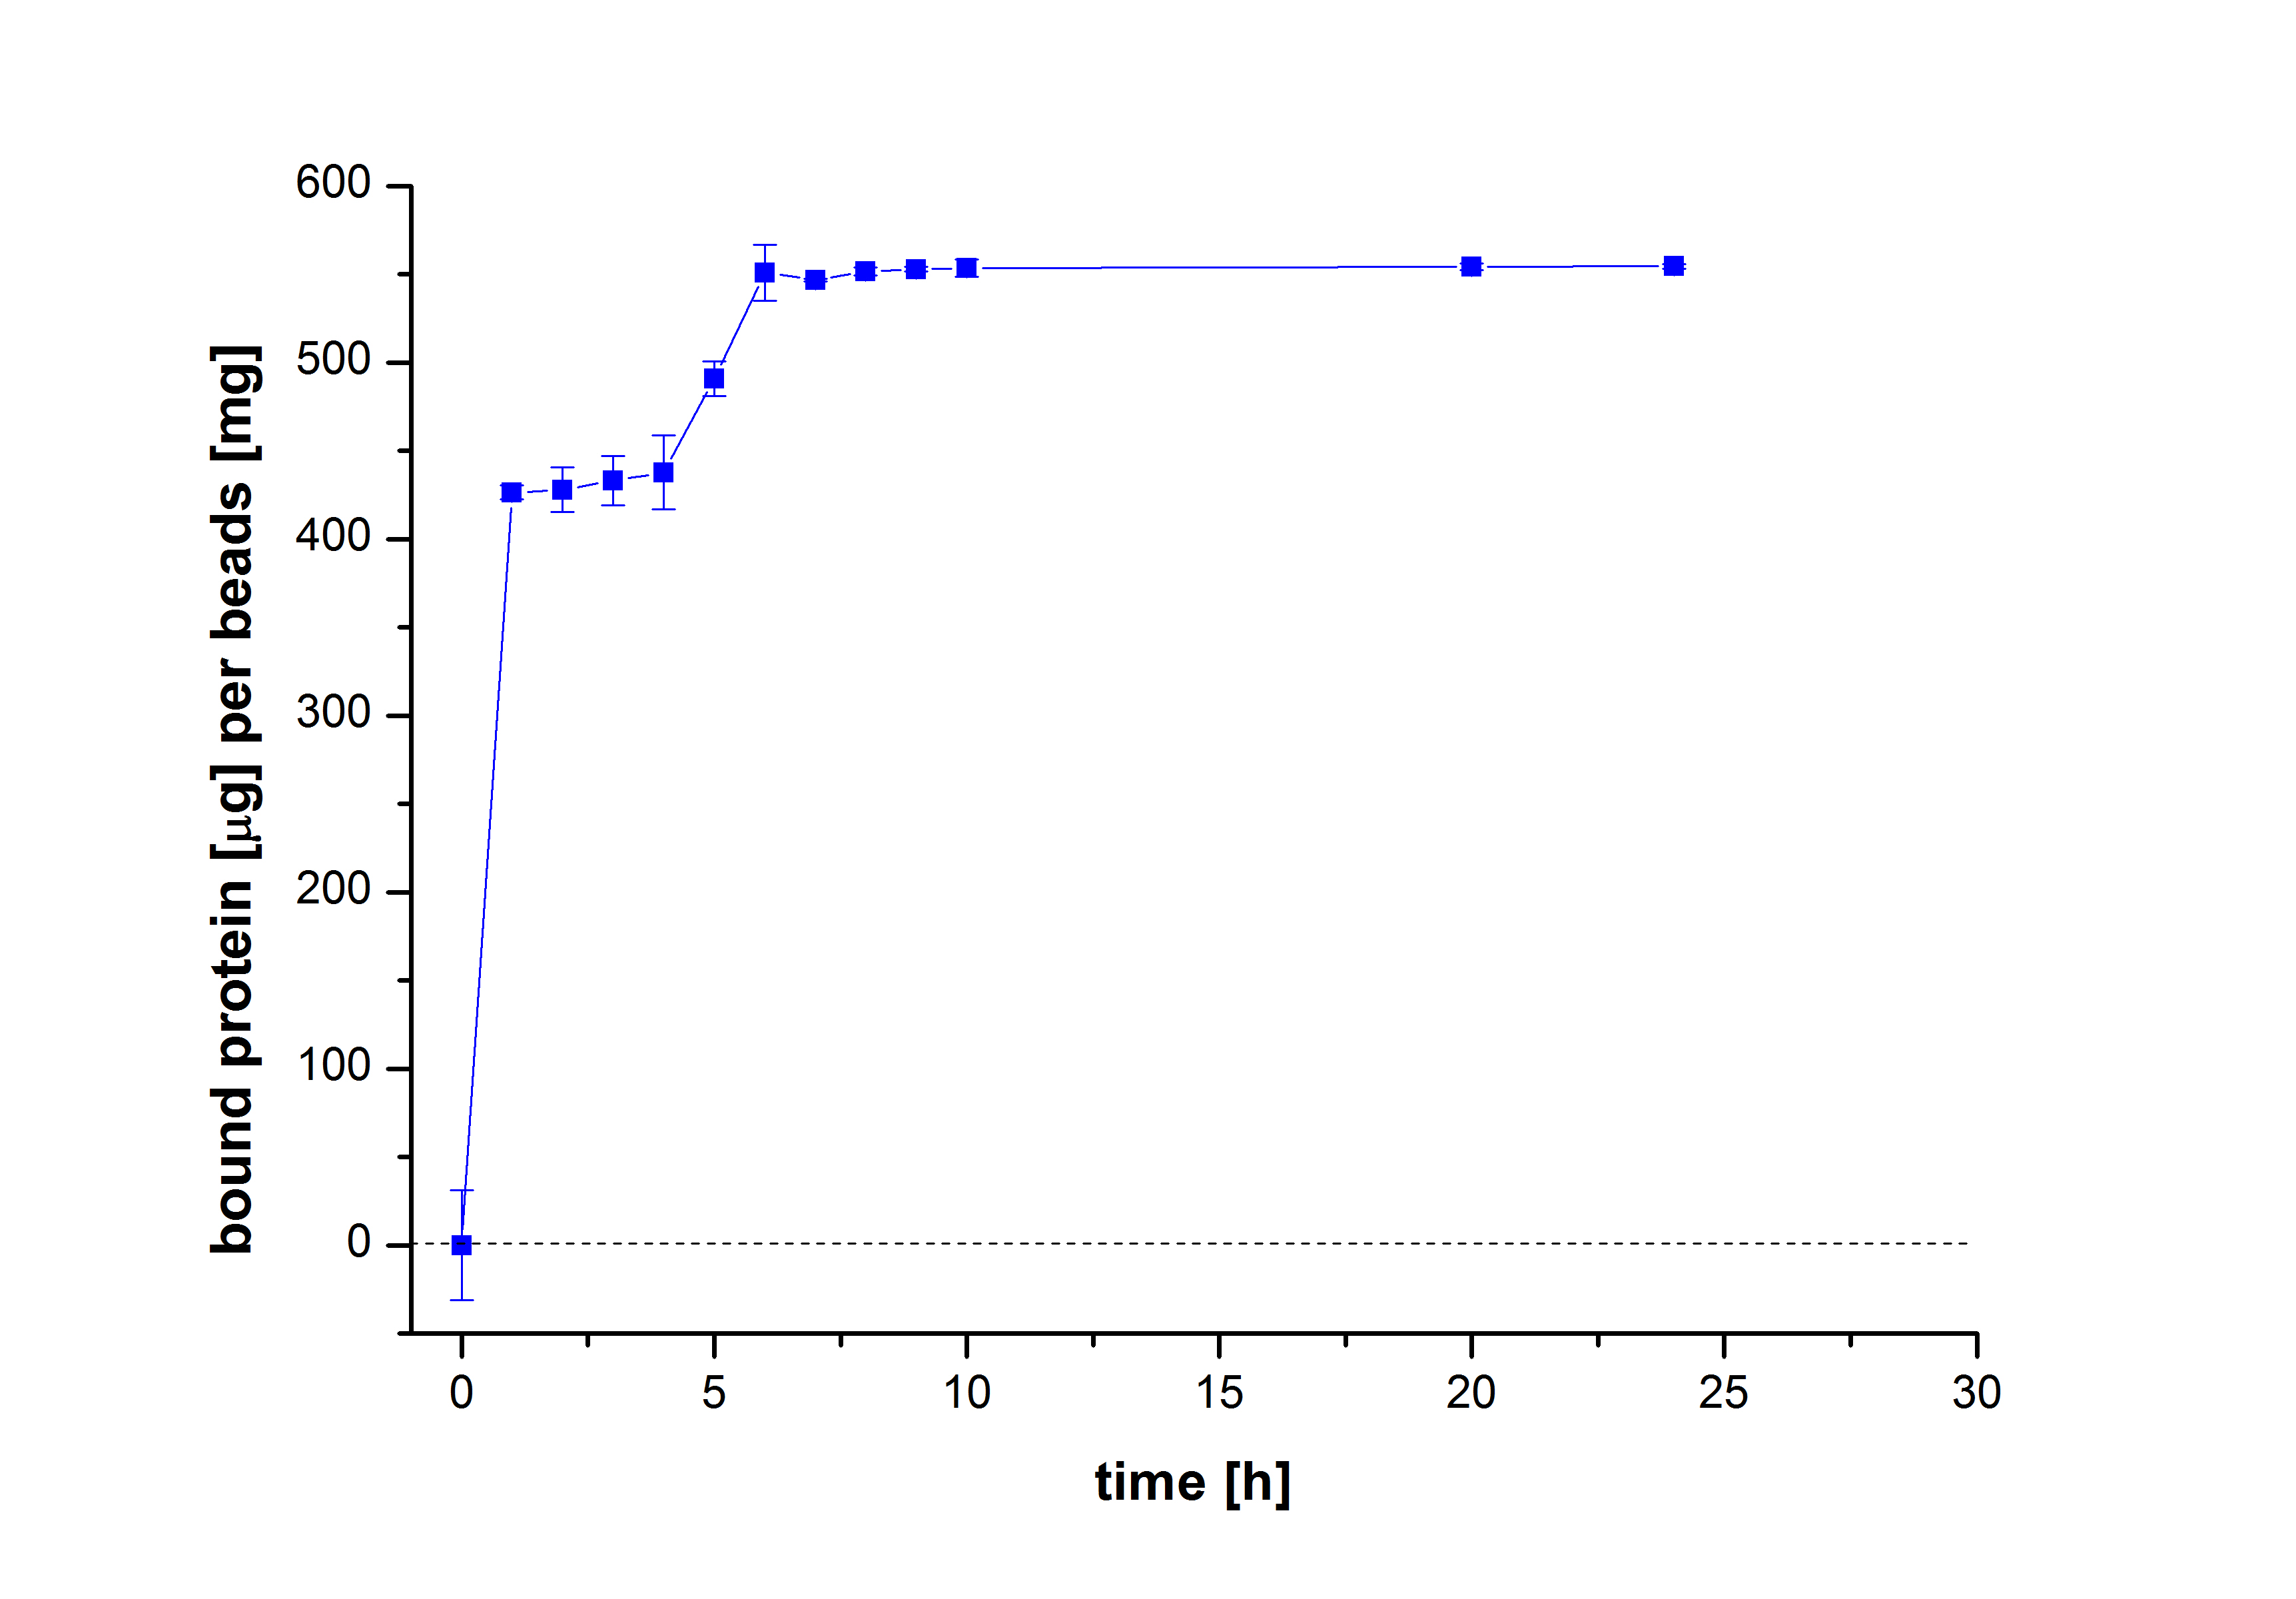
To figure out the amount of protein bound to the beads after several incubation periods of time, the protein concentration in the supernatant was measured using Roti®-Nanoquant. After comparing the results, it was noticeable that after 10 hours, the maximum amount of bound proteins to beads could be achieved (see Fig. 2). This remained relatively constant over the remaining incubation period, although an incubation time of at least 18 hours was recommended in all protocols. Therefore, another experiment was carried out to test the protein binding within the first 10 hours. The results showed that 6 hours were actually enough to reach a maximum binding (see Fig. 3).
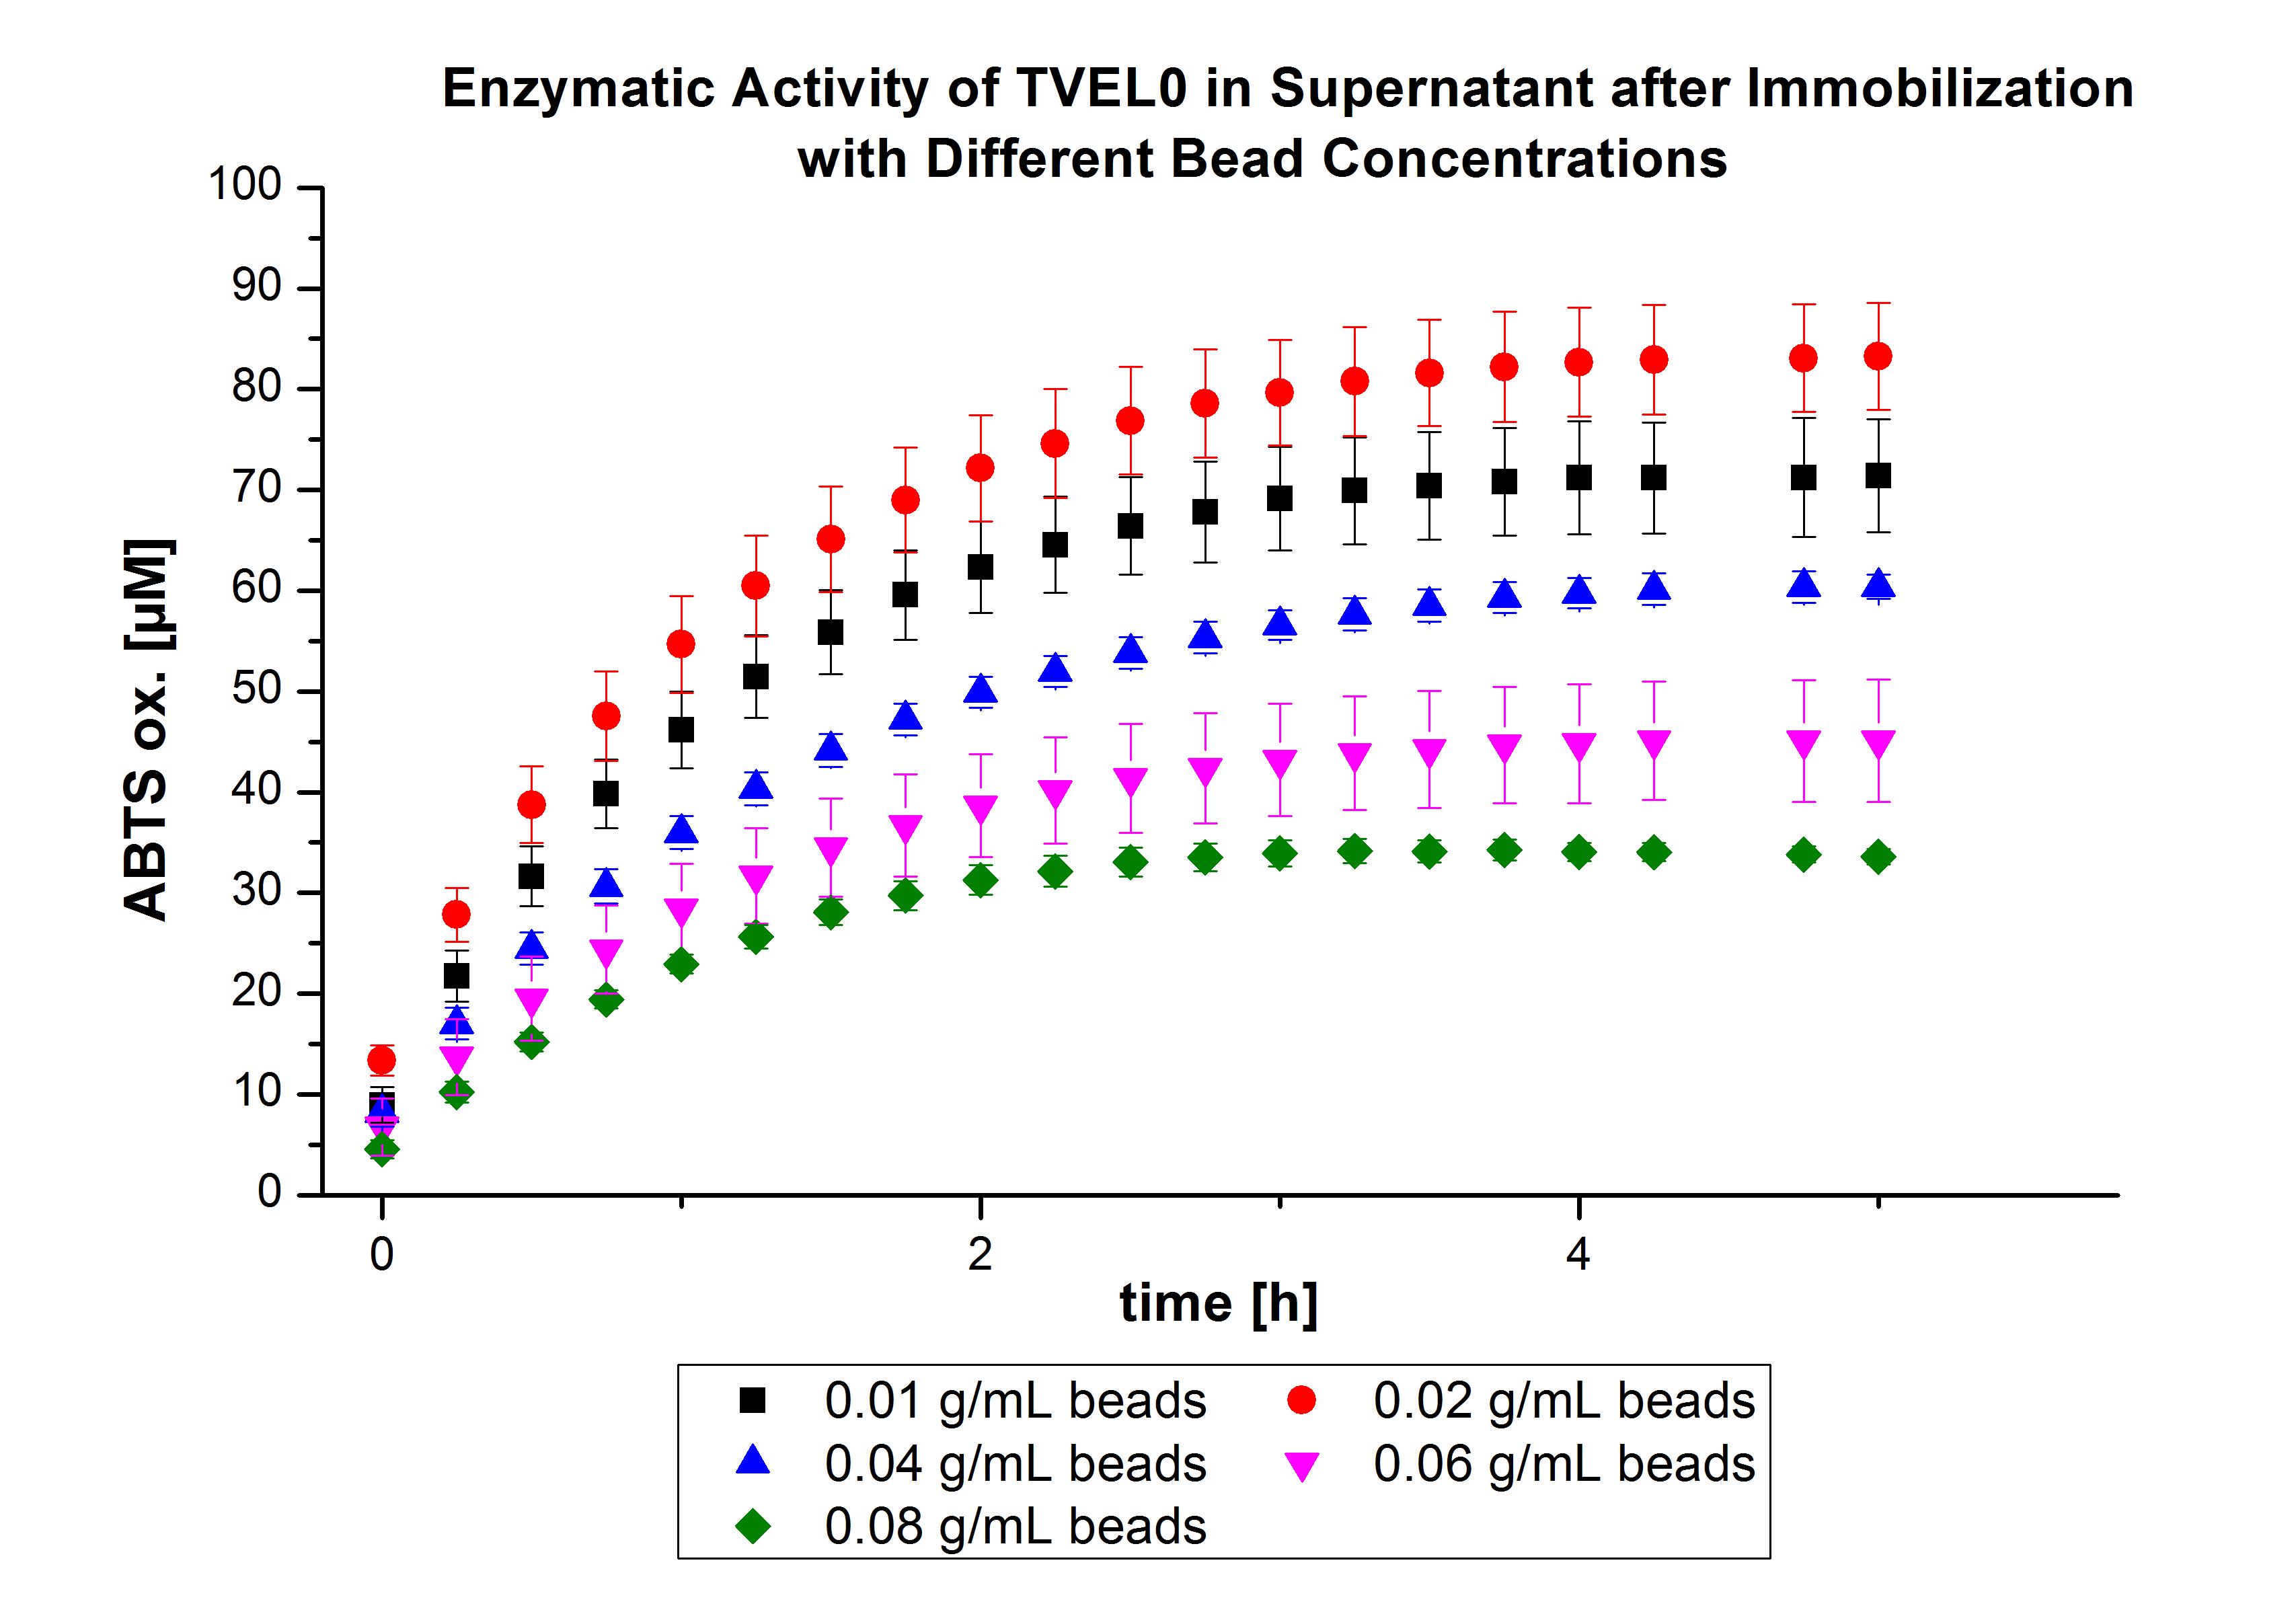
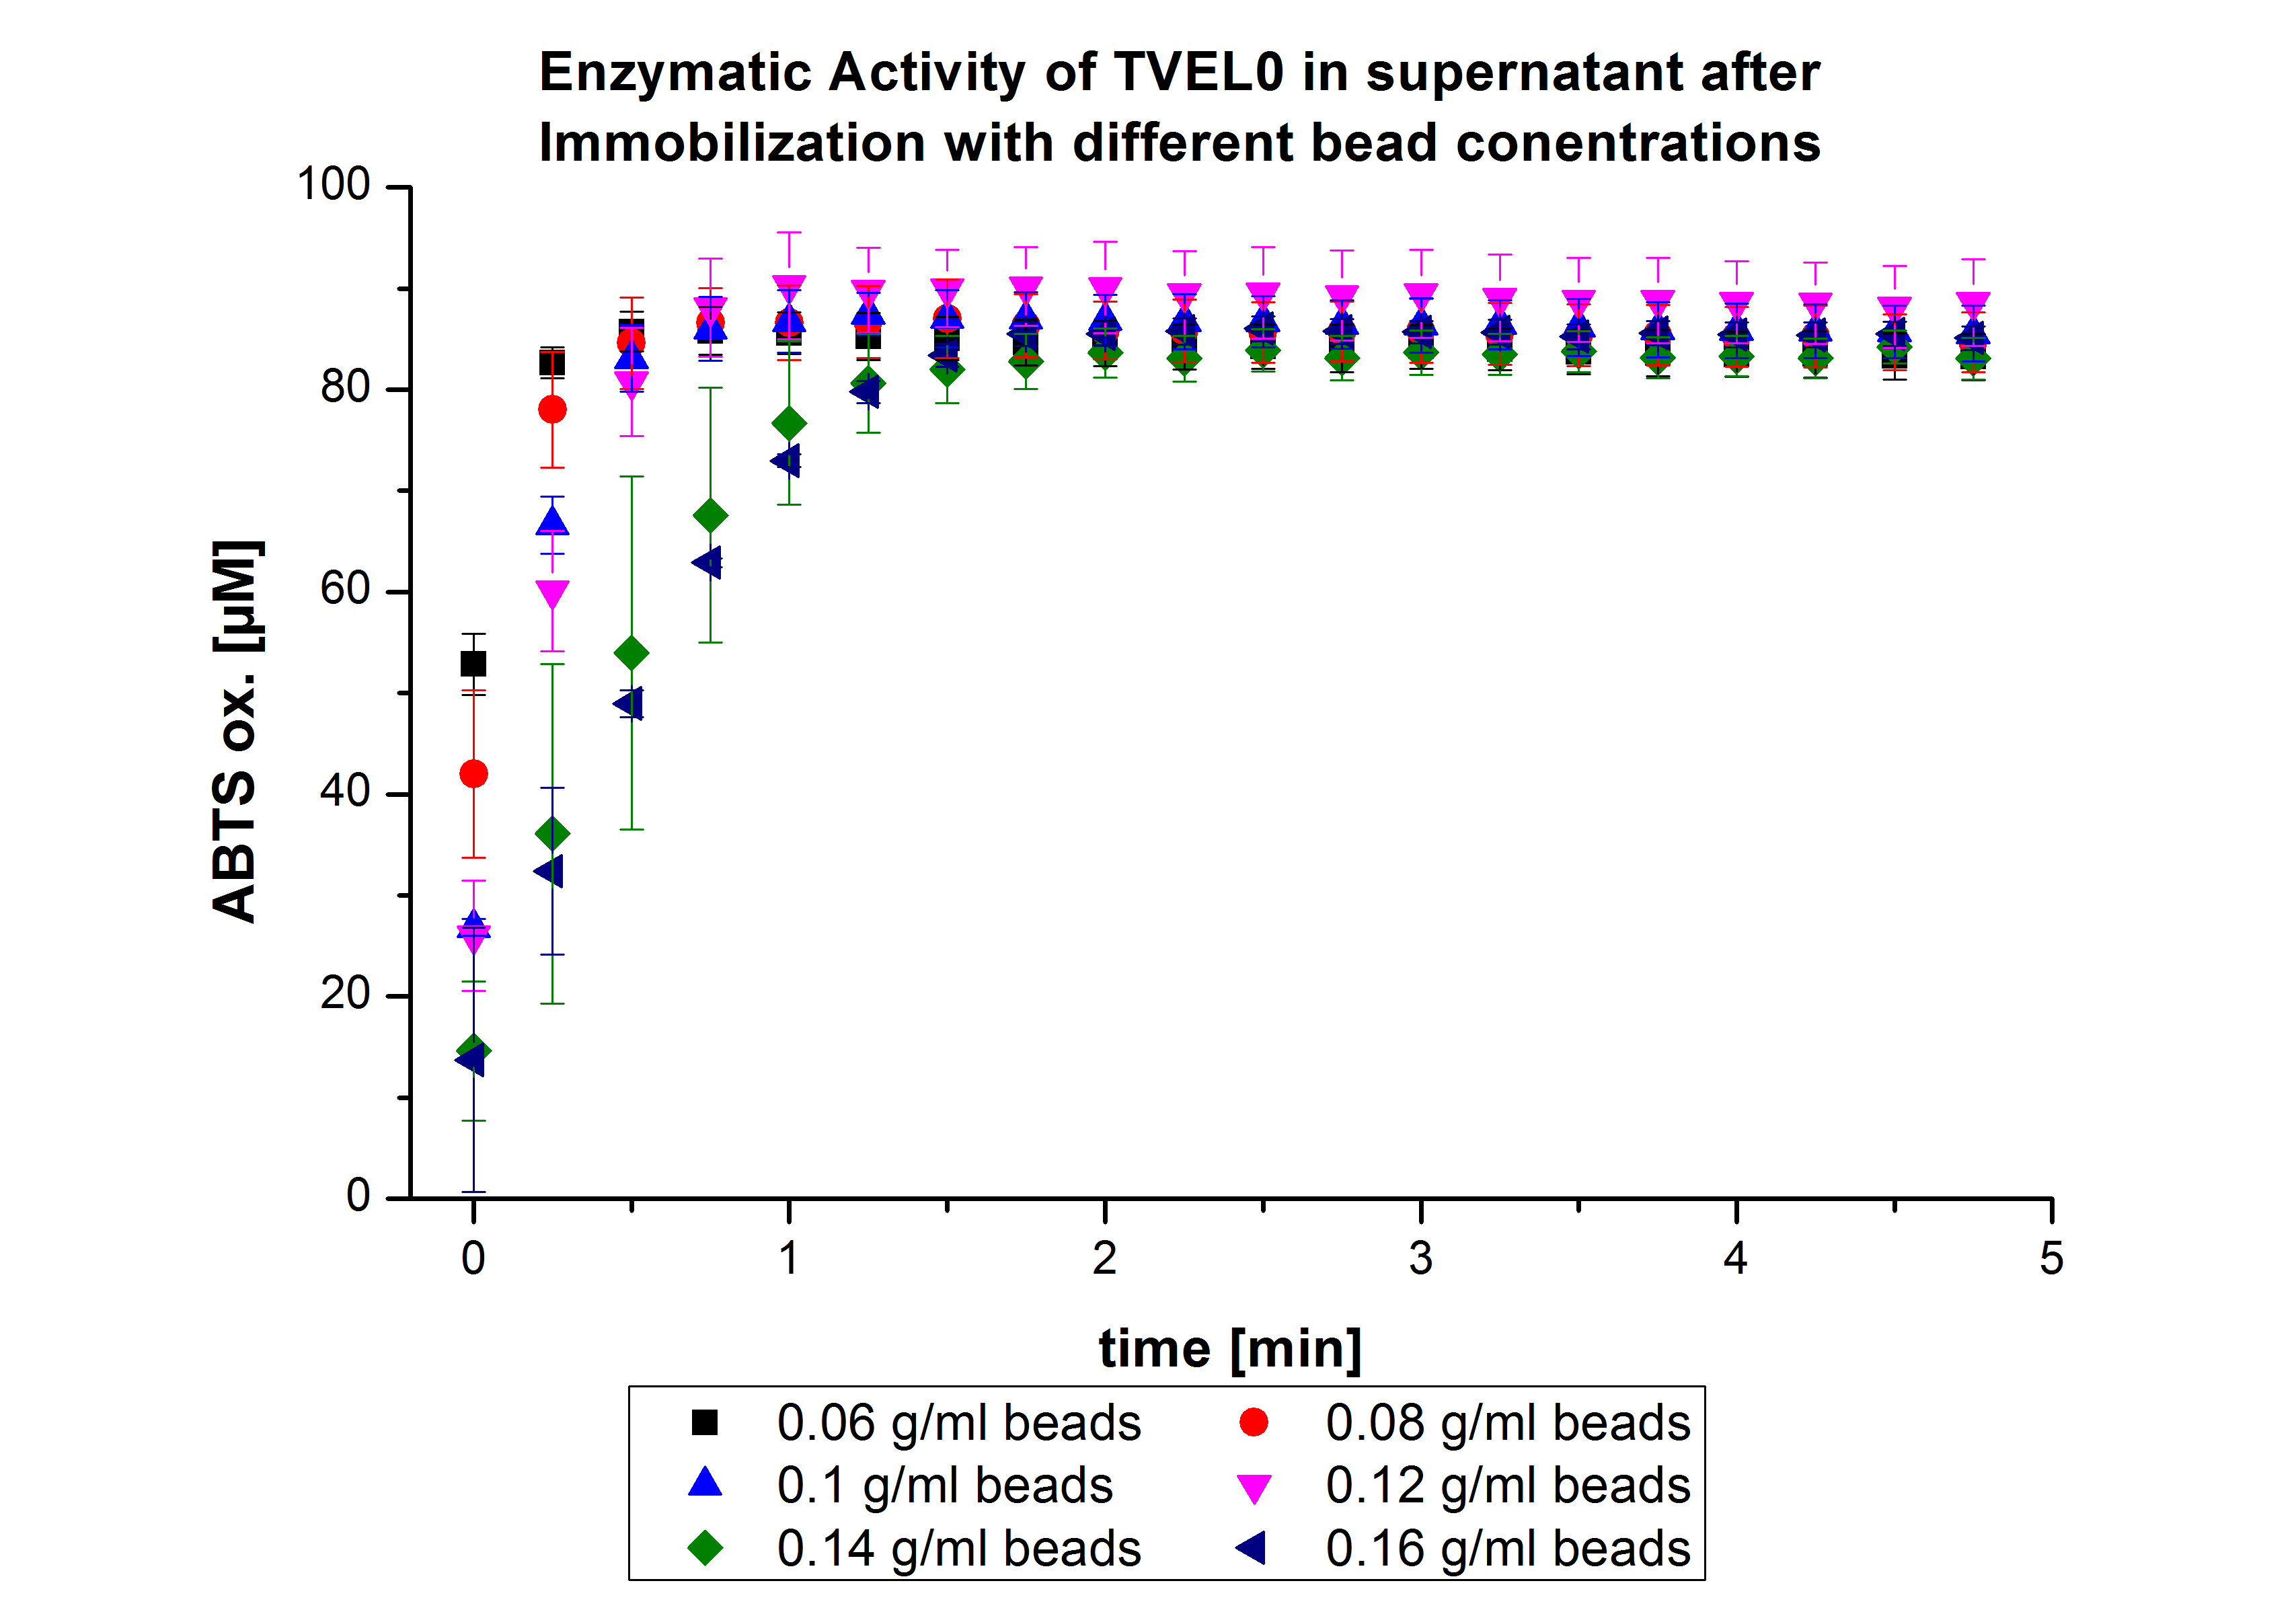
On the other hand, the activity of the nonbound laccases present in the supernatant was measured using ABTS as substrate to find out the most convenient bead concentration. According to the results, the activity decreased upon increasing the concentration of the beads without reaching a saturation level (see Fig. 4). Therefore, another experiment was carried out with higher bead concentrations. The same experiment was carried out with the following bead concentrations: 0.06, 0.08, 0.1, 0.12, 0.14 and 0.16 g mL-1. Based on the results of the previous experiment, the samples were incubated with 1 mg mL-1 TVEL0 for 36 h. The results showed no significant change in the laccase activity upon increasing the concentration of beads above 0.06 g ml-1 (see Fig. 5), a saturation level has been achieved.
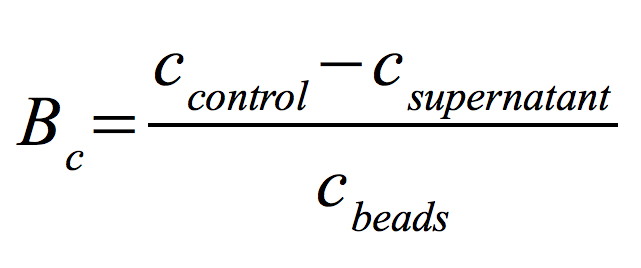
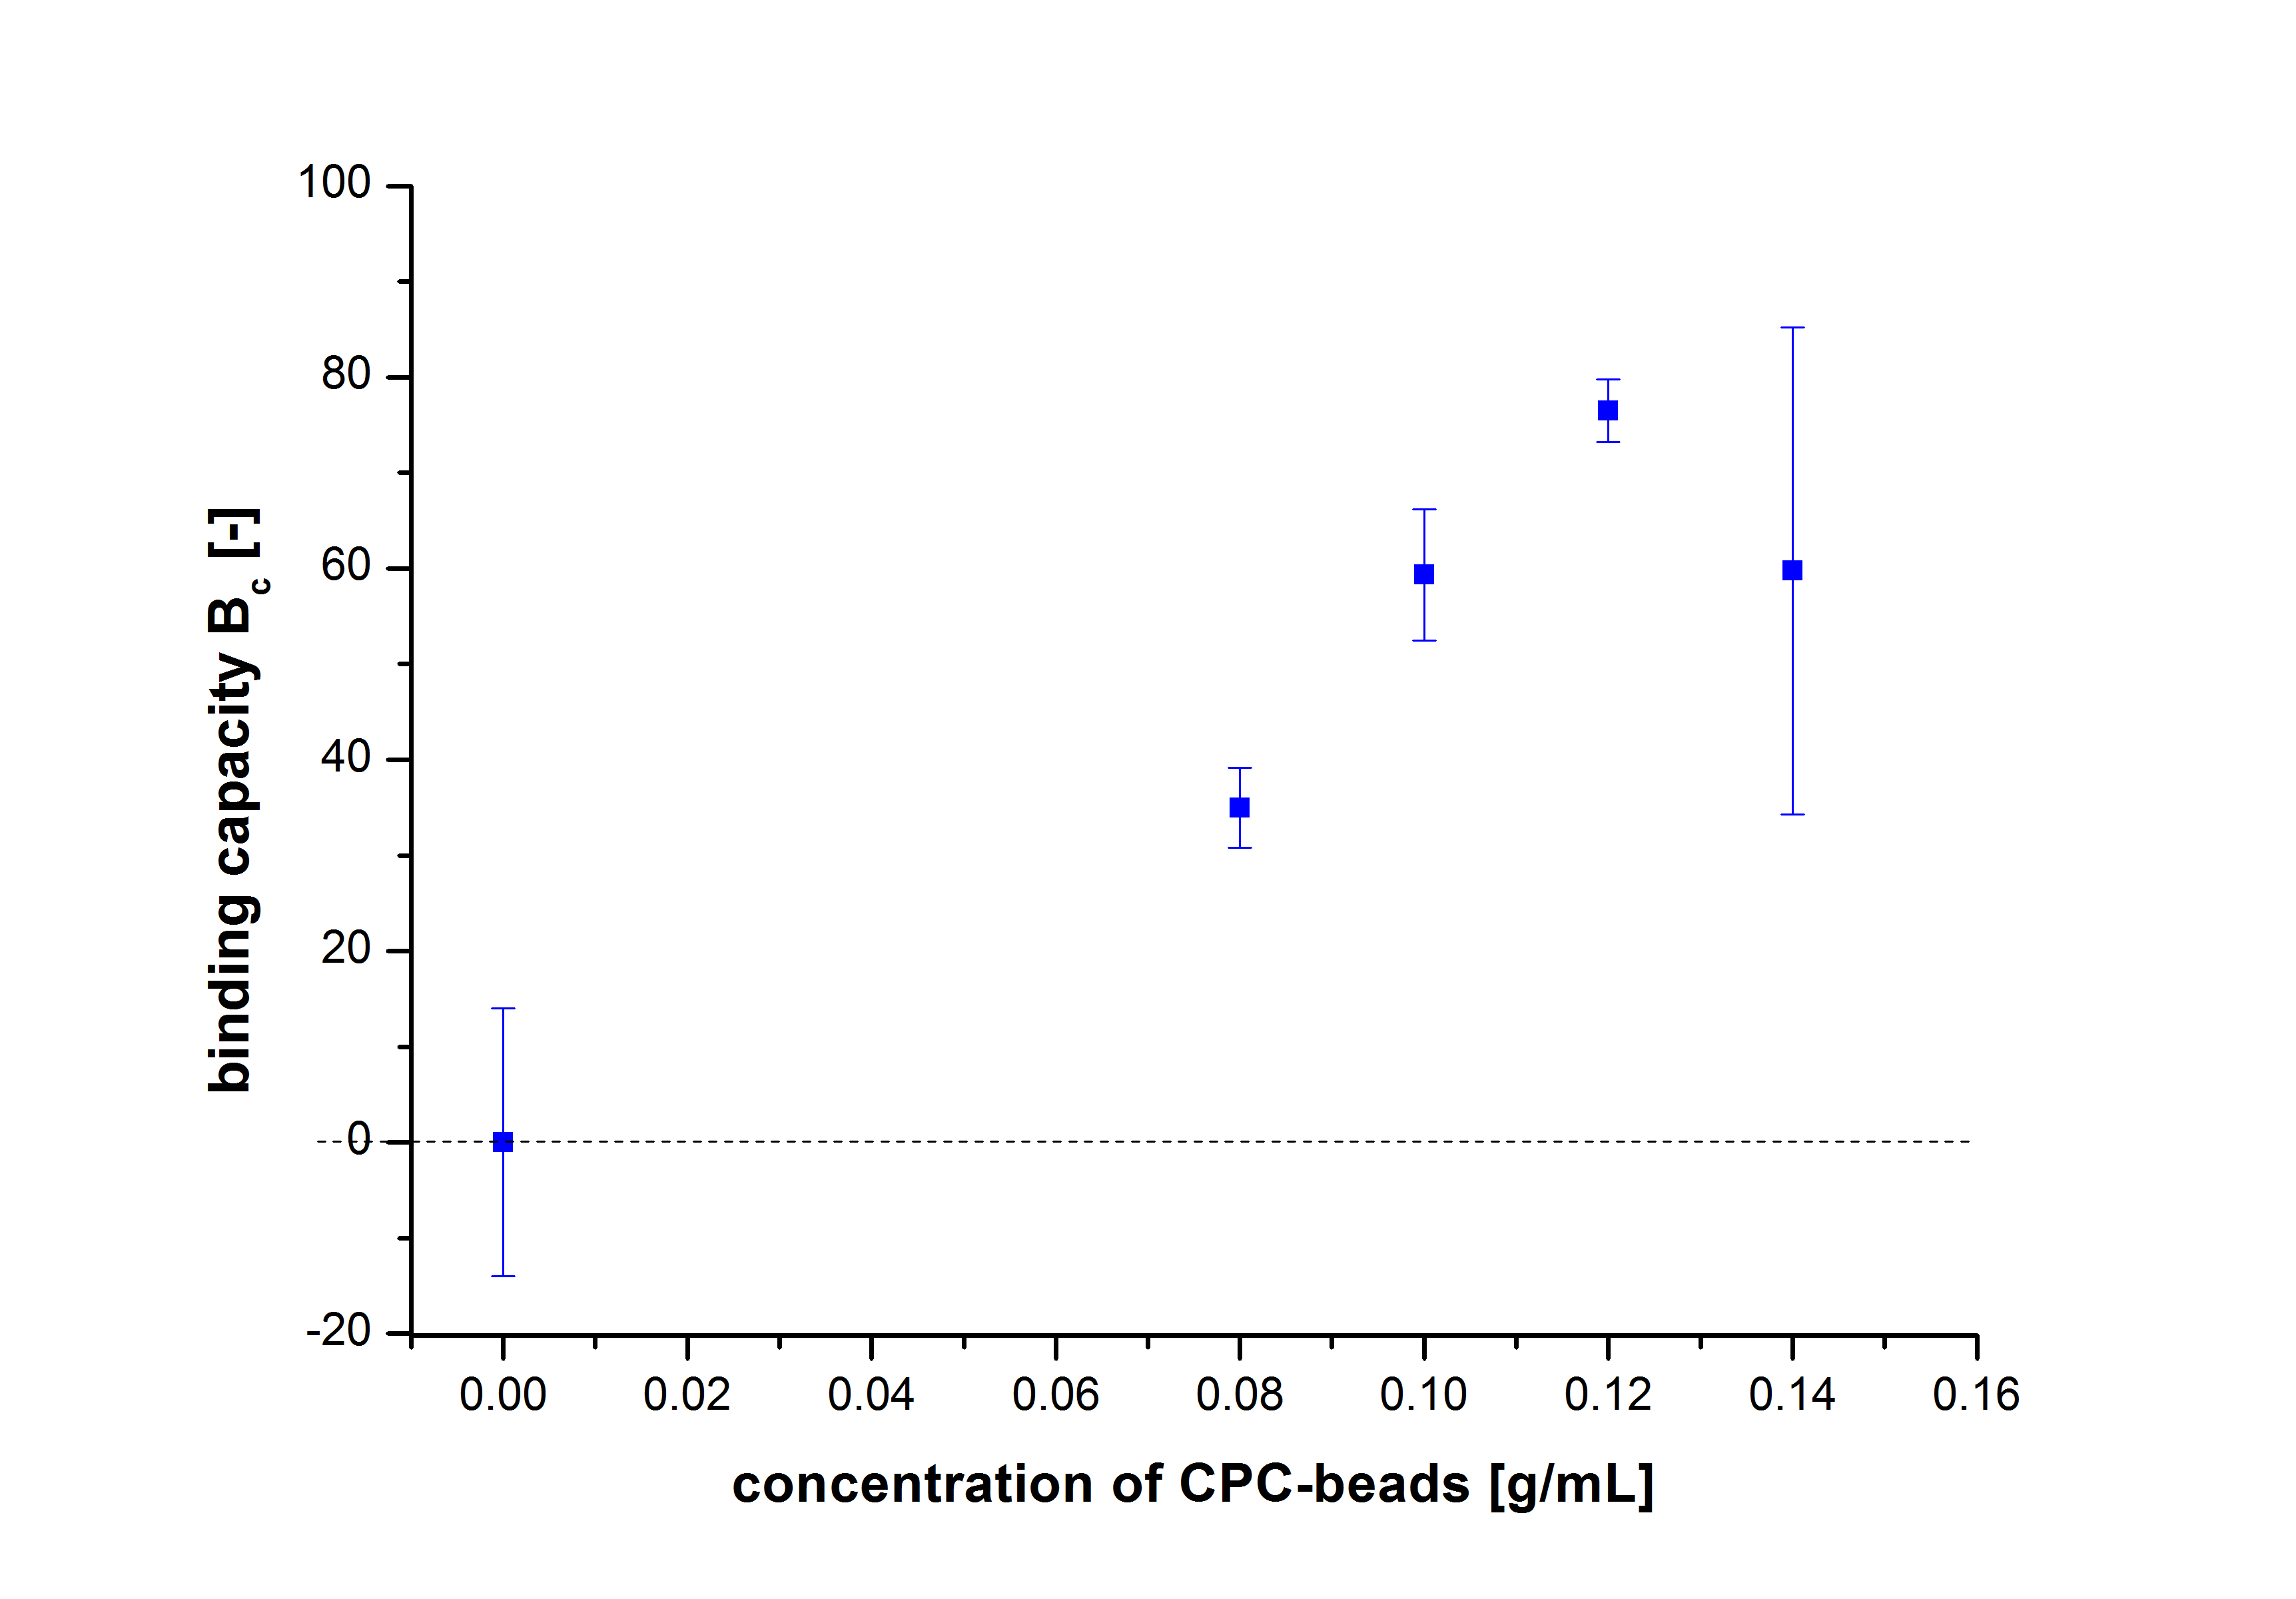
Since the activity of laccases can be affected by other conditions and can not be directly correlated to protein binding, another immobilization experiment was carried out and the protein concentration was measured using Roti®-Nanoquant. Again different bead concentrations were used: 0.08, 0.1, 0.12 and 0.14 g/ml. In order to determine the optimal ratio of CPC-beads to protein, the binding capacity (Bc) was determined as follows:
The results were almost consistent with the activity tests performed previously. The most convenient bead concentration was 0.12 g mL-1 (see Fig.6).
However, as expected, it was not possible to measure the activity of laccases bound to beads using the Tecan. The beads were probably disturbing the Tecan’s laser, and centrifugation wasn´t an option because it would have simply taken too long and wouldn’t stop the reaction at a precise point of time. Therefore, multi-well membrane-bottom filter plates were considered to be a solution. These plates work in a similar way to the regular plates used for the Tecan but furthermore they contain a membrane that sieves the liquid through the filter. Thus the beads are separated and the ABTS buffer solution can be analyzed at 420 nm for oxidized ABTS.
The ability of the “multi-well membrane-bottom filter plates” to measure the activity of laccases bound to beads was tested with TVEL0 laccases. The results were promising (for further information see labjournal).
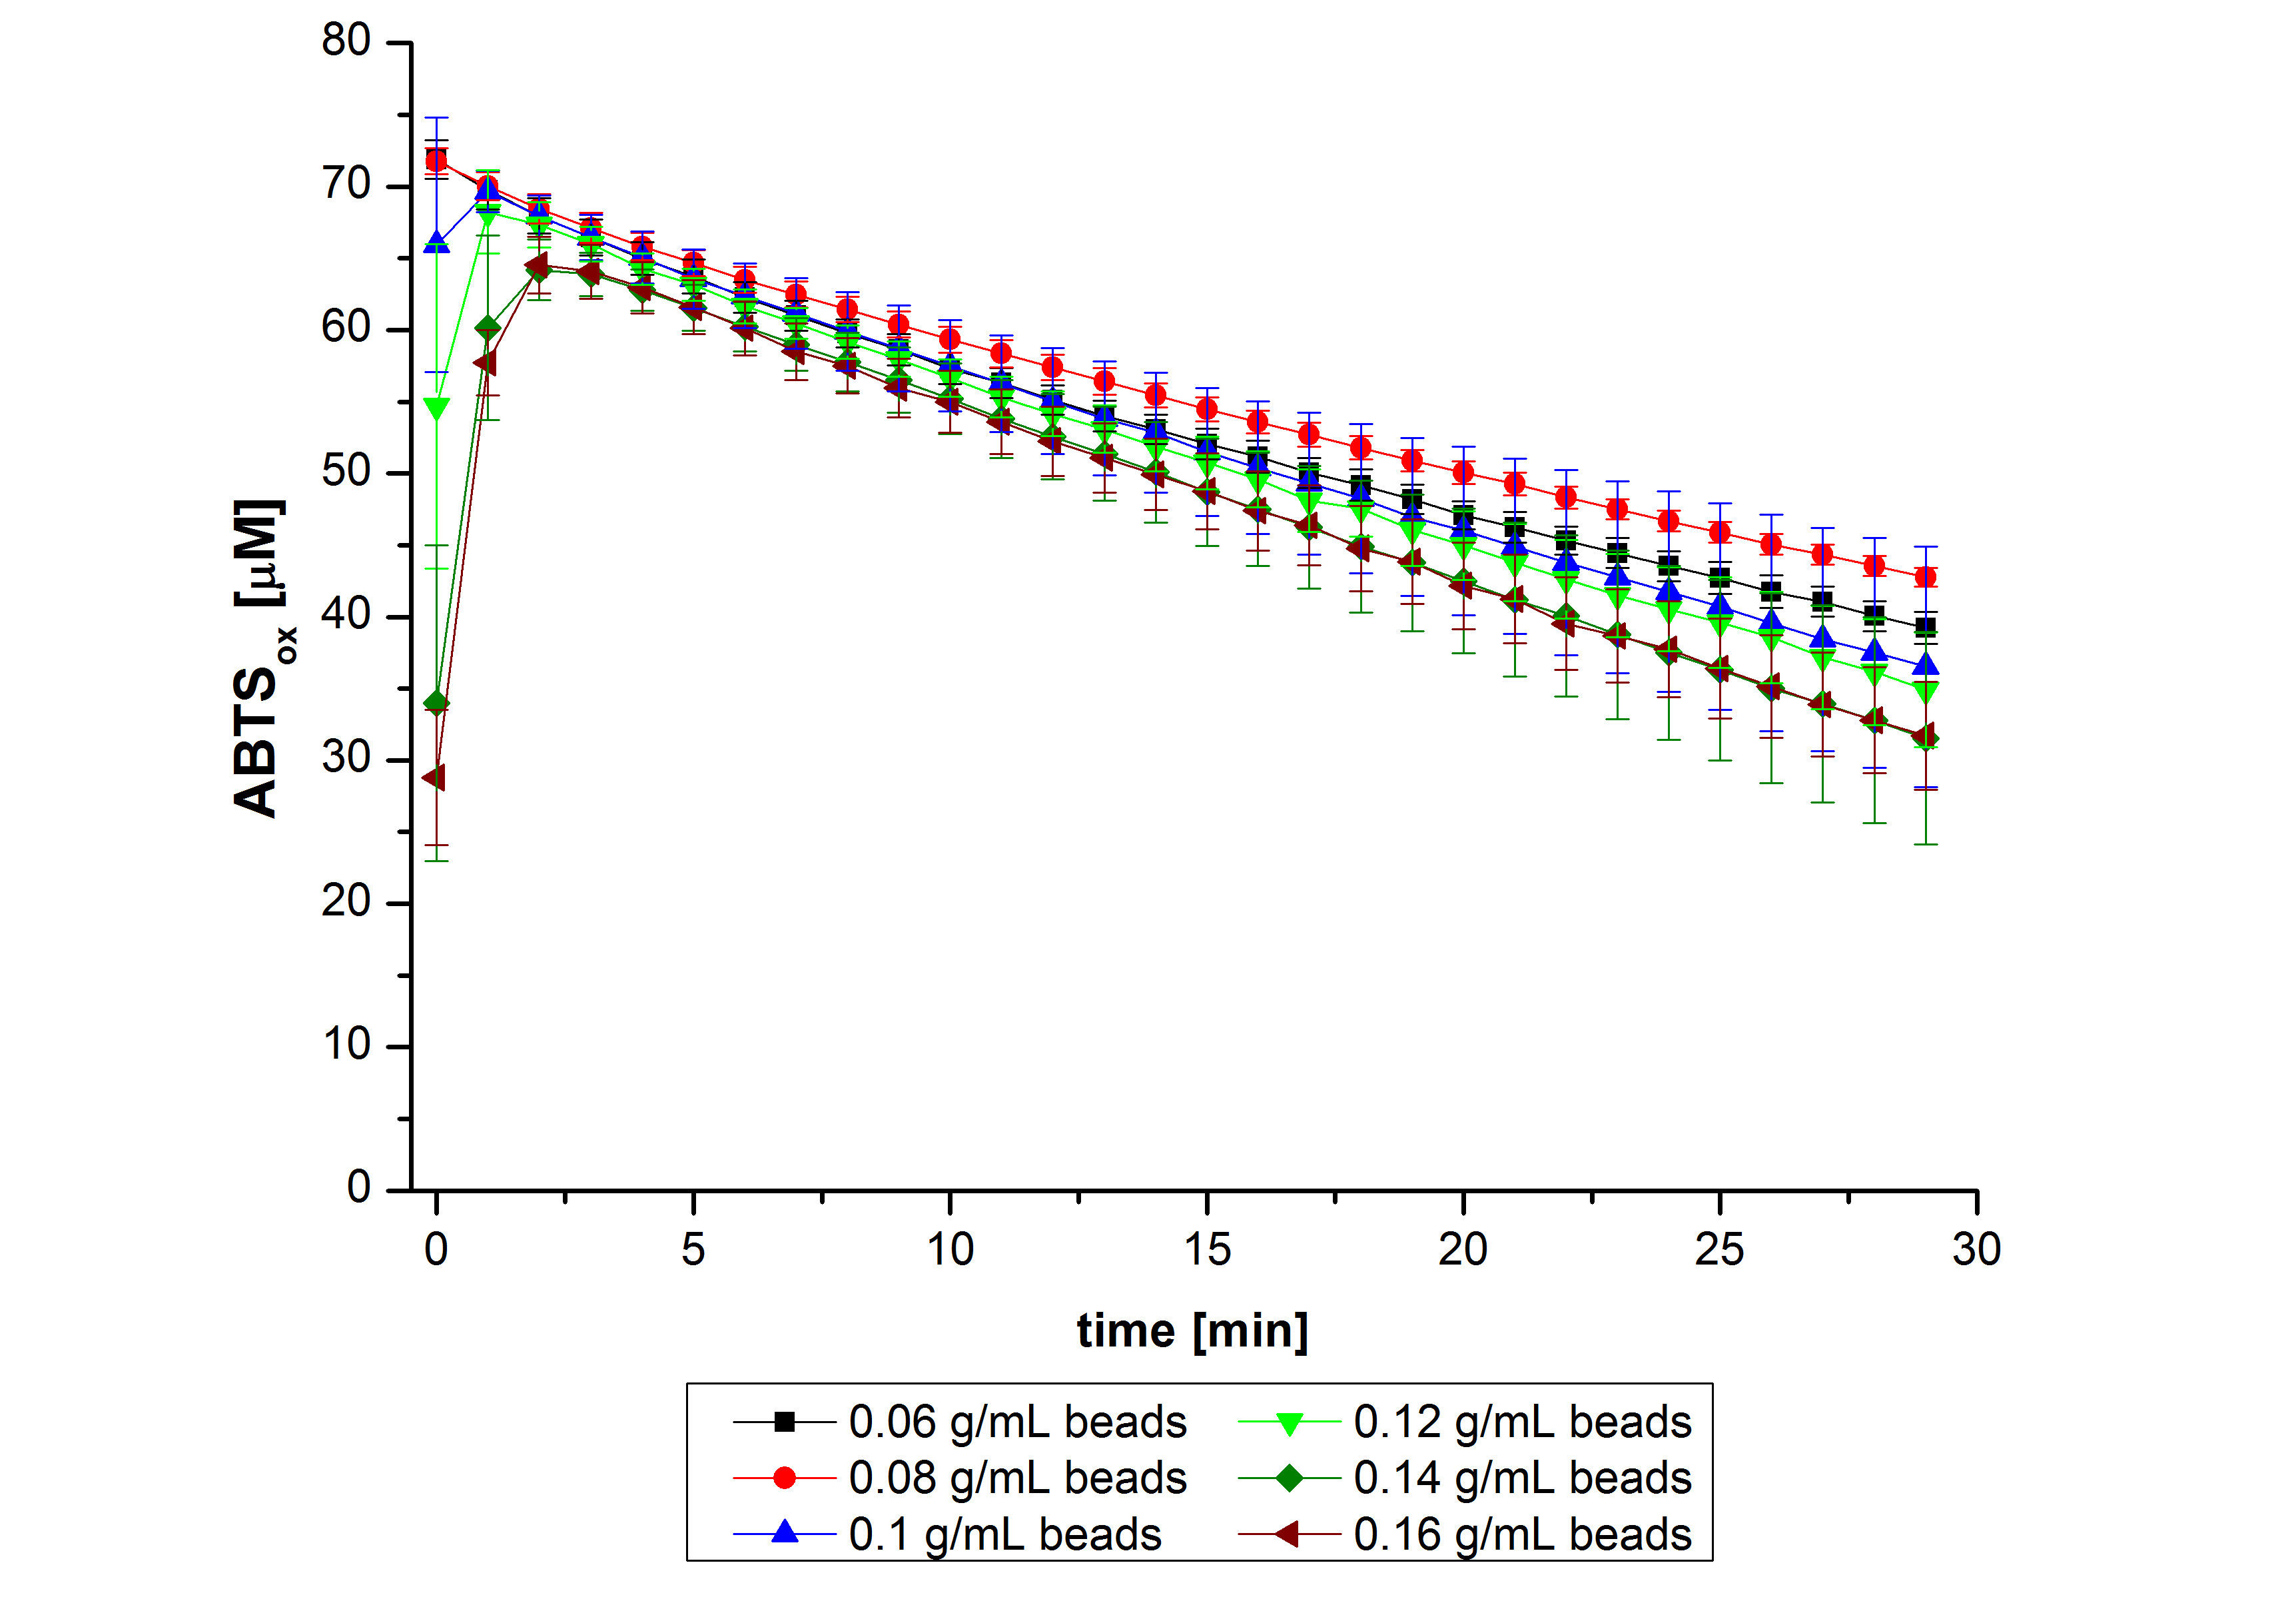
Subsequently, after receiving the laccases purified from E. coli BL21 (DE3) (named ECOL), the same procedures were followed to optimize the best conditions. However, the activity was measured over a longer period of time (35 min). The results indicated a similar behavior of ECOL to TVEL0 (see Fig. 7). Consequently, the same approach was followed for the immobilization of the next laccases.
Immobilization of purified ECOL, BPUL, BHAL and TTHL and Activity Tests
After optimizing the immobilization conditions for TVEL0 and ECOL, and proving their ability to bind to beads and preserve part of their activity, it was interesting to find out the percentage of laccases that bind to the beads, as well as the activity preserved by these laccases.
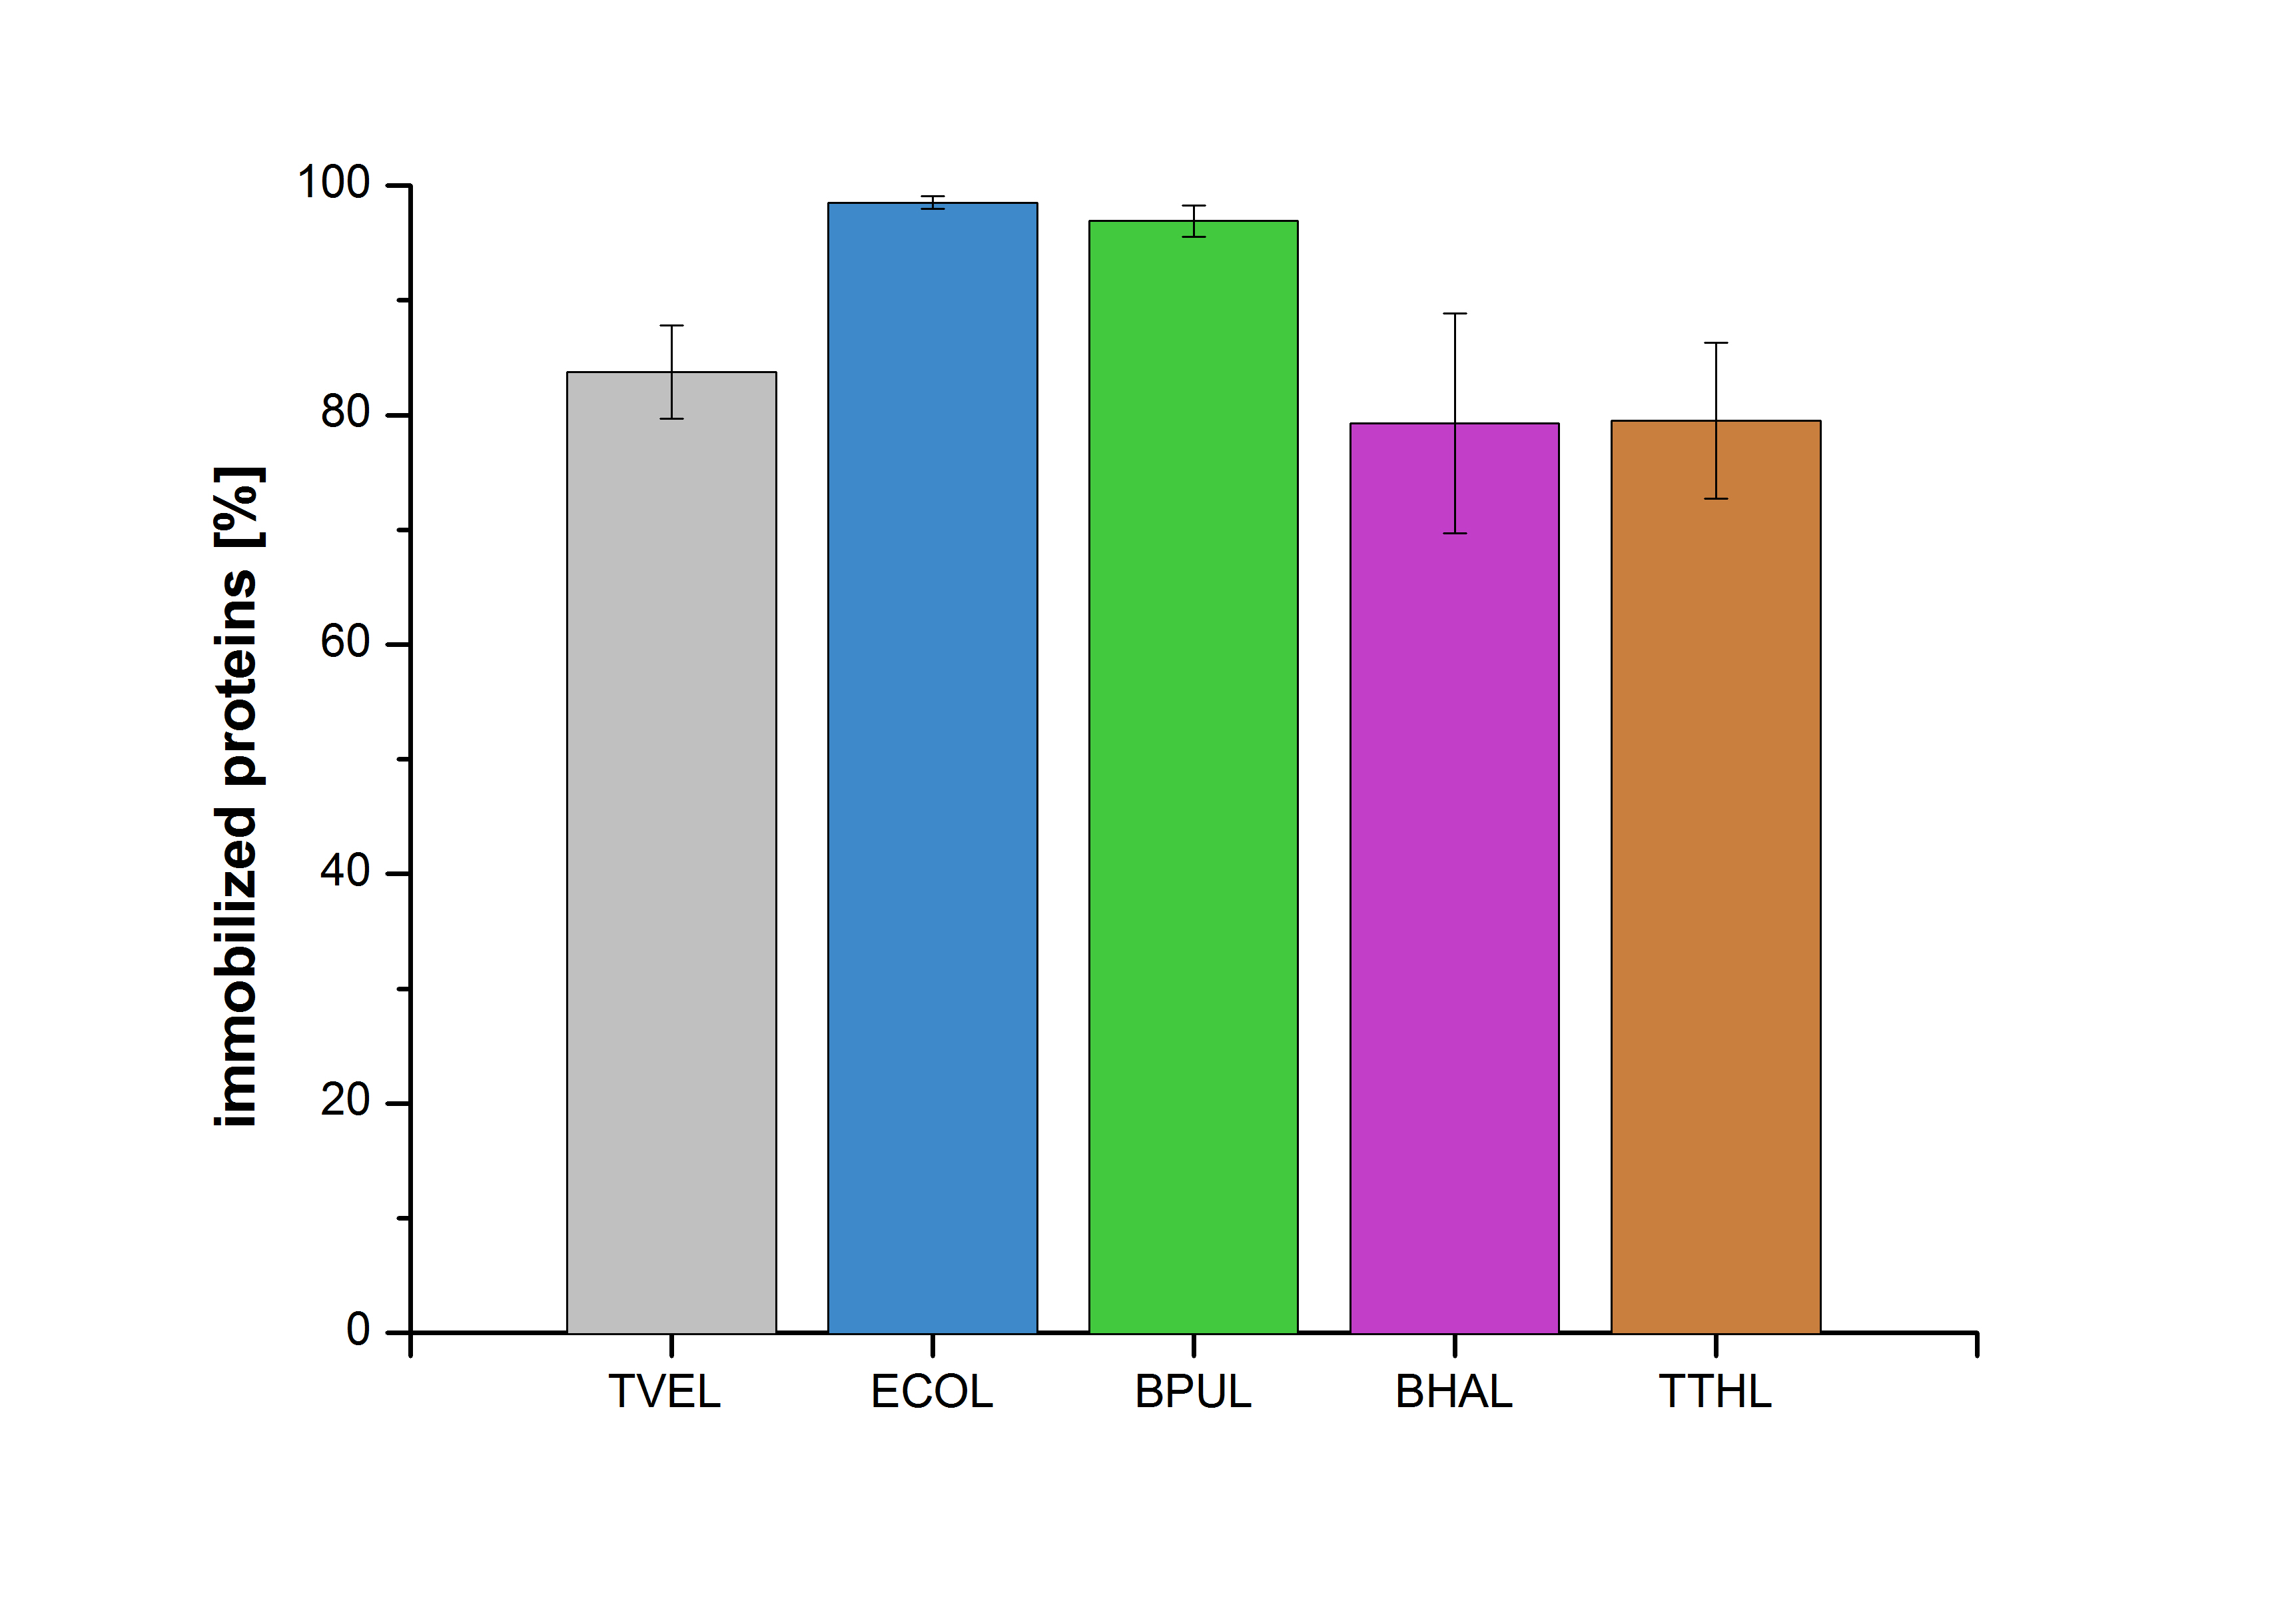
Accordingly, an immobilization experiment was carried out using TVEL0, purified laccases from Escherichia coli, BL21 DE3 (named ECOL), [http://www.dsmz.de/catalogues/details/culture/DSM-27.html|thumb|300px|left| Bacillus pumilus DSM 27 (ATCC7061)] (named BPUL), [http://www.dsmz.de/catalogues/details/culture/DSM-18197.html?tx_dsmzresources_pi5 Bacillus halodurans C-125 ] (named BHAL) and from [http://www.dsmz.de/catalogues/details/culture/DSM-7039.html?tx_dsmzreso Thermus thermophilus HB27] (named TTHL) with a bead concentration of 0.12 g and over an incubation period of 14 hours. The concentration of laccases in the supernatant after incubation was measured using Roti®-Nanoquant. The percentage of bound laccases relative to the original concentration is presented in Fig. 8.
The results showed that the four different purified laccases bind very well to the beads. ECOL and BPUL were perfectly immobilized (99% and 97% respectively) and showed a higher binding ability than the standard laccase TVEL0. 79 % of BHAL and TTHL could be immobilized on the CPC-beads.
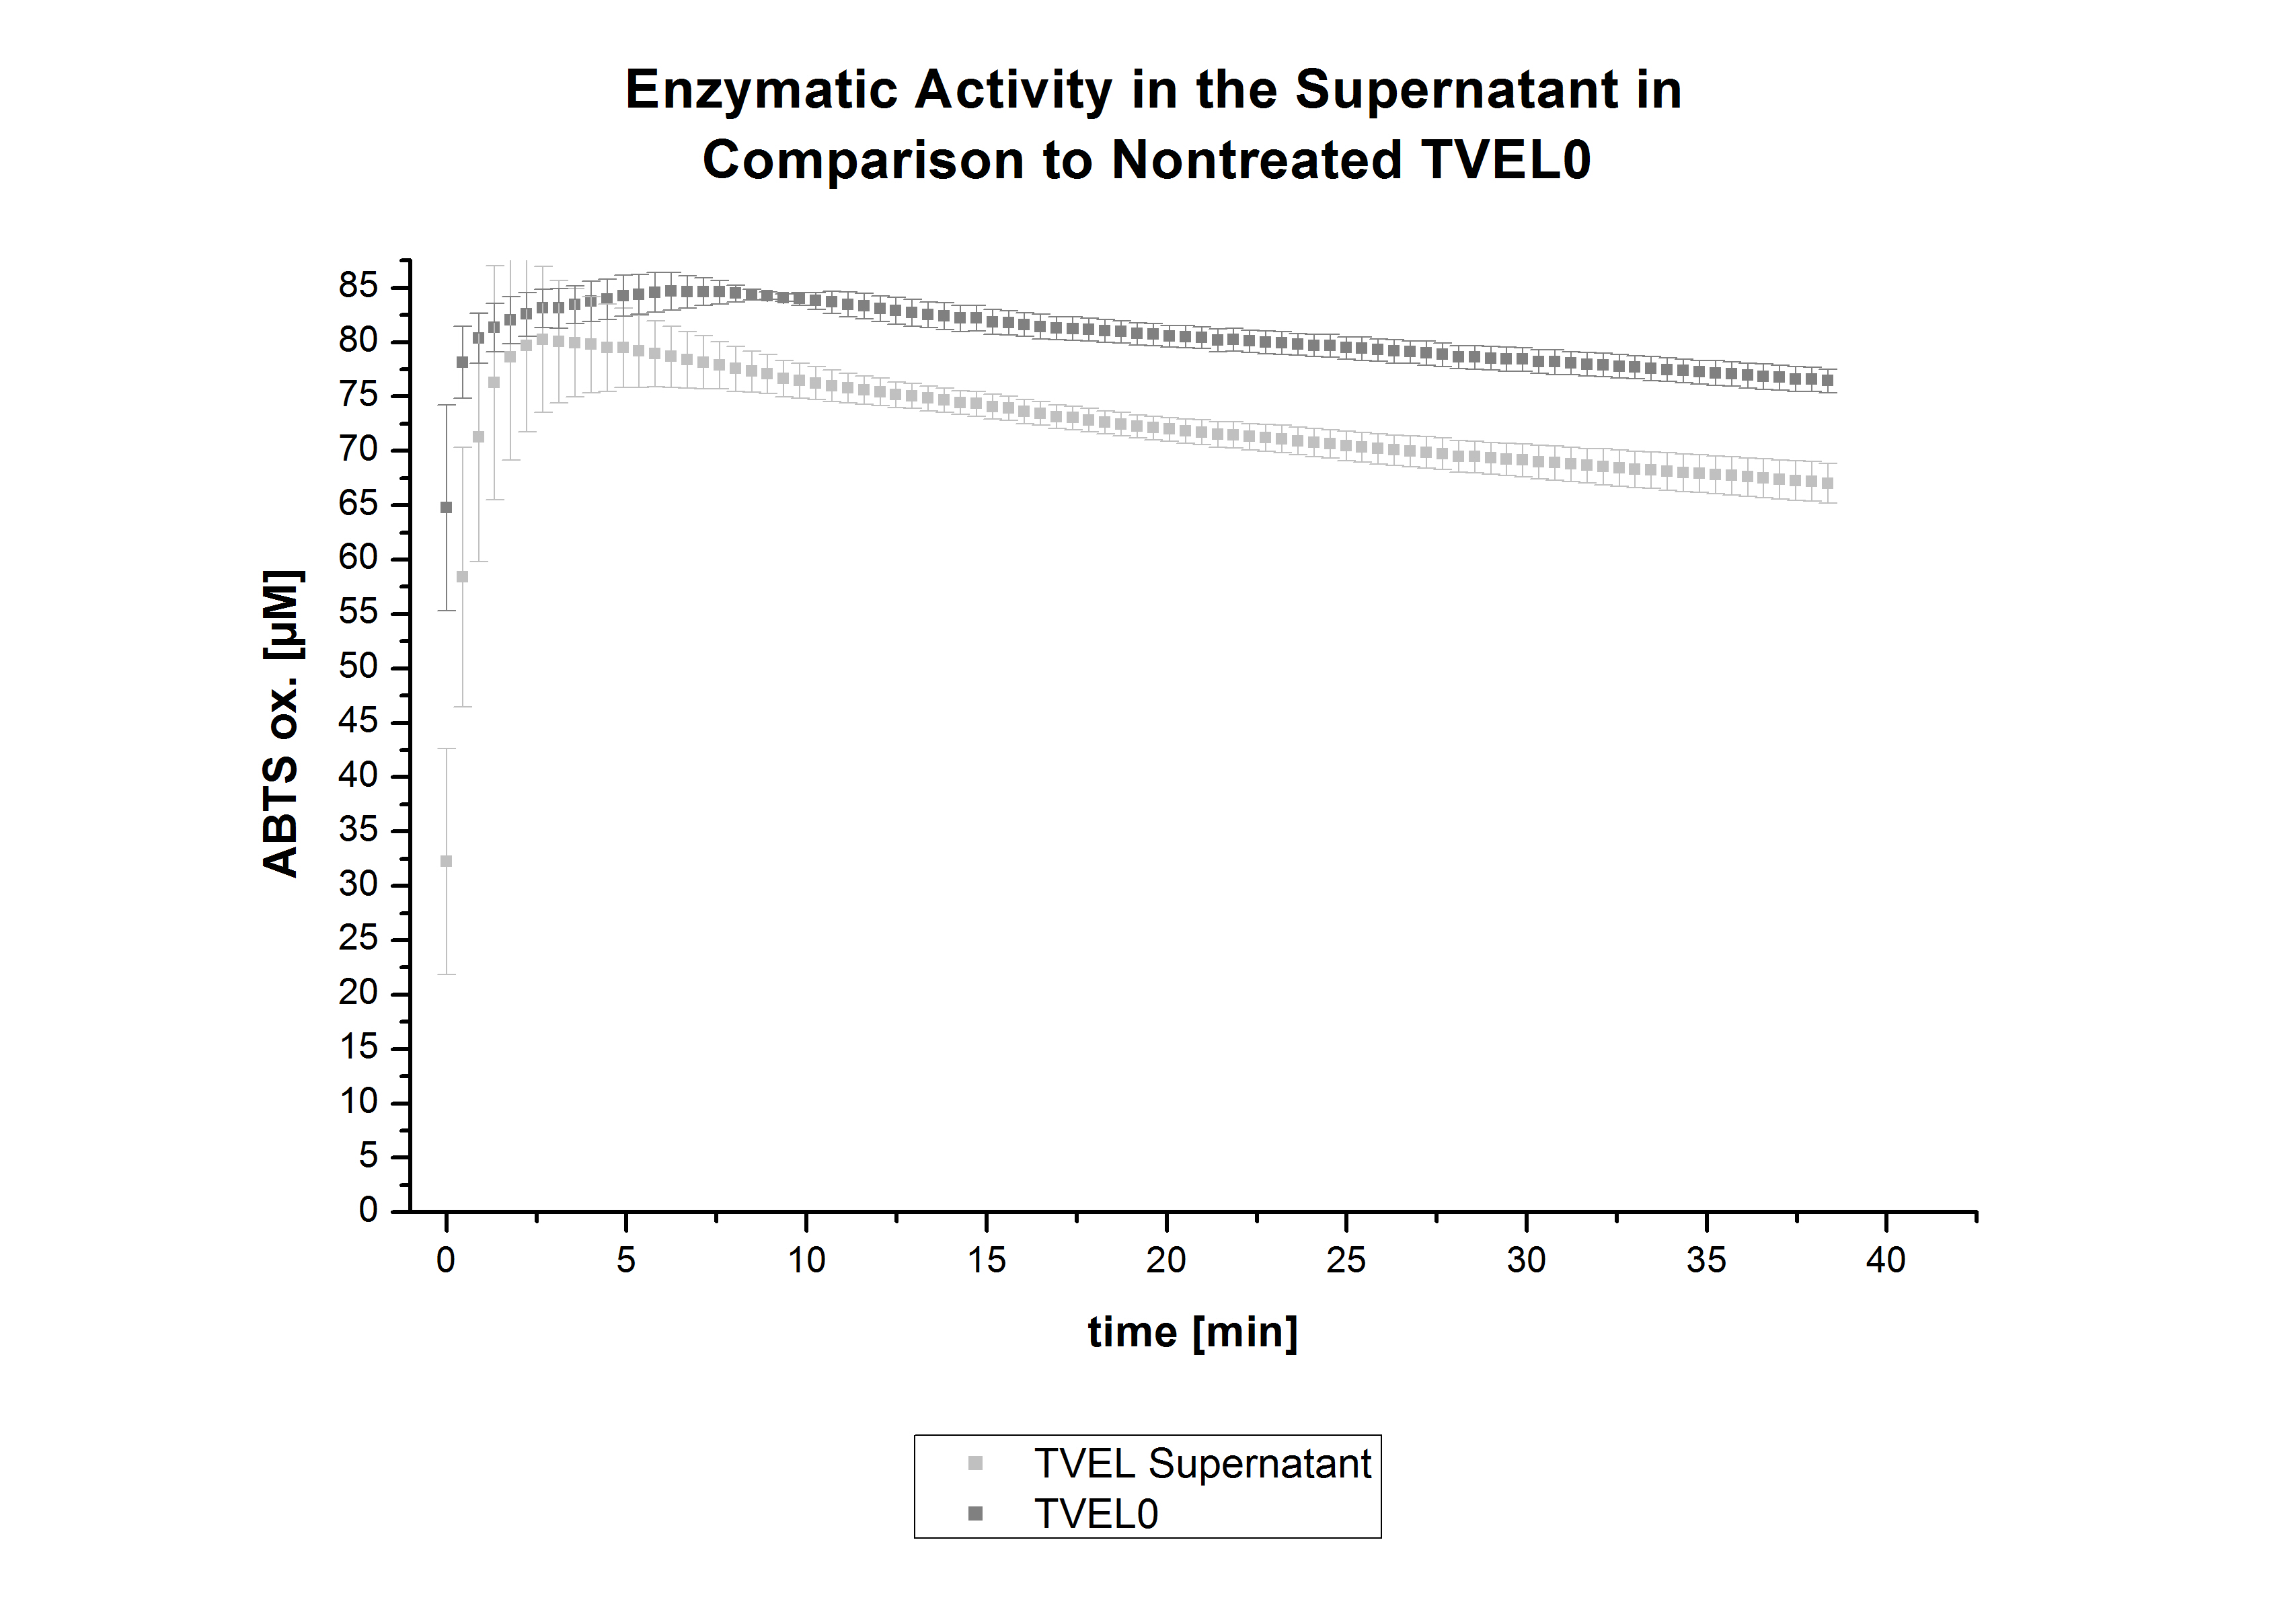
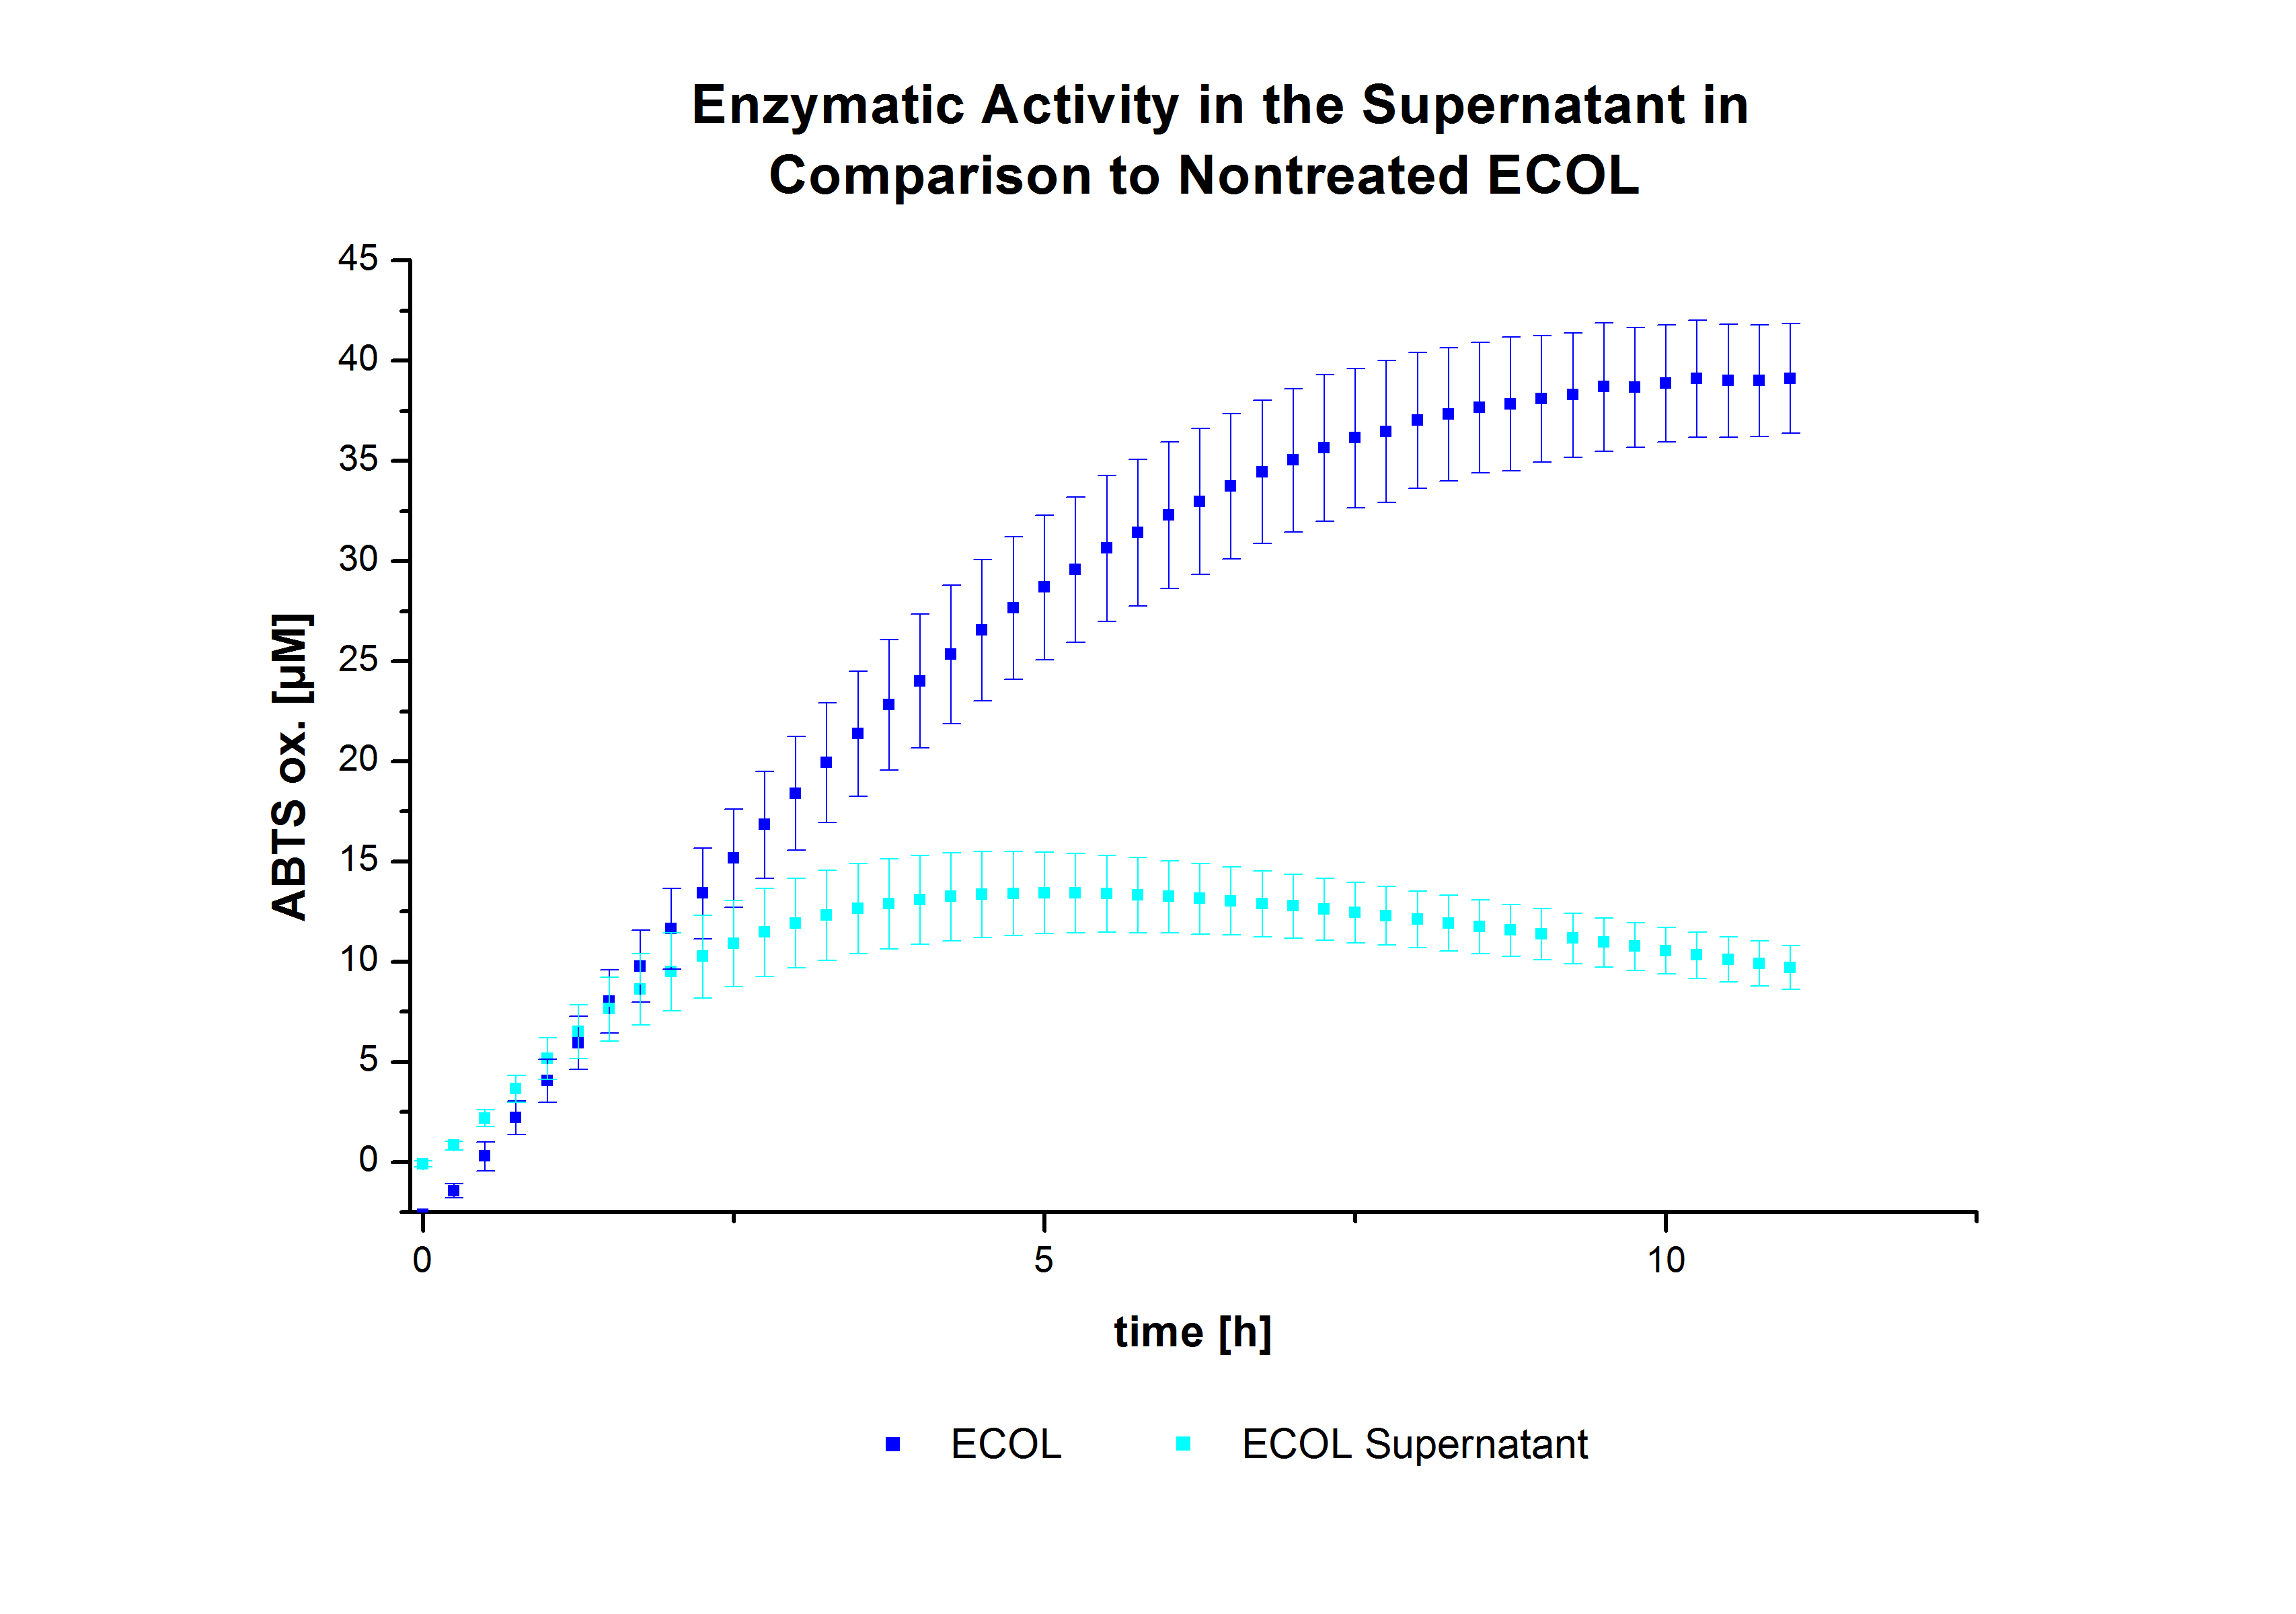
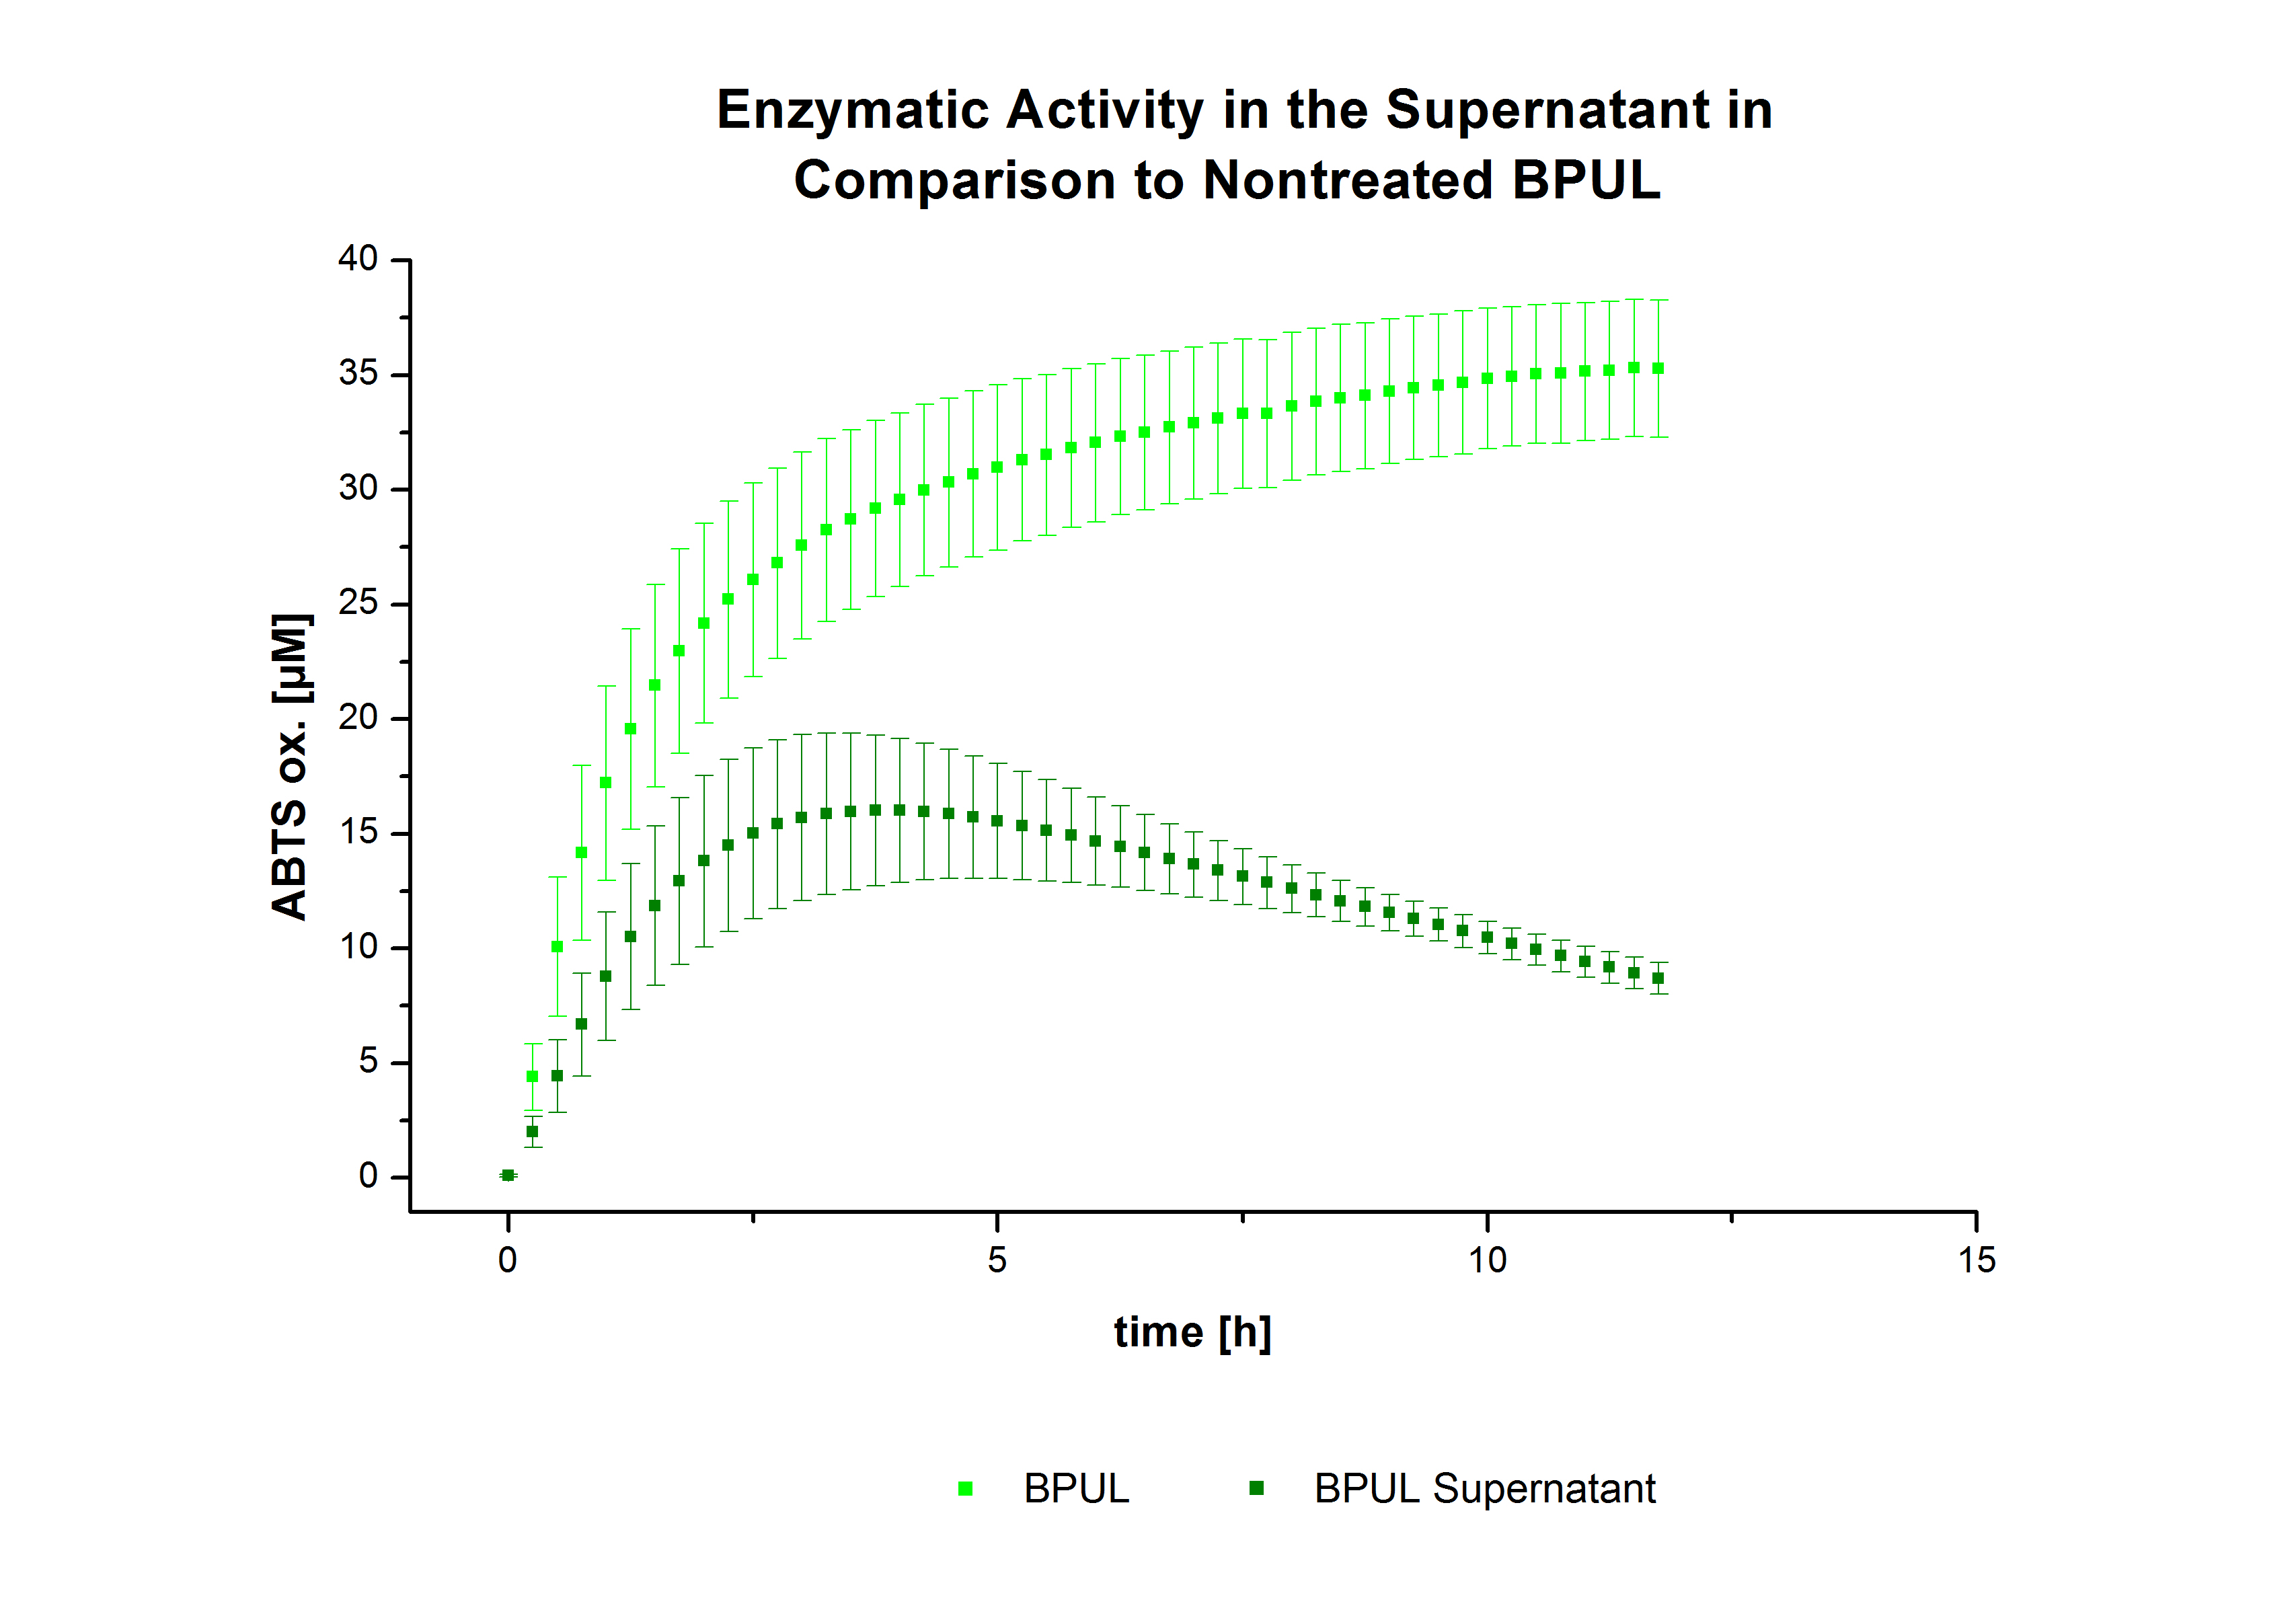
After the successful immobilization, the second step was to test the activity of the immobilized laccases. The activity of laccases in the supernatant was also measured using ABTS as substrate and compared to the activity of nontreated laccases (Fig. 9-11). The results show that TVEL0 almost preserve their activity in the supernatant, whereas the activity of ECOL dramatically decreases compared to a slight decrease in the activity of BPUL.
On the other hand, the specific enzyme activity of immobilized laccases from ECOL and BPUL was also measured using ABTS as substrate and compared to that of nonimmobilized laccases (Fig. 12). The results showed that immobilized BPUL preserved 44 % of its activity, whereas ECOL didn't show a significant activity after immobilization.
Since Regionals: Activity tests of immobilized ECOL, BPUL, BHAL and TTHL
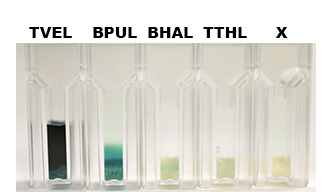
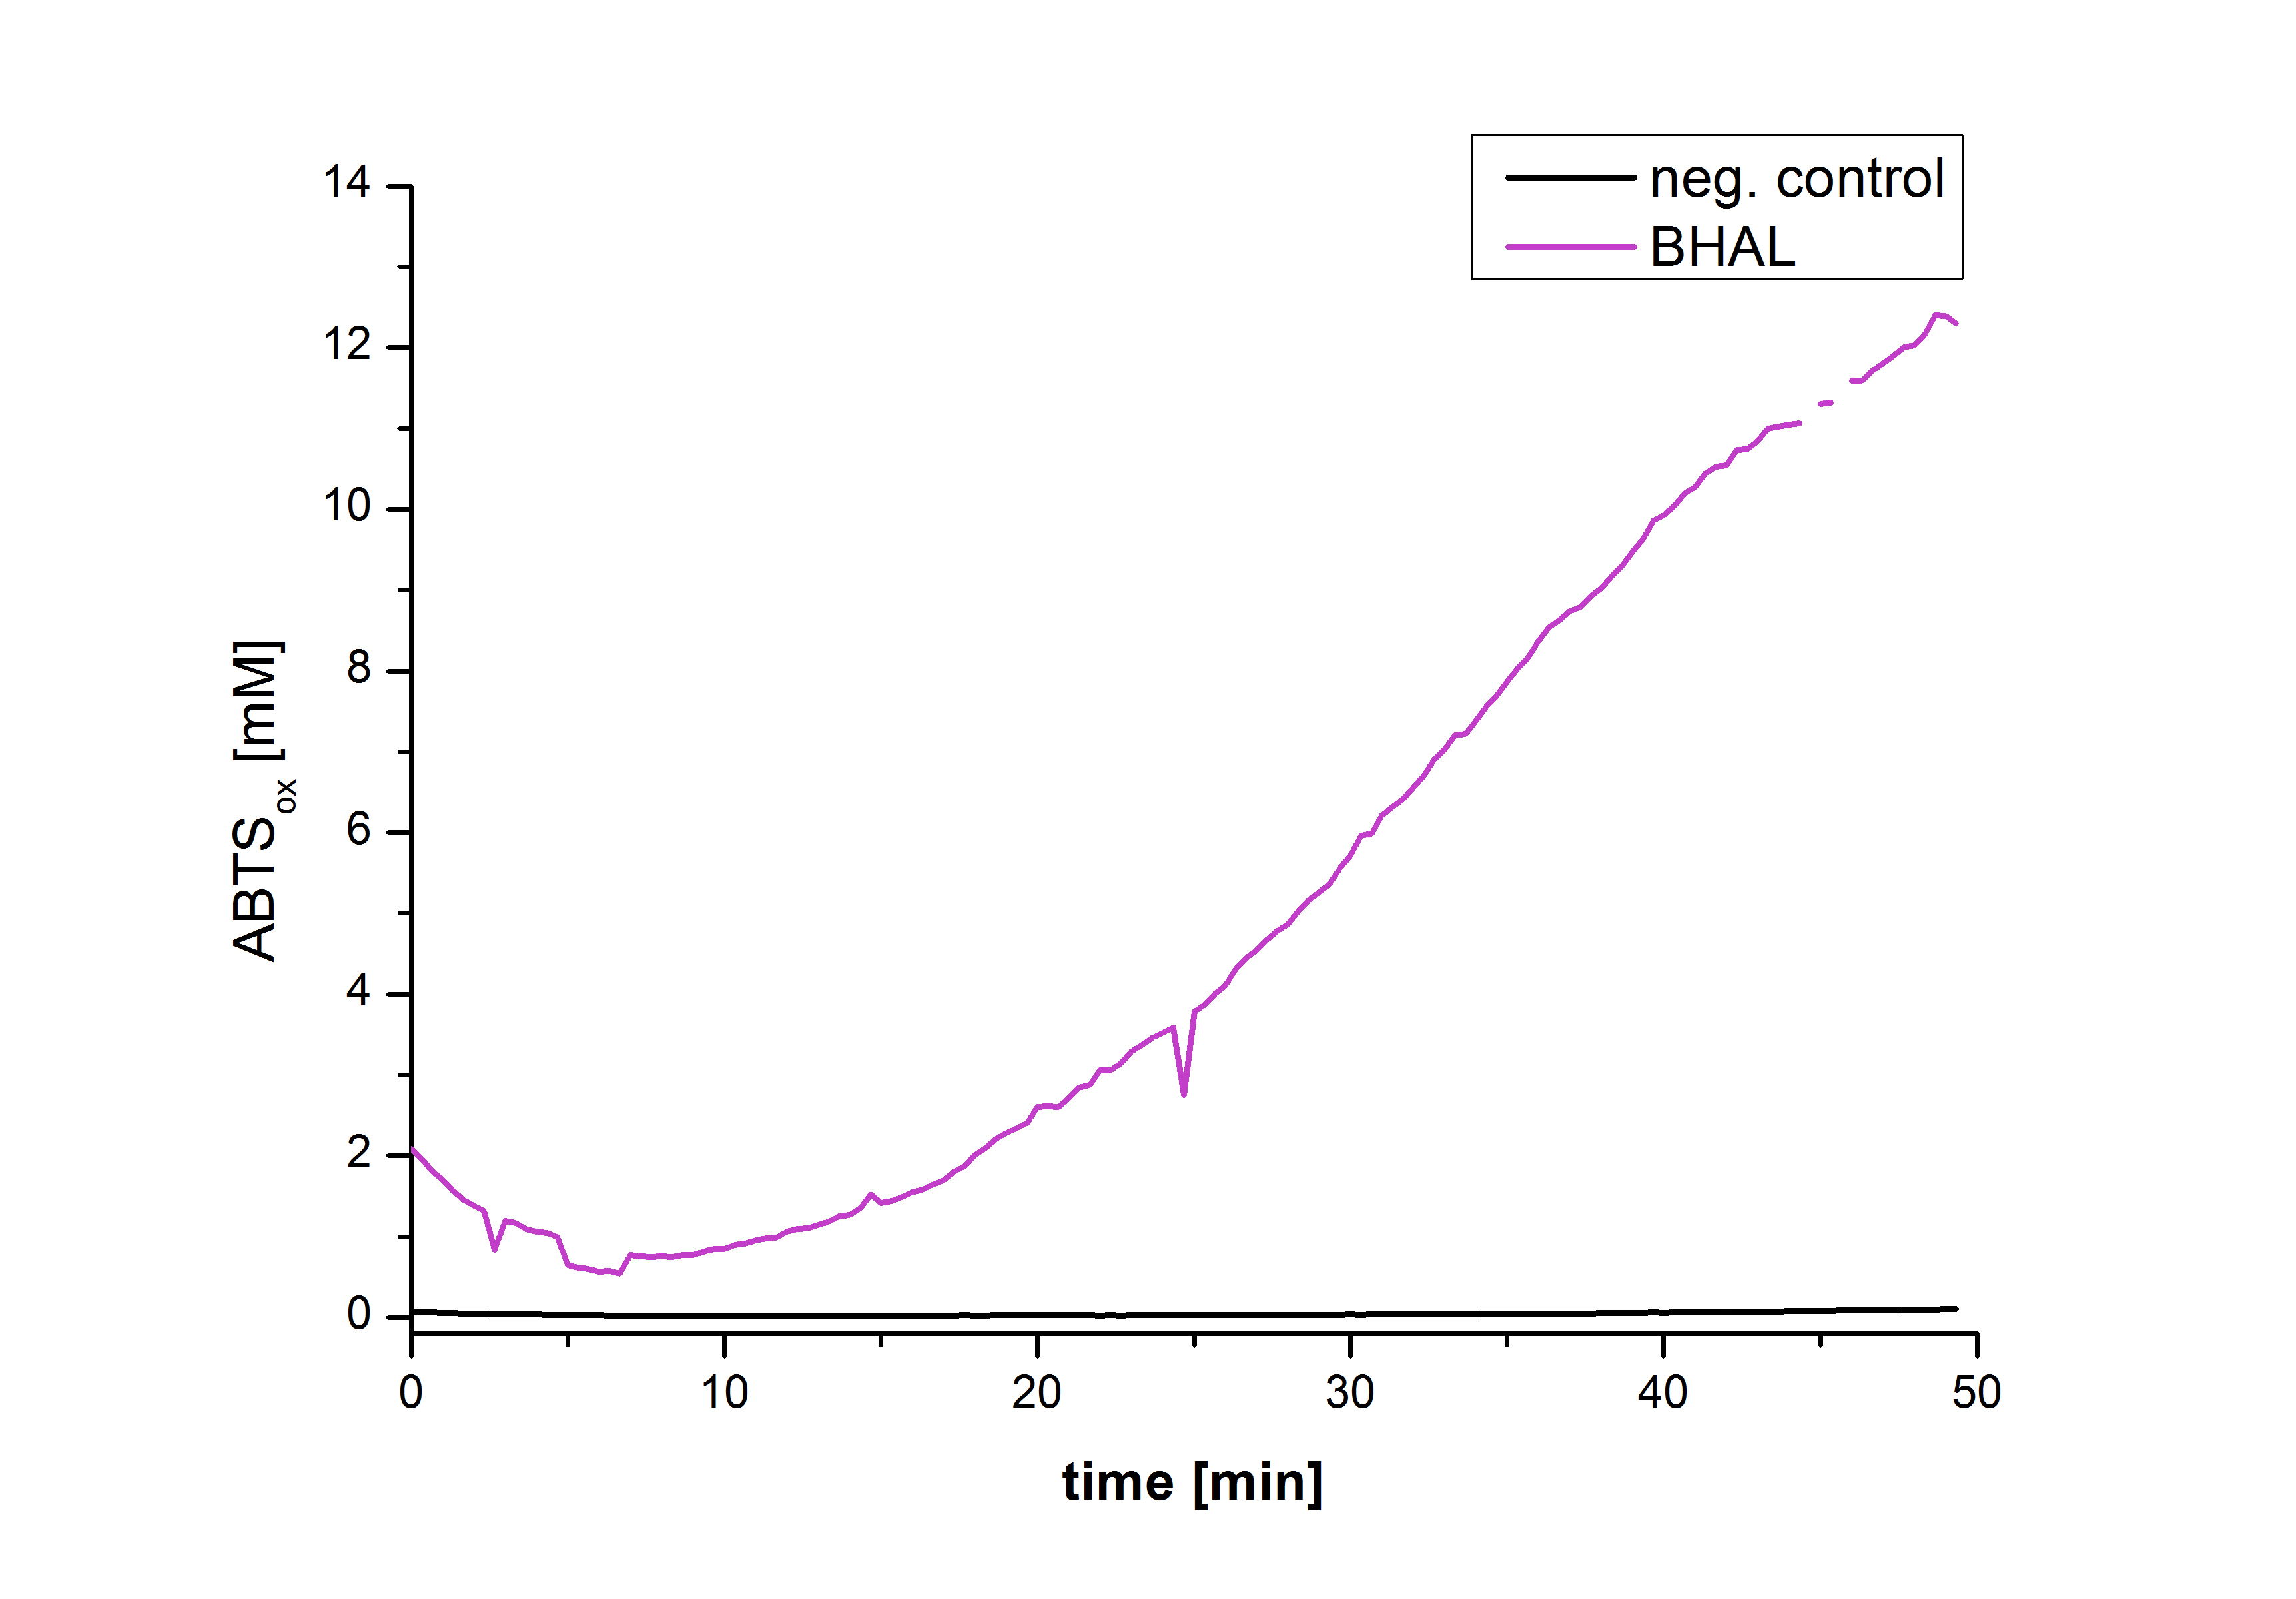
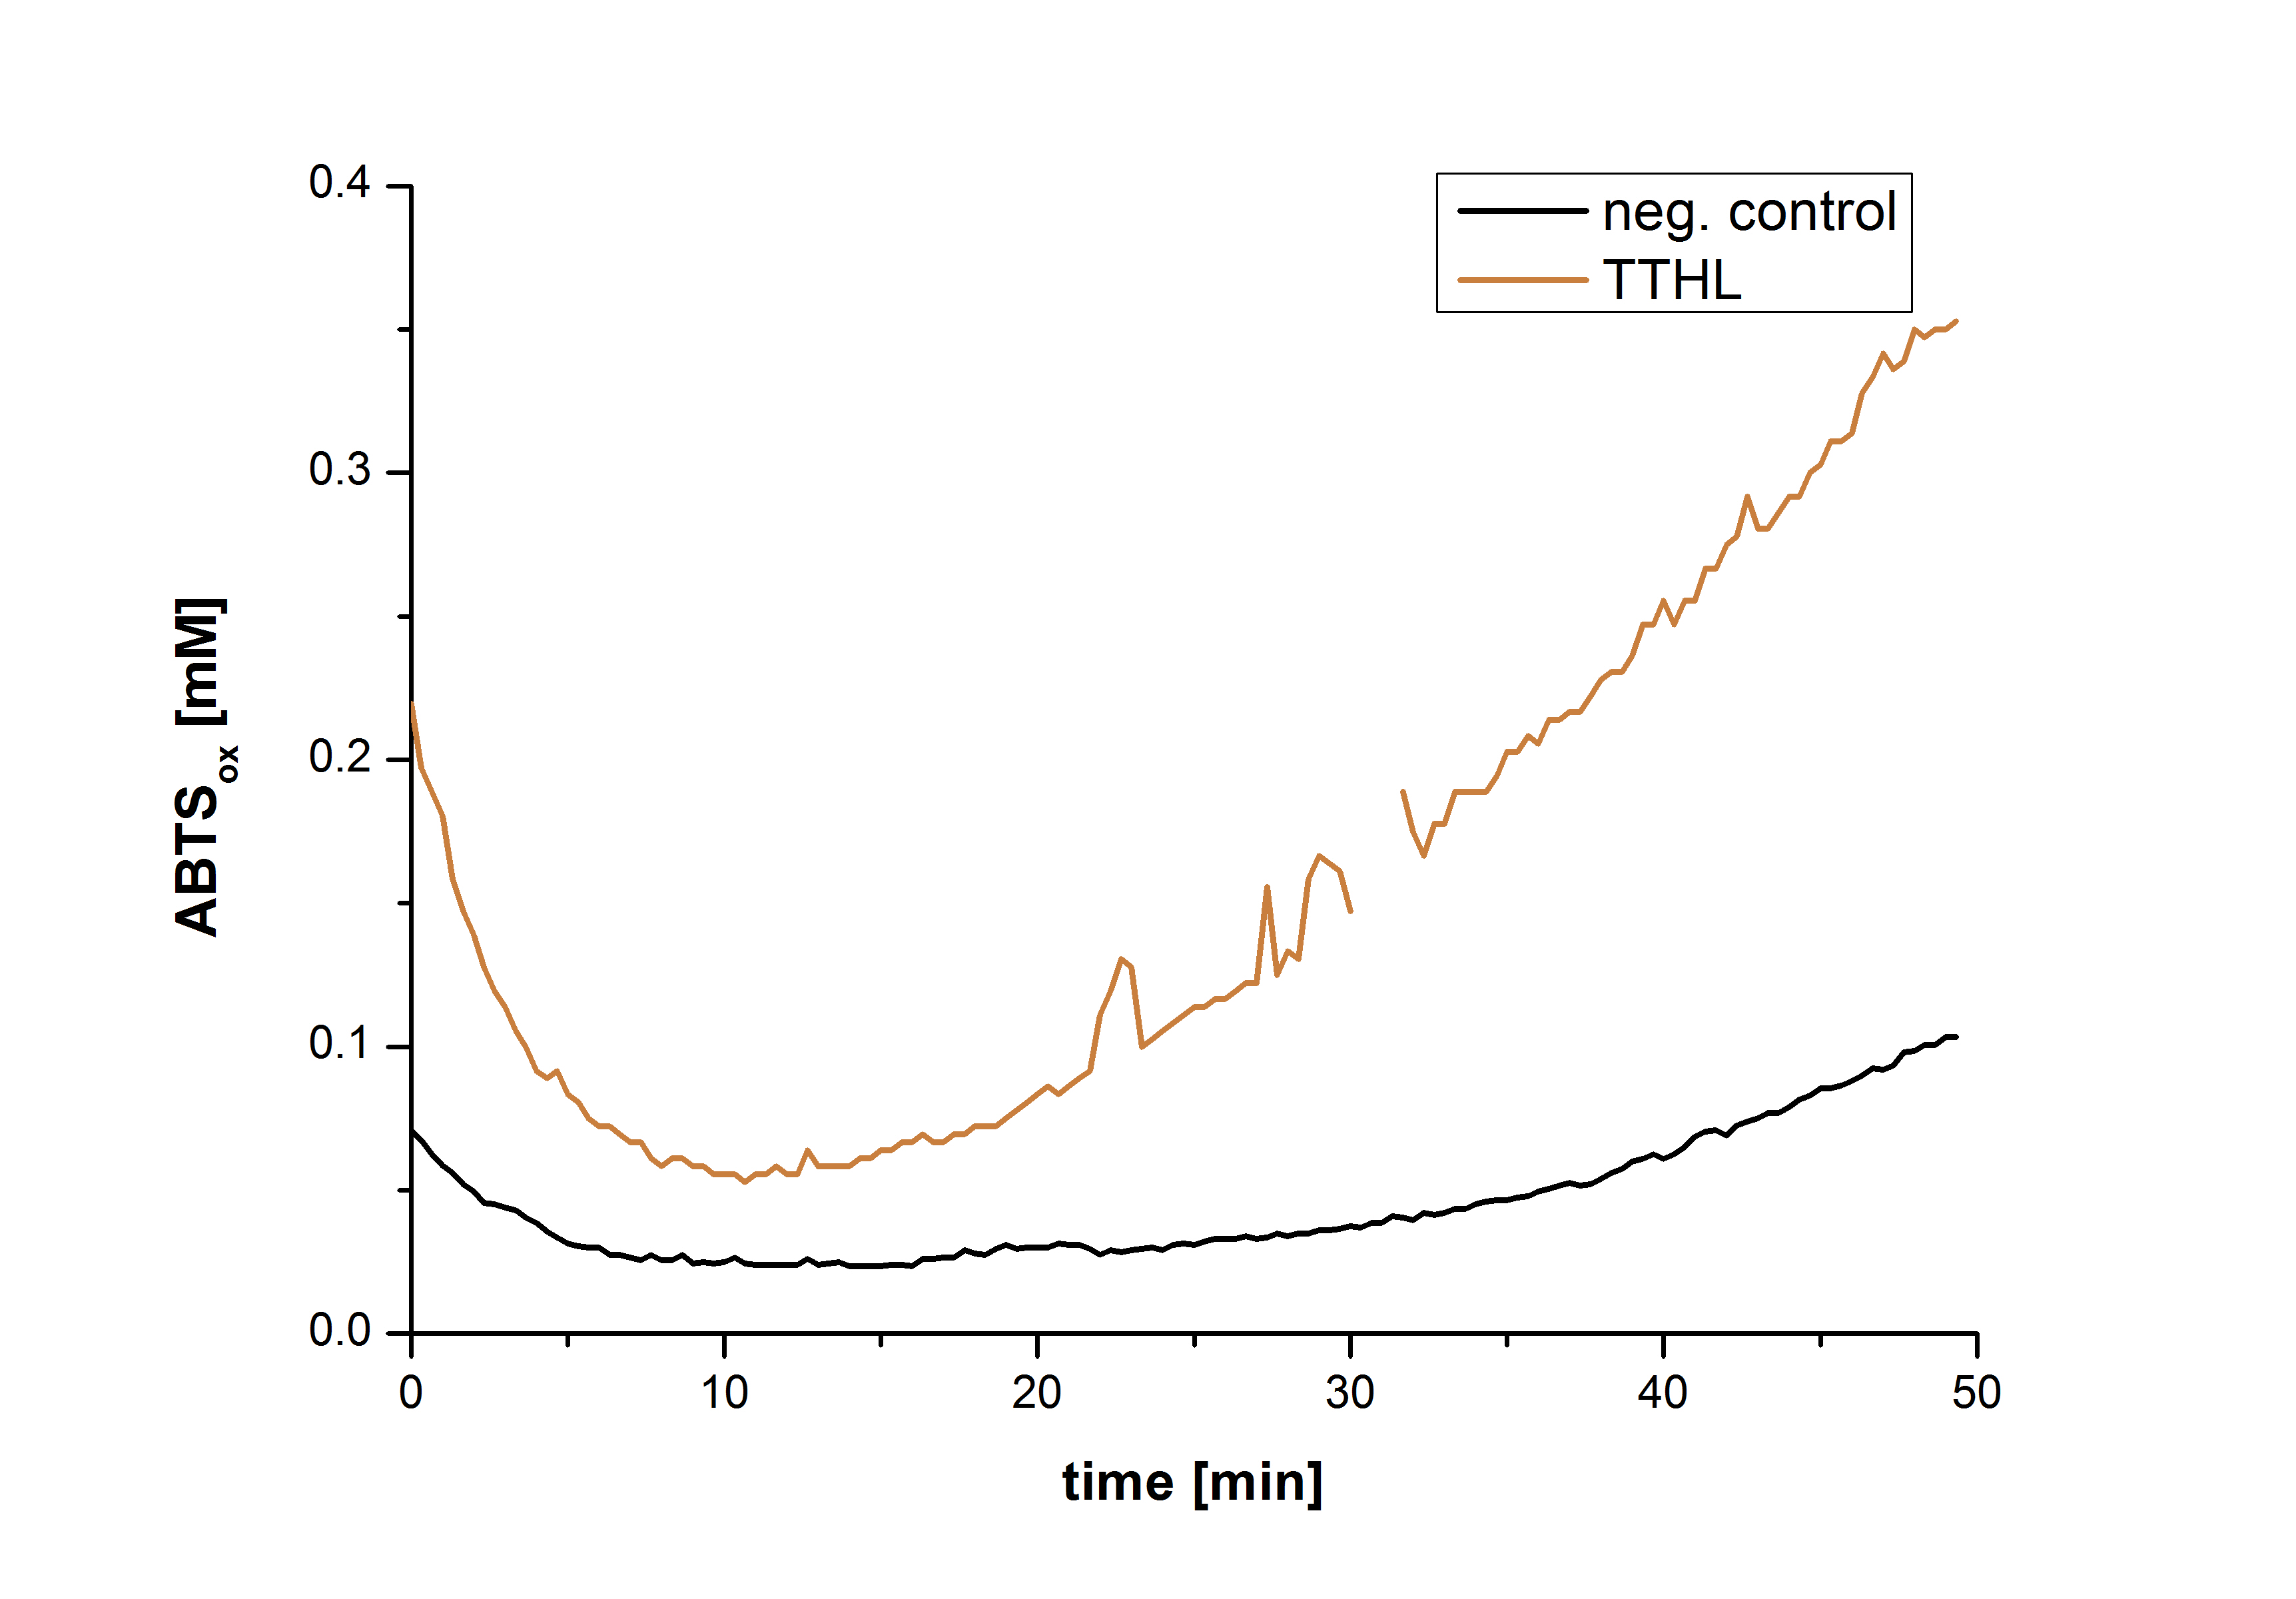
After the Regional Europe Jamboree, further experiments were carried out. However, less amounts of purified laccases were available. Since activity tests of immobilized laccases using the “multi-well membrane-bottom filter plates” in Tecan require higher amounts of laccases, due to the fact that every period of time is measured separately, another method was to be used. The only alternative was a "Thermo Biomate 3 UV-Vis Spektrophotometer", in which the same solution can be continuosly vortexed and measured over a period of time. However, only the results of immobilized ECOL could be compared to those of nonimmobilzed. Immobilized ECOL could preserve 21 % of its initial activity (results not shown). The activity of purified nonimmobilized BPUL was so high, that even a 1:500 dilution wasn't enough to show significant results using the photometer. The concentration of purified BHAL and TTHL was too low (4 μg ml-1) to yield comparable results. Yet, BHAL showed a higher activity than TTHL. However, all four purified laccases showed indeed an activity (see Fig. 13). An illustration of ABTS oxidation with time compared to the negative control could also show an activity of the laccases (see Fig. 14-17).
Literature
[1]Fernández-Fernández M et al. (2012) Recent developments and applications of immobilized laccase. Biotechnol Adv. 2012 Feb 28. [Epub ahead of print]
[2]P.-P. Champagne and J.A. Ramsay (2007) Reactive blue 19 decolouration by laccase immobilized on silica beads. Appl Microbiol Biotechnol. Oct;77:819–823
[3]Chantale Cardinal-Watkins and Jim A. Nicell (2011)Enzyme-Catalyzed Oxidation of 17ß-Estradiol Using Immobilized Laccase from Trametes versicolor. Enzyme Research, vol. 2011, Article ID 725172, 11 pages
| 55px | | | | | | | | | | |
 "
"


