Team:TU-Delft/Snifferometer
From 2012.igem.org

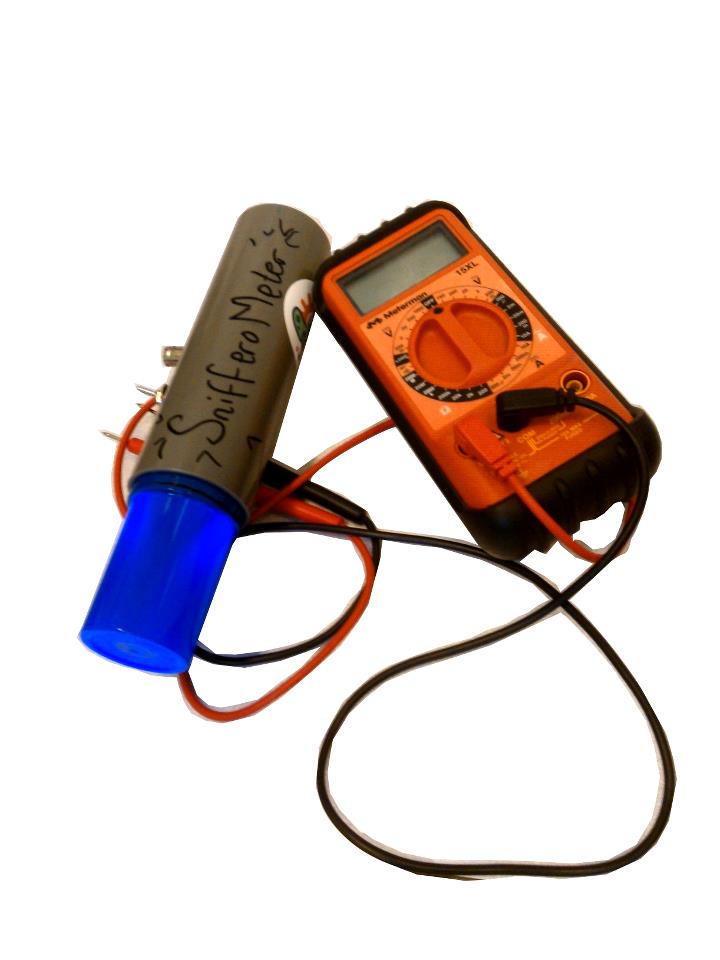
In order to assess the feasibility using our Snifferomyces cells as a diagnosis method, a device called "Snifferometer" was built to measure the status of fluorescence. The purpose of building such a device is to overcome the complexity, incalculability, and the high cost of using fluorescence microscope.
Contents |
Construction of Snifferometer
Scheme of the Prototype
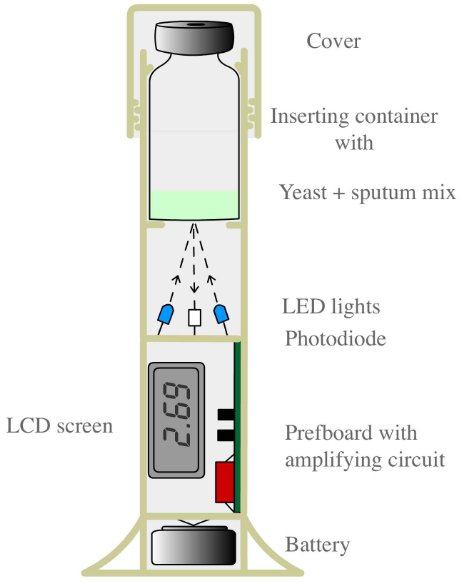
Figure 1 shows the concept of how the device works. The LEDs emit blue light on the liquid mixing Snifferomyces and sputum of the patient. Later, the photodiode collects the glowing light and transfers it into an amplified signal of voltage. Thus, by reading the number of voltmeter, the status of TB smelling cells in sputum can be detected.
Circuit of Snifferometer
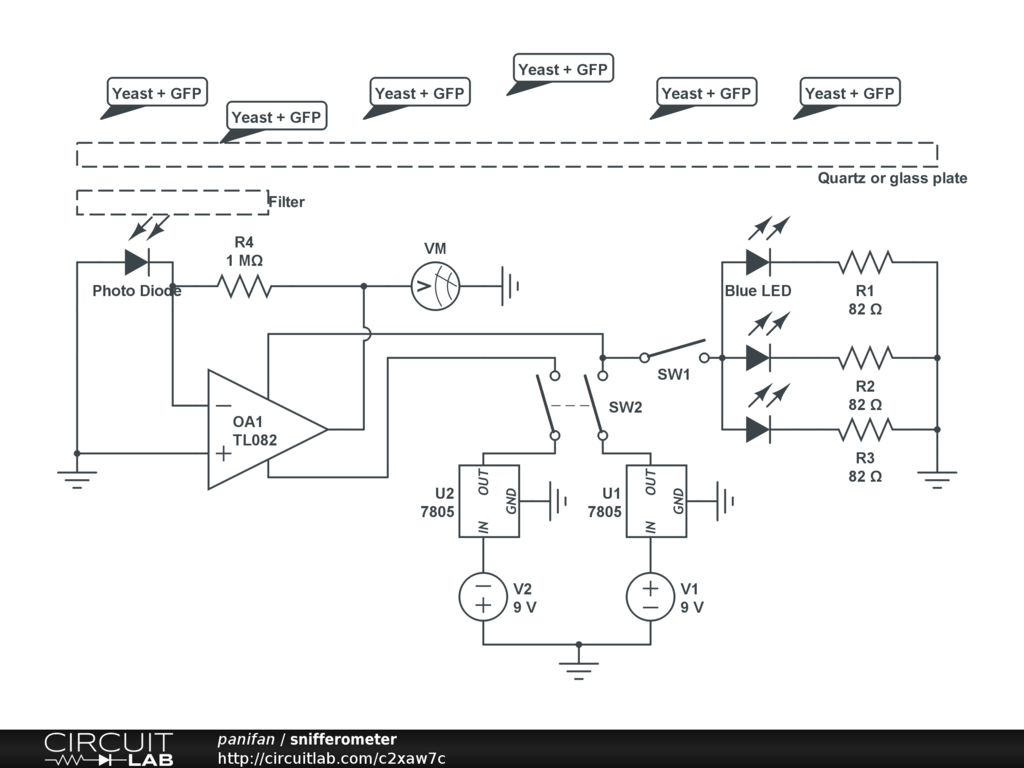
The photodiode converts the light intensity into small current, and op amp is needed to amplify the small current signal.
Click to see the component sheet, in which the price is also included. In the sheet, the cost is around 30 euros in the case of volume production. We can make the price as little as 4 to 10 euros if considering the possible lowest price.
Wavelength
In Snifferomyces, we use EGFP as the output. By looking up in the [http://flowcyt.salk.edu/fluo.html Table of Fluorochrome], the peak excitement and emission wavelengthes of EGFP are known, which are 488nm and 507nm respectively.
LEDs were chosen to emit light that would excite the EGFP efficiently, thus [http://media.digikey.com/pdf/Data%20Sheets/Optek%20PDFs/OVLFB3C7.pdf Blue LEDs] are chosen with the dominant wavelength of 470nm.
The photodiode is working as a detector. Because we only care about the existence of emission light with less disturbance of excitement light. A photodiode was chosen that would detect the output with less overlap of the LED spectrum. And the responsivity spectrum of the chosen photodiode can be seen [http://www.marktechopto.com/products/datasheet/MTD5052W here].
However, it can be seen that there is still wavelength overlapping from 450 to 500nm between LED spectrum and photodiode spectrum, and photodiode basically works as detector with low accuracy in wavelength filtering. Thus a external high-pass filter is needed which has a clear cutoff frequency around 500nm. In the test, two filters were used to give a comparison:
- Filter 1: [http://www.leefilters.com/lighting/colour-details.html#768 LEE Filters 768 Egg yellow].
- Filter 2: [http://www.leefilters.com/lighting/colour-details.html#101 LEE Filters 101 yellow].
Test
Since the fluorescence signal emitted from yeast is not very strong to reach the sensitivity of our prototype, the E.coli with TagGFP2 overexpression is then used to test the feasibility of our device. TagGFP2 has 483nm and 506nm for its excitement and emission peak wavelength which is similar with EGFP.
Eppendorf tubes are used to contain the liquid. The Control sets are M9 medium with E.coli, while the Test sets are M9 medium with E.coli overexpressing TagGFP2. M9 medium is used because it has low autofluorescence.
The data of Test sets are higher than these of Control sets, which means Snifferometer is capable to detect the glowing GFP. Moreover, the data also shows Filter 2 is better than Filter 1, since its passing high wavelength is overlapping more with the responsivity spectra of photodiode.
In conclusion, the idea of building a Snifferometer is feasible. However, there is still room for improvement because the sensitivity of the device is not so satisfactory. Some suggested ways include:
- Reduce light intensity of background. For example, the material of Snifferometer cap can be made with black coarse surface instead of smooth blue, so the reflection of background can be reduced.
- Increase green light intensity
- Enhance the sensitivity of the circuit, such as increase the feedback resistor of op amp.
- Enlarge the area of fluorescent: in the test, limited by suitable container, Eppendorf tubes were used, which has a small area to reflect and glow light. We can enhance the received signal for example by using petri dish or plate.

 "
"


