Team:NTU-Taida/Result/Secretion-CPP
From 2012.igem.org
Secretion: CPP
Contents |
Method
This is the method we used to test our secretion system, mainly on the three signal peptide candidates. These three signal peptides were attached to the main target proteins, the cell penetrating peptide(CPP).
In order to detect the CPP we want the bacteria to secrete, besides the signal peptides, we also attached the FLAG-tag (sequence: DYKDDDDK)to these peptides. Then we used the anti-FLAG mouse antibody(0.005μg/mL Sigma F3165) as the primary antibody and the diluted anti-mouse goat antibody(0.04μg/mL, Santa Cruz sc-2005)as the secondary antibody. The results will give you information in two prospective, first, the darkened level and second, the darken area. The more darkened or the bigger the dot is, the higher concentration is. After we collected our data, we used Image J software to acquire the secreted/ total peptide amount ratio by having the ratio of extracellular peptide over total soluble peptide of each signal peptide, indicating the efficiency.
All of the above peptides are then synthesized de novo in DNA sequences, and then linked with BBa_J04500.
Protocol
In this method, we used antibody to recognize the peptides secreted by the bacteria. First, we cultured the E. coli K-12 bacteria, either DH5αor BL-21 strain, 37℃, overnight (16 hours). By the spectrometer, we defined the cell density by its OD600 value over the culture media (Lysogeny Broth, LB) blank. When all the bacterial cultures reached similar cell density level, either 0.6(implying the bacterial growth is at its log phase) or 1.0(implying the bacteria has almost grown to its maximum density), we centrifuged down the bacteria at 4℃, 12000 rpm for 5 minutes. The supernatant will be the fluid of extracellular environment, the place we want our products to be secreted to. Then we used the centrifugal vacuum pump to increase the concentration of extracellular fluid at 37℃. This gave us the 50 fold more concentrated extracellular fluid sample. The pellet, on the hand, will be the bacteria sample. They went through either sonication or liquid nitrogen to lyse the bacteria. After preparing the samples, we added 2 fold concentrated sample buffer, heated the samples to 95-99℃ to denature the peptide, letting the SDS molecule stretch the peptide to its linear form. We then used PVDF membrane to catch the peptide by electrostatic force. The membrane was first activated by methanol and hydrated by ddH20. We then put our sample on the membrane in dots(2 μL), blocked the other places on the membrane by 5% low-fat milk in Phosphate Buffered Saline with 0.00001% Tween 20(PBST) solution for 5 minutes. After wash out the milk by PBST for 30 minutes, we applied the primary antibody for either room temperature, 1 hour or 4 ℃ overnight, then we washed the membrane by PBST for three times, each time 10 minutes. In the next step, we applied 2nd antibody for 1 hour at room temperature. After the final three times wash with PBST, we used either the X-ray film or the luminescence detector to see the result.
Result
Signal Peptide-CPP-FLAG secretion
We conducted several dot-blotting tests for the SPn-CPP-FLAG peptides. Following were the results:
On the first test, we followed the original protocol we borrowed from bacterial cytosol dot blotting protein analysis. This gave us some data of protein insoluble/soluble proportion inside the bacteria. We later re-modified the protocol and start to collect extracellular fluid.
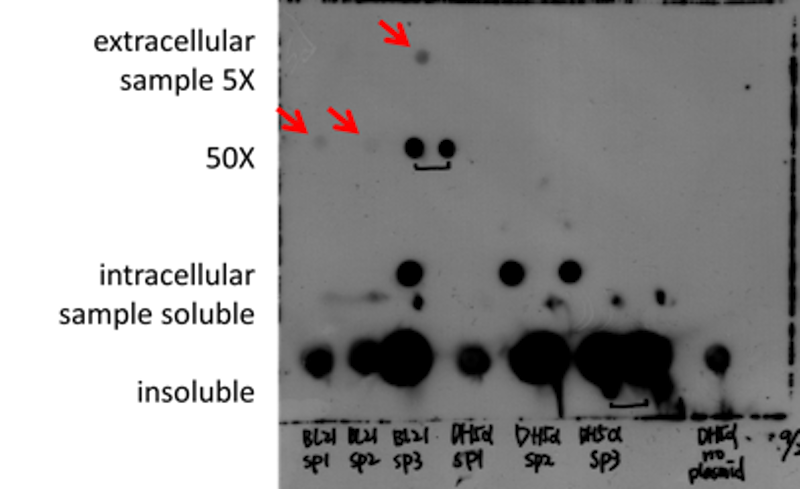
In the second test, we want to mention the result of protein extracellular/intracellular distribution proportion. You can see if the secretion signal peptides work or not by a glimpse of the film below.
※The two black dots in the second row, column four and five, were the same samples(BL21,SP3) being put twice, same as the six and seven dots(DH5α,SP3) in the fourth row.
As you can see from above, the samples were lined up in a 7×4 square. From the top row, they were the 5 fold concentrated extracellular fluid samples, then the 50 fold concentrated extracellular samples, and intracellular soluble and insoluble samples. From the column, left to the right, the samples were lined by the different E. coli K-12 strain, BL-21 and DH5α, those different signal peptides they produced and the negative control (E. coli K12 and DH5α without plasmid, all the negative controls went through same procedure like the samples and were placed in perfect column from top to down) .
The first and second row implied that the signal peptides all worked out, the CPP-FLAG peptides were successfully secreted to the extracellular environment. The SP3 even had a higher productivitythan SP1 and SP2. The need of concentrating the extracellular fluid sample is due to the minimal limit this dot-blotting condition can sense.
The second and third row, when comparing, indicated an idea like efficiency. Both the samples here were soluble, diffusible peptides the bacteria produced. In our theory for secretion system, they were the peptide that can be secreted. The relative darkened density and area of the first row and second row informed us the relative concentration of peptides of being secreted out and who had not. By applying the Image J software, we acquired an index of the average brightness of the dots. Then, by calculating the ratio between 1 over brightness index of the extracellular fluid samples and the 1 over brightness index of total soluble peptide, we can have the efficiency as follow.
The last two rows, also told us important information about our secretion system: the peptides we produced are mostly presented in insoluble form within E.coli, which indicates potential overexpression of the product and a need for a more efficient conditional finding. Overexpression might cause the peptide products forming inclusion body right after transcription, in this case, they would not be able to go through the inclusion body membrane and they would stay in insoluble form. To solve this inefficiency, we later found more papers about secretion optimization.[1][2][3].We decided to use glycine and Triton X-100 to stimulate the secretion efficiency. We designed them into four testing groups: control(in normal LB culture condition), glycine supplement group, Triton X-100 supplement group and both glycine and Triton X-100 supplement group. The first attempt failed, because those bacteria cultured in any media with 1% glycine grew in a very wide range, ranging from nothing to an OD600 near 1.0000. On the second trial, we lowered the concentration of glycine to 0.5%, and after 16 hours of culture, we had these all samples cell density high enough to conduct the dot-blotting. The result is as follow:
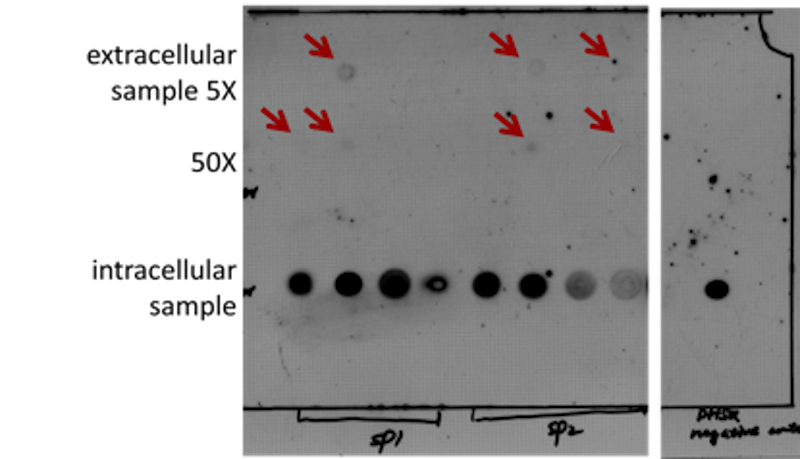
※The result on the left side is the two SP1 and SP2 peptides. This figure was cut because the other tests within the middle were irrelevant to this secretion test. The left figure is the negative control we applied on that experiment, the darkened area might be due to the membrane structure disrupting when loading the sample.
There are three rows in this result. Row one and two were the 5 fold concentrated and 50 fold concentrated extracellular samples. The third row was the intracellular samples, both soluble and insoluble, mixed. In each group, SP1 or SP2, the samples were loaded in control, 0.5% glycine-added, 0.5% Triton X-100-added and the group adding both.
In SP1 group, the control and the glycine-added group had the SP1 secreted out successfully, even though the amount was low. The SP2 group also showed positive results on glycine-added and glycine/Triton X-100 added groups, but the control group did not show any obvious dot, maybe due to the minimal sensitivity issue.
By the same analysis we did to the last figure, we can also count the secretion efficiency by the Image J software. The result is as follow:
The glycine we added improved the efficiency as the reference indicated, but still, the efficiency was not very good. Further researches are needed.
Further study are needed, for both optimizing the condition of secreting and more quantitative testing. Maybe C-18 SPE column and immune-percipitation can be used to better concentrate the samples. Western or Mass spectrometry can be also applied to better identification.
Reference
- ZHAO-FENG LI et al, Calcium Leads to Further Increase in Glycine-Enhanced Extracellular Secretion of Recombinant r –CyclodextrinGlycosyltransferase in Escherichia coli, J. Agric. Food Chem.57, 6231–7, 06 2009
- BerhaneTeklehaimanotTesfai et al, Strategies for Enhancing Extracellular Secretion of Recombinant CyclodextrinGlucanotransferase in E. coli, ApplBiochemBiotechnol167:897–908, 12 2012
- Zhaofeng Li et al, Delayed supplementation of glycine enhances extracellular secretion of the recombinant α –cyclodextringlycosyltransferase in Escherichia coli, ApplMicrobiolBiotechnol, 08 2009
 "
"


