Team:NTU-Taida/Modeling/2D-3D-Combined
From 2012.igem.org
2D & 3D Combined Model
With the single cell model, fatty acid reaction-absorption model, and system analysis, we have verified the filter function of our circuit, simulated the real physiological fatty acid level at intestinal wall, and adjust our filter threshold to fit to the real condition. Next, we want to combine them together and see what would happen when we put cells in the intestine after a fatty meal.
The combined model is composed of three different sections. 2D combined model simulates the GLP1 response of Pepdex E-coli cells after the food intake in the x-y cross-sectional plane. 2D Cell population response model further considers the possible uneven concentration of fatty acid along the z-axis due to non-uniform distribution of lipase and simulates how the quorum sensing system assists our system to overcame this possible limitation and enhance the response. Finally, 3D Cell population response model incorporates all the consideration to generate a full model to visualize the dynamic behavior of our system.
2D Combined Model
So far, we have the spatial-temporal concentration of fatty acid, and cells with suitable threshold. In this model, we want to see what would happen when we put cells in the intestine after a meal.
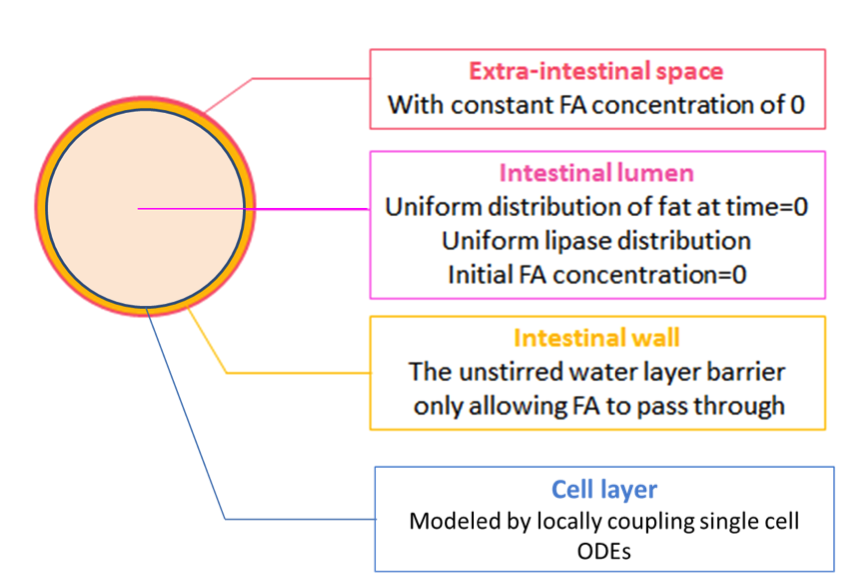
We achieve this by further coupling the single cell ODEs (with parameters adjusted by system analysis) locally to the fatty acid reaction-absorption model at the intestinal wall, as shown in Figure 2.
Besides to see the cell response when combined with the environmental input, we also want to simulate the prolonged effect of the quorum sensing module with physiological input. Therefore, we simulate system with and without quorum sensing modules and compare their results.
The equations used in our 2D combined model mainly come from the reaction-absorption model and the single cell model. The following three equations are the same as those in the reaction-absorption model, which simulates the change in fatty acid concentration in time and space.
$$\frac{d fat}{d t} = -\frac{k_{cat}[E]_t\cdot[S]}{K_m + [S]}$$
$$\frac{d FA}{d t} = 3 \cdot {k_{cat}[E]_t\cdot[S]}{K_m + [S]}$$
$$J=(C_1 - C_2)(D_{FA}/d)$$
Other equations in the model are almost the same as those derived in our single cell model, with slightly difference in those for AHL, which will be discussed thoroughly in the 2D Cell population response model. The equations are shown as below.
TRY TO TYPE YOURSELF FOLLOWING THE EXAMPLE ABOVE
 "
"


