Team:Bielefeld-Germany/Labjournal/week5
From 2012.igem.org
Contents |
Week 5 (05/28 - 06/03/12)
Monday May 28th
- Team Student Academy:
- Made liquid cultures of E. coli KRX with [http://partsregistry.org/Part:BBa_J04450 BBa_J04450] and with [http://partsregistry.org/Part:BBa_J23100 BBa_J23100]. Result: Intense red fluorescence. We made a glycerol stock and a plasmid isolation
- Team Cloning of Bacterial laccase:
- Digest of ecol(T7)_HIS, xccl(T7)_His and bpul(T7)_His and [http://partsregistry.org/Part:BBa_J04450 BBa_J04450] (pSB1C3 + RFP) with the same restriction enzymes, ligation of the digested products and transformation in E. coli KRX cells.
- Since we have less bpul(T7)_His and tthl(T7)_His DNA, we set an PCR from the remaining PCR approach.
Tuesday May 29th
- Team Student Academy:
- E. coli Mach1 with pMTE cp46 His received from the working group “Fermentation Engineering”, University Bielefeld. Plasmid contains genes for GFP and kanamycine resistance. We plated it and made a liquid culture at 37°C. Result: There was an intense fluorescence. We made a glycerol stock and a plasmid isolation.
- Team Cloning of Bacterial Laccases:
- We did colony PCRs on the transformations from the day before. We got product for every transformation approach so we plated the positive colonies on new plates to make plasmid isolation. So hopefully in some days we have the plasmids with the E. coli laccase, the Xanthomonas campestris laccase and the B. pumilus laccase with the inducible T7 promoter and a His-tag.
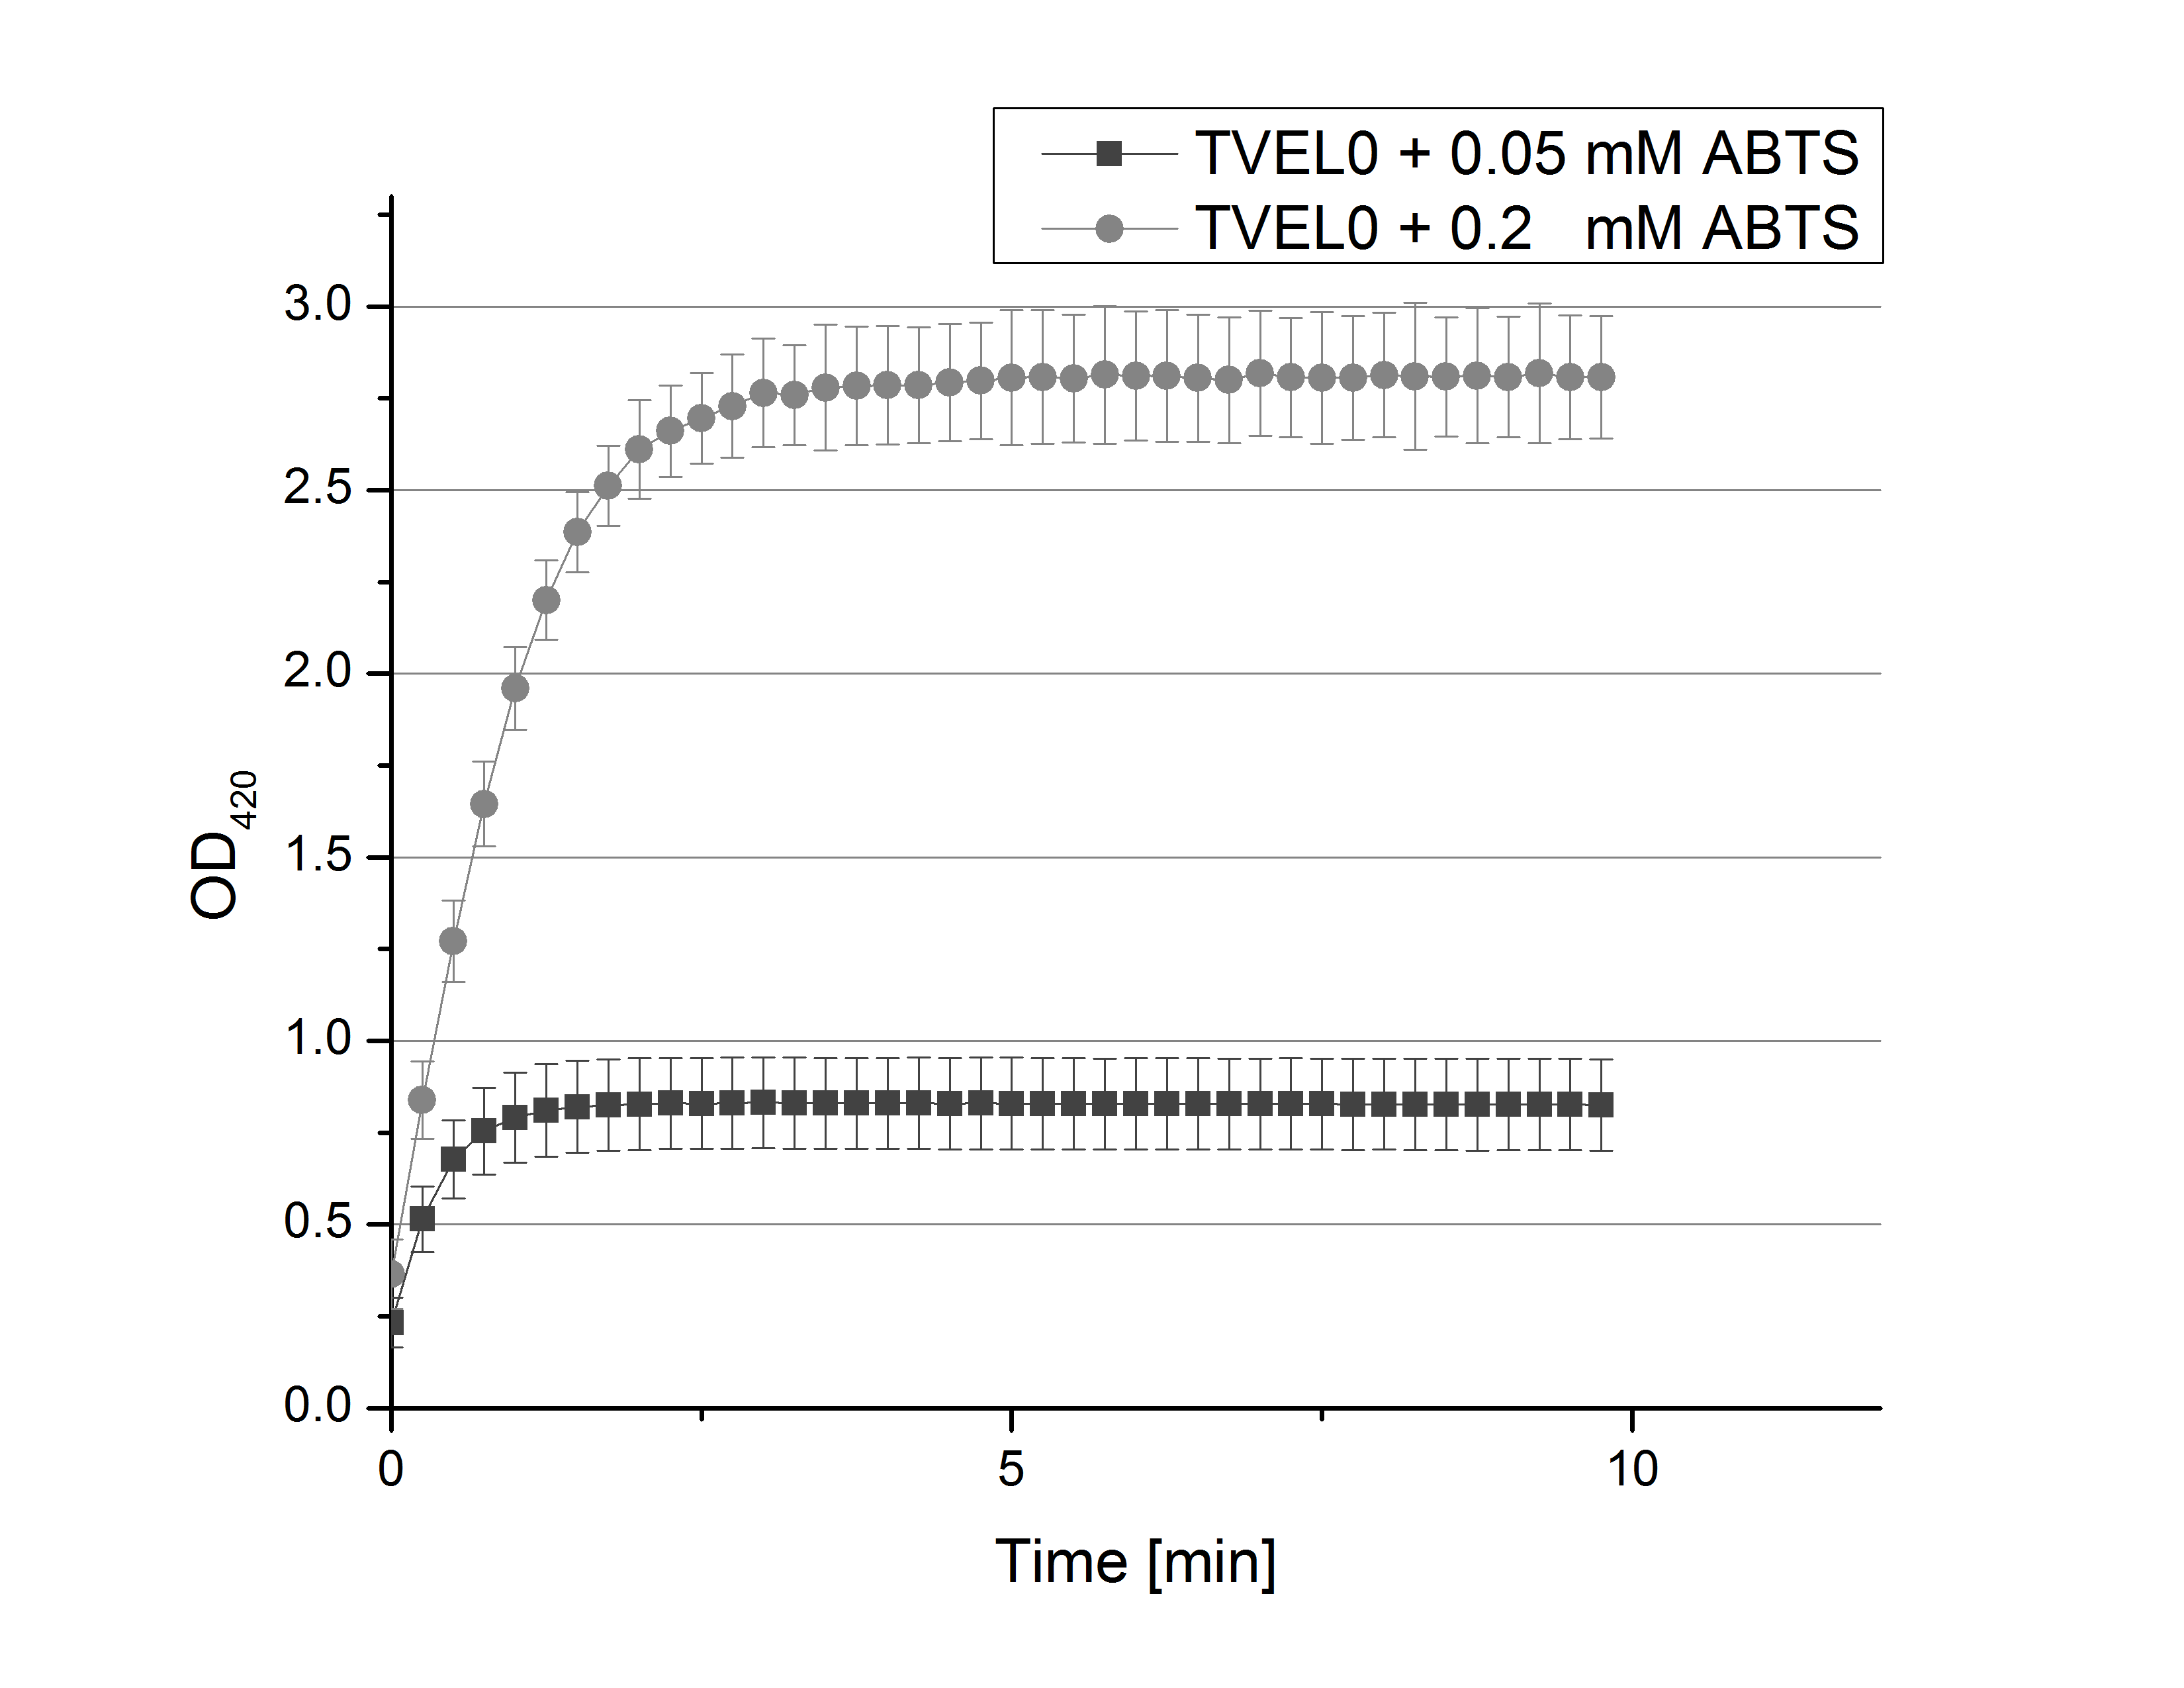
- Team Activity Tests: After establishing our recipe for activity measurements we were curious about different ABTS concentration and wanted to make sure we took the right one for our approach. With this in mind we did our activity measurement with 0.1 U TVEL0 laccase, 100 mM sodium acetate buffer (pH 5), ad 200 µl H2O dest., but with two new ABTS concentrations, namely 0.2 mM and 0.05 mM ABTS (see Fig. 1). It turned out that using 0.05 mM ABTS leads to a low maximum of saturation but reaches it quickly. With 0.2 mM ABTS the opposite occurs: the activity curve is saturated at a OD420 of ~2.7 but it needs more time to reach its maximum. Knowing this we are happy using 0.1 mM ABTS because it is saturating slowly and the maximum is not too high. 0.1 mM ABTS is therefore established!
Wednesday May 30th
- Team Cloning Bacterial Laccases:
- After plasmid isolation we digested our plasmids with NotI to see if the colony PCR was correct and our laccases are in the backbone. The agarose gel showed that for all of the different plasmids we had at least one plasmid with two DNA bands on the correct height in agarose gel.
Thursday May 31st
- Team Cloning of Bacterial laccase:
- We sent the isolated pSB1C3 plasmids with xccl(T7)_His, Bpul(T7)_HIS and Ecol(T7)_His for sequencing.
Friday June 1st
- Team Activity Test: Today we prepared for our next measurements by setting up the sodium acetate buffer in different pHs. We choose to test the activity of TVEL0 in a pH-Gradient of 1,2,5,7 and 9.
Saturday June 2nd
Sunday June 3rd
- Team Cloning of Bacterial Laccases:
- PCRs of genomic DNA on bhal from B. halodurans C-125 we ordered from [http://www.dsmz.de/ DSMZ] before. We handled the cells in the same way we did with T. thermophilus before and soluted the lyophlized cells in water and boiled them before PCR. After PCR we cleaned up the product with gel electrophoresis and PCR clean-up kit. However the DNA amount was so low that we had to do the PCRs again.
| 55px | | | | | | | | | | |
 "
"


