Team:TU-Delft/Modeling/SingleCellModel
From 2012.igem.org


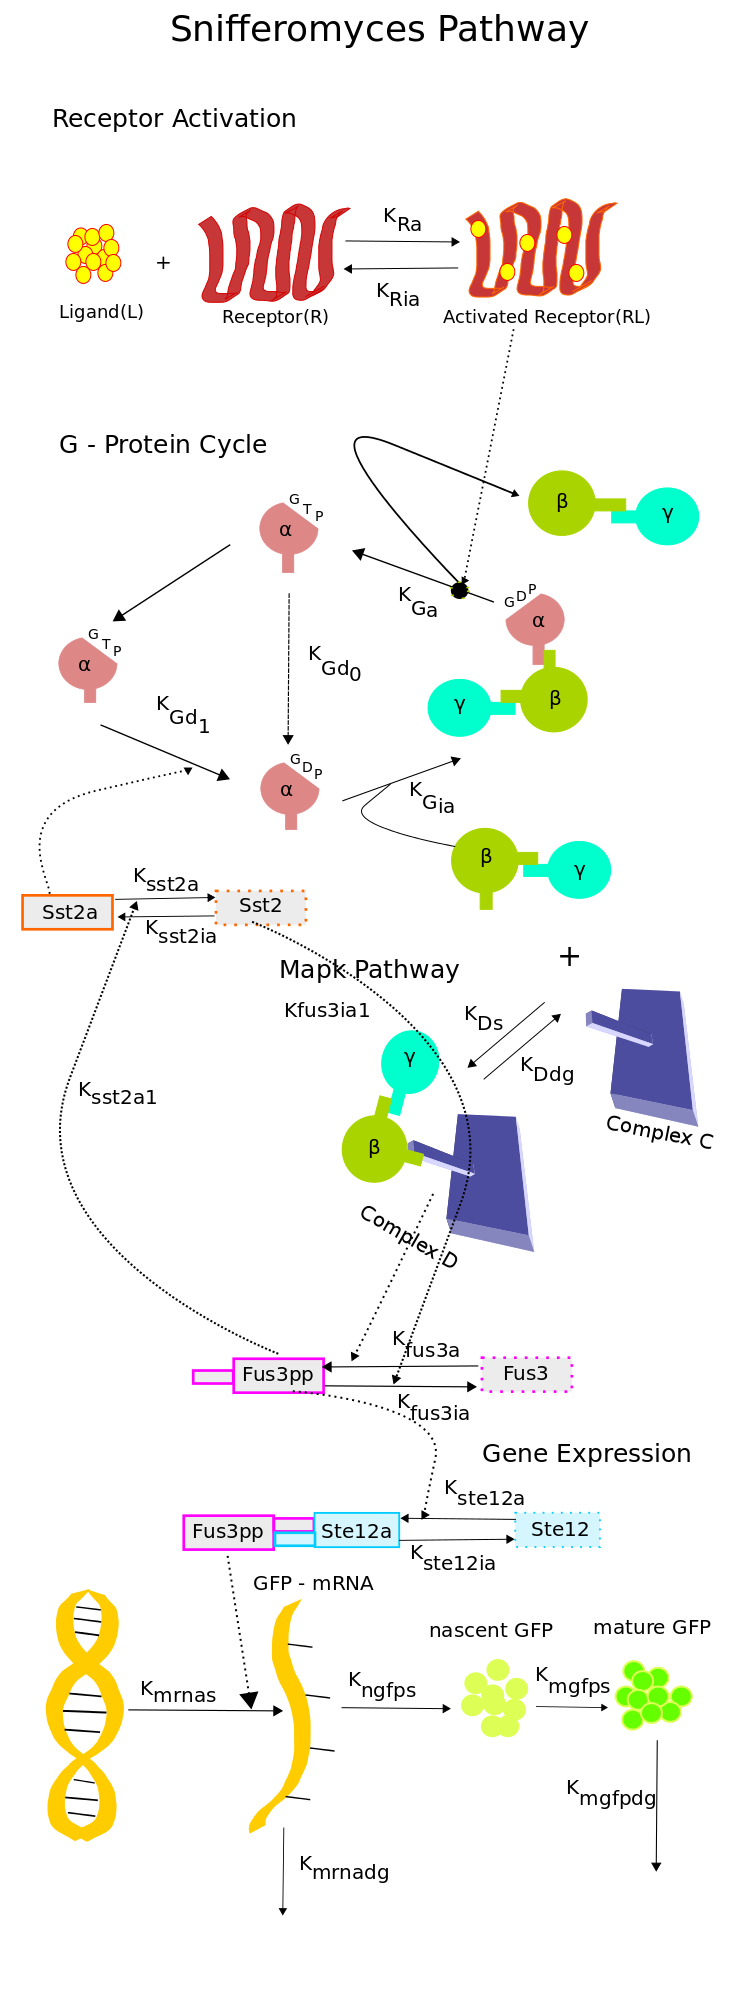
The single-cell pathway model of our system is composed of 4 modules, which are responsible for routing the signal from the receptor to the GFP sythesis. The modules modelled in the model are,
- Receptor activation module : This module acts as the sensor, it models the ligand and the receptor which detects the presence of ligand.
- G-Protein cycle : It channels the sensed information from the sensor to the MAP kinase cascade.
- MAP kinase cascade : The MAP kinase cascade is responsible for the activation of Ste12 which acts as the transcription factor for the FUS1 gene which is responsible for the production of the green fluoroscent protein.
- Gene Expression module : Which on the detection of the ligand produces the green fluroscent protein, which is the output of our system.
The single cell pathway model helped us understand in detail if and how our synthetic circuit works, and also helped us understand how the input concentration was related to the concentration of the input substance. Using the model we were able to predict the time taken for the expression of the green fluoroscent protein and how the concentration of GFP varies with different input concentration.
The mathematical models were developed on a scheme favoring the temporal order of processes, based on the current understanding of the pheromone signalling pathway from [1][2][3] and also on the feedback received from the experimentalists on the expected behaviour of the pathway.
In the models developed certain assumptions were made due to the lack of data available on the new modified pathway and also due to the time constraints of iGEM which limits the range of experiments that can be carried out. The assumptions made are listed below.
- The rate constants and initial concentrations obtained from the literature are assumed to be the same for the new modified pathway.
- The behaviour of the Ligand is assumed to be similar to the behaviour of the alpha pheromone.
- The receptor is assumed to behave similar to the alpha-pheromone receptor.
Contents |
Initial Models
Two intial models were studied from the literature to get an initial idea of the behaviour of the pathway. The description, analysis and the key conclusions from these studies are presented below
Model of the G - Protein cycle
The G - protein cycle is one of the key modules of the of the pathway as it is reponsible for the production of free G-beta-gamma dimer which is crucial for the activation of the MAP kinase cascade.
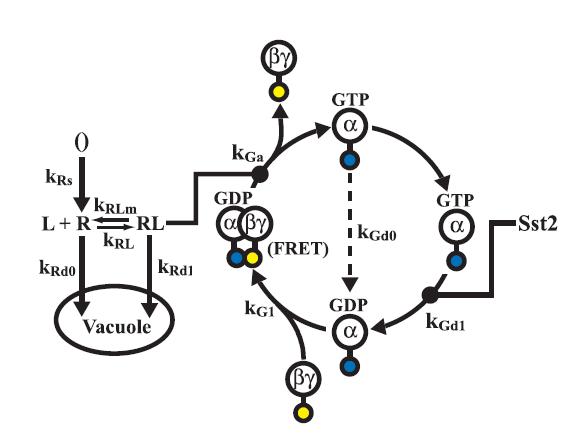
The model was used to analyze two key effects
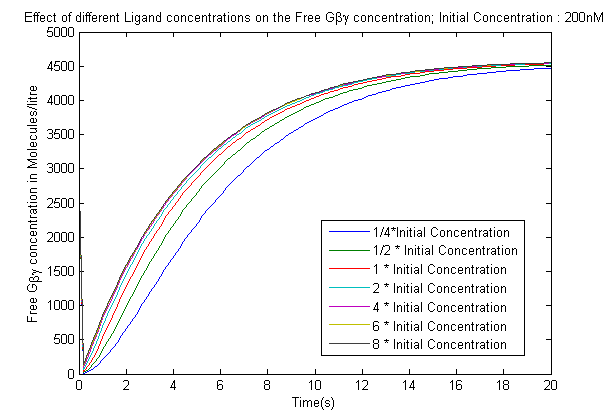
- The effect of varying the ligand concentration on the concentration of the free G-beta-gamma dimer.
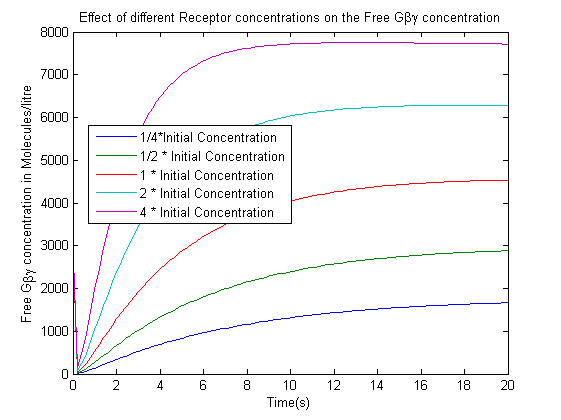
- The effect of varying the receptor concentration on the concentration of the free G-beta-gamma dimer.
The results are presented below
conclusions
The following conclusions can be drawn from the analysis
- The increase in the Ligand concentration also leads to an increase in the Free-G-beta gamma concentration, but after it crosses a threshold(2microMolar) the output saturates which is crucial as it gives a range of inputs that needs to be used in the experiments conducted.
- The increase in the receptor concentration leads to an increase in the Free-G-beta gamma concentration.We are not concerned with the actual concentrations in this case as controlling the exact concentration of the receptor would have been difficult in the time scale of an iGEM project. The data suggested the use of a strong promoter which would produce high quantities of receptor.
limitations
The model well represents the characteristic of the G-Protein cycle but does suffers from two crucial limitations
- It does not capture the dynamics of the MAP Kinase cascade.
- It did not contain the gene expression module which is the output of our system.
These limitations motivated us to explore other models.
Model of the Yeast Pheromone Response
The second model we studied was the model of the yeast pheromone response by Kofahl and Klipp [2]. This model was more detailed and captured well the dynamics of the MAP kinase cascade which the model by Yi.et al failed to do[1]. The activated Ste12 concentration was crucial as it acts as the transcription factor for the synthesis of GFP. So we analyzed two different scenarios concerning this,
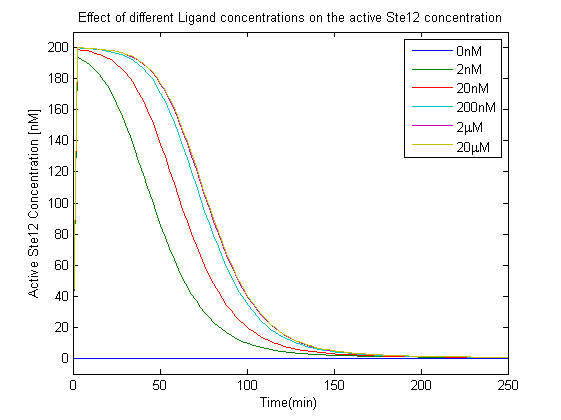
- The effect of different Ligand concentration on the concentration of the active Ste12.
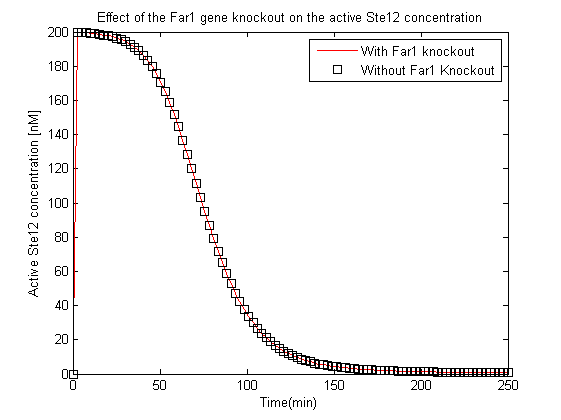
- The experimentalists suggested the knockout of Far1 gene to prevent cell cycle arrest, the effects of this were also tested using this model by analyzing the variation of the active Ste12 concentration with and without the knockout.
The rates and reactions used in the model can be found [http://www.ebi.ac.uk/biomodels/models-main/publ/BIOMD0000000032/BIOMD0000000032.pdf here].
conclusion
The following conclusions can be drawn from the plots
- The increase in Ligand concentration also leads to an increase in active Ste12 concentration, but saturates for concentrations greater than 2 microMolar, this effect was also observed in the saturation of the G-beta-gamma concentration in the analysis of the first model, which further validates the choice of the input range selected in our experiments.
- The linear increase in the active Ste12 concentration along with increase in the ligand meant that as we increased the ligand concentration more GFP would be produced. These observations were crucial in terms of the device that we plan to implement for TB detection.
- The second most crucial observation was that the Far1 gene if knocked out would not affect the concentration of the active Ste12.
These results helped determine the range of inputs that needed to be applied in the experiments and also helped conclude that the proposed knockout of the Far1 gene would not impact the GFP synthesis.
limitations of the initial models
Though the initial models were useful in providing a good understanding of the pathway and the various effects associated with it, their further use for our project suffered from the following limitations
- The model of the G-protein cycle lacked the description of MAP kinase cascade and the gene expression module.
- The model of the yeast pheromone response on the other hand had a detailed description of the pathway but had two drawbacks, it did not incorporate the gene expression module and more importantly was too complex in terms of the number of parameters that were present in the model (36 Specied, 47 rate constants)
- Fitting the limited data available from the experiments to the highly complex pathway model in [2] we felt would not be feasible.
These limitations motivated us to build a reduced order model of the pathway along with incorporating the gene expression module.
Reduced Model of the Snifformyces (Modified Yeast) Pathway
To overcome the limitations suggested in the previous section, we constructed a new reduced order model of the pathway which had 18 species and 21 rate constant, which when compared to the 37 species and 47 rate constants of the model in [2] was a significant reduction.To construct the model a mechanistic approach was taken. Combining the knowledge from [1] and [2] and also using [3] and [4], we constructed the new model shown in the schematic.
The key features of the model are as follows,
- The Receptor activation & the G - Protein cycle was retained from [1]. The ligand and the receptor degradation were neglected owing to the observation that, the receptors were placed under a constitutive promoter and ligand would not be digested by yeast.
- The simplified MAP kinase cascade was adopted from [3]. The MAPK pathway consists of a complex C to which the free G-beta-gamma dimer binds resulting in the activation of Fus3. The simplified structure captures the dynamics of the activated Fus3 in an efficient manner as can be seen in [3]. This simplification helped a great deal in eliminating the components of the pathway which were not crucial to our experiments. Since the only key components that were under our control were the ligand concentration, the promoter of the receptor and the Fus1-GFP promoter, we decided to retain the G-protein cycle in it's entirety and reduce the MAP kinase pathways to simple two stage reaction.
- The activation of Ste12 was adopted from [2].
- For the gene expression module, a reaction based model was used which was based on [4]. In this model, the mRNA synthesis is proportional to the concentration of activated Ste12 and the protein synthesis is proportional to the mRNA concentration. The protein synthesis is represented in two stages, the synthesis of nascent GFP which is proportional to the mRNA concentration and the synthesis of mature GFP which is proportional to the concentration of nascent GFP. The mRNA and mature GFP degradations are considered proportional to their concentrations.
For the initial analysis, the rates of this model until Fus3 activation were obtained from [3] in which the model was fit to the data from [5]. The Ste12 activation and deactivation rates were taken from [2]. The rates for the gene expression module were obtained from [4]. The initial model was first interpreted using deterministic semantics. The rates for which can be found here. Before the model could be used for prediction purposes, the parameters of the model needed to be fit to parameters from our experiments for which the analysis of the system parameters was crucial. The results for this analysis are available here.
Parameter Estimation
Parameter estimation was done as we needed parameters which were obtained from the data generated in our lab. Using the results from the sensitivity analysis, parameter estimation was performed to find the parameters of the model in order to fit the simulated data curves to the experimental data[Fus1-Pr-EGFP WT] in which the wild type cells were stimulated with 2microMolar concentration of alpha-pheromone. The data fitting was done by using the nonlinear regression function nlinfit in the Matlab statistical toolbox [6].
conclusion
The curve fitting provided a fairly faithful fit to the experimental data. The new rates can be found here. The model was then used for making predictions about the pathway.
Model Predictions
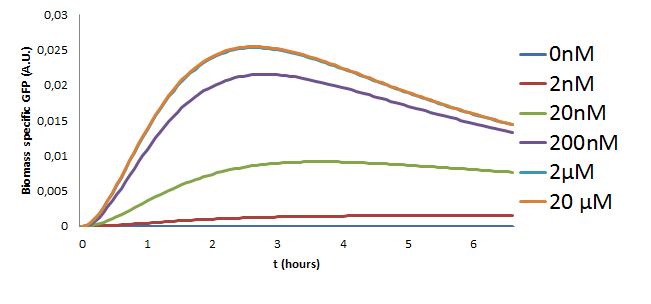
The model with the new estimated parameters was used to make predictions on the behaviour of the pathway for different concentrations of the Ligand that were to be used in the experiment. The model was simulated using the ode15s variable order solver from Matlab. The results of these simulations are in Figure 10.
Results
The following observations can be made from the plot about the behaviour of the pathway
- The GFP concentration increases with the increasing Ligand concentration but saturates for inputs greater than 2microMolar. This is a key observation since these results were also observed in the initial two models and was also verified experimentally in our project.
- Initial traces of GFP can be noticed around 20 minutes after stimulation of the pathway.
- The GFP concentration is at it's maximum at about 2 and a half hours.
- The last two results were also validated experimentally the results of which can be found in the wetlab page.
References
| Source | |
|---|---|
| [1] | [http://www.pnas.org/content/100/19/10764.full.pdf Tau-Mu Yi, Hiroaki Kitano, and Melvin I. Simon, A quantitative characterization of the yeast heterotrimeric G protein cycle, PNAS September 16, 2003 vol. 100 no. 19] |
| [2] | [http://onlinelibrary.wiley.com/doi/10.1002/yea.1122/pdf Kofahl B, Klipp E, Modelling the dynamics of the yeast pheromone pathway, Yeast 2004; 21: 831–850] |
| [3] | [http://www2.hu-berlin.de/biologie/theorybp/docs/bsc_supady.pdf Adriana Supady, Theoretical and computational analysis of negative feedback mechanisms and the dose-response alignment in the pheromone signalling pathway of the yeast Saccharomyces cerevisiae] |
| [4] | [http://www.nature.com/nature/journal/v456/n7223/full/nature07513.html Richard C. Yu1, C. Gustavo Pesce1, Alejandro Colman-Lerner1,Larry Lok1, David Pincus1, Eduard Serra1, Mark Holl, Kirsten Benjamin1, Andrew Gordon1, & Roger Brent1 Negative feedback that improves information transmission in yeast signalling, Nature 456, 755-761 (11 December 2008)] |
| [5] | [http://www2.hu-berlin.de/biologie/theorybp/docs/msc_supady.pdf Adriana Supady Mathematical modeling of synthetic logic gates in S.cerevisiae] |
| [6] | [http://www.mathworks.nl/help/stats/nlinfit.html Matlab nlinfit (Nonlinear Regression)] |
 "
"

