Team:Bielefeld-Germany/Results/coli
From 2012.igem.org
(→Since Regionals: ECOL pH optimum) |
(→Since Regionals: ECOL activity at different temperatures) |
||
| Line 279: | Line 279: | ||
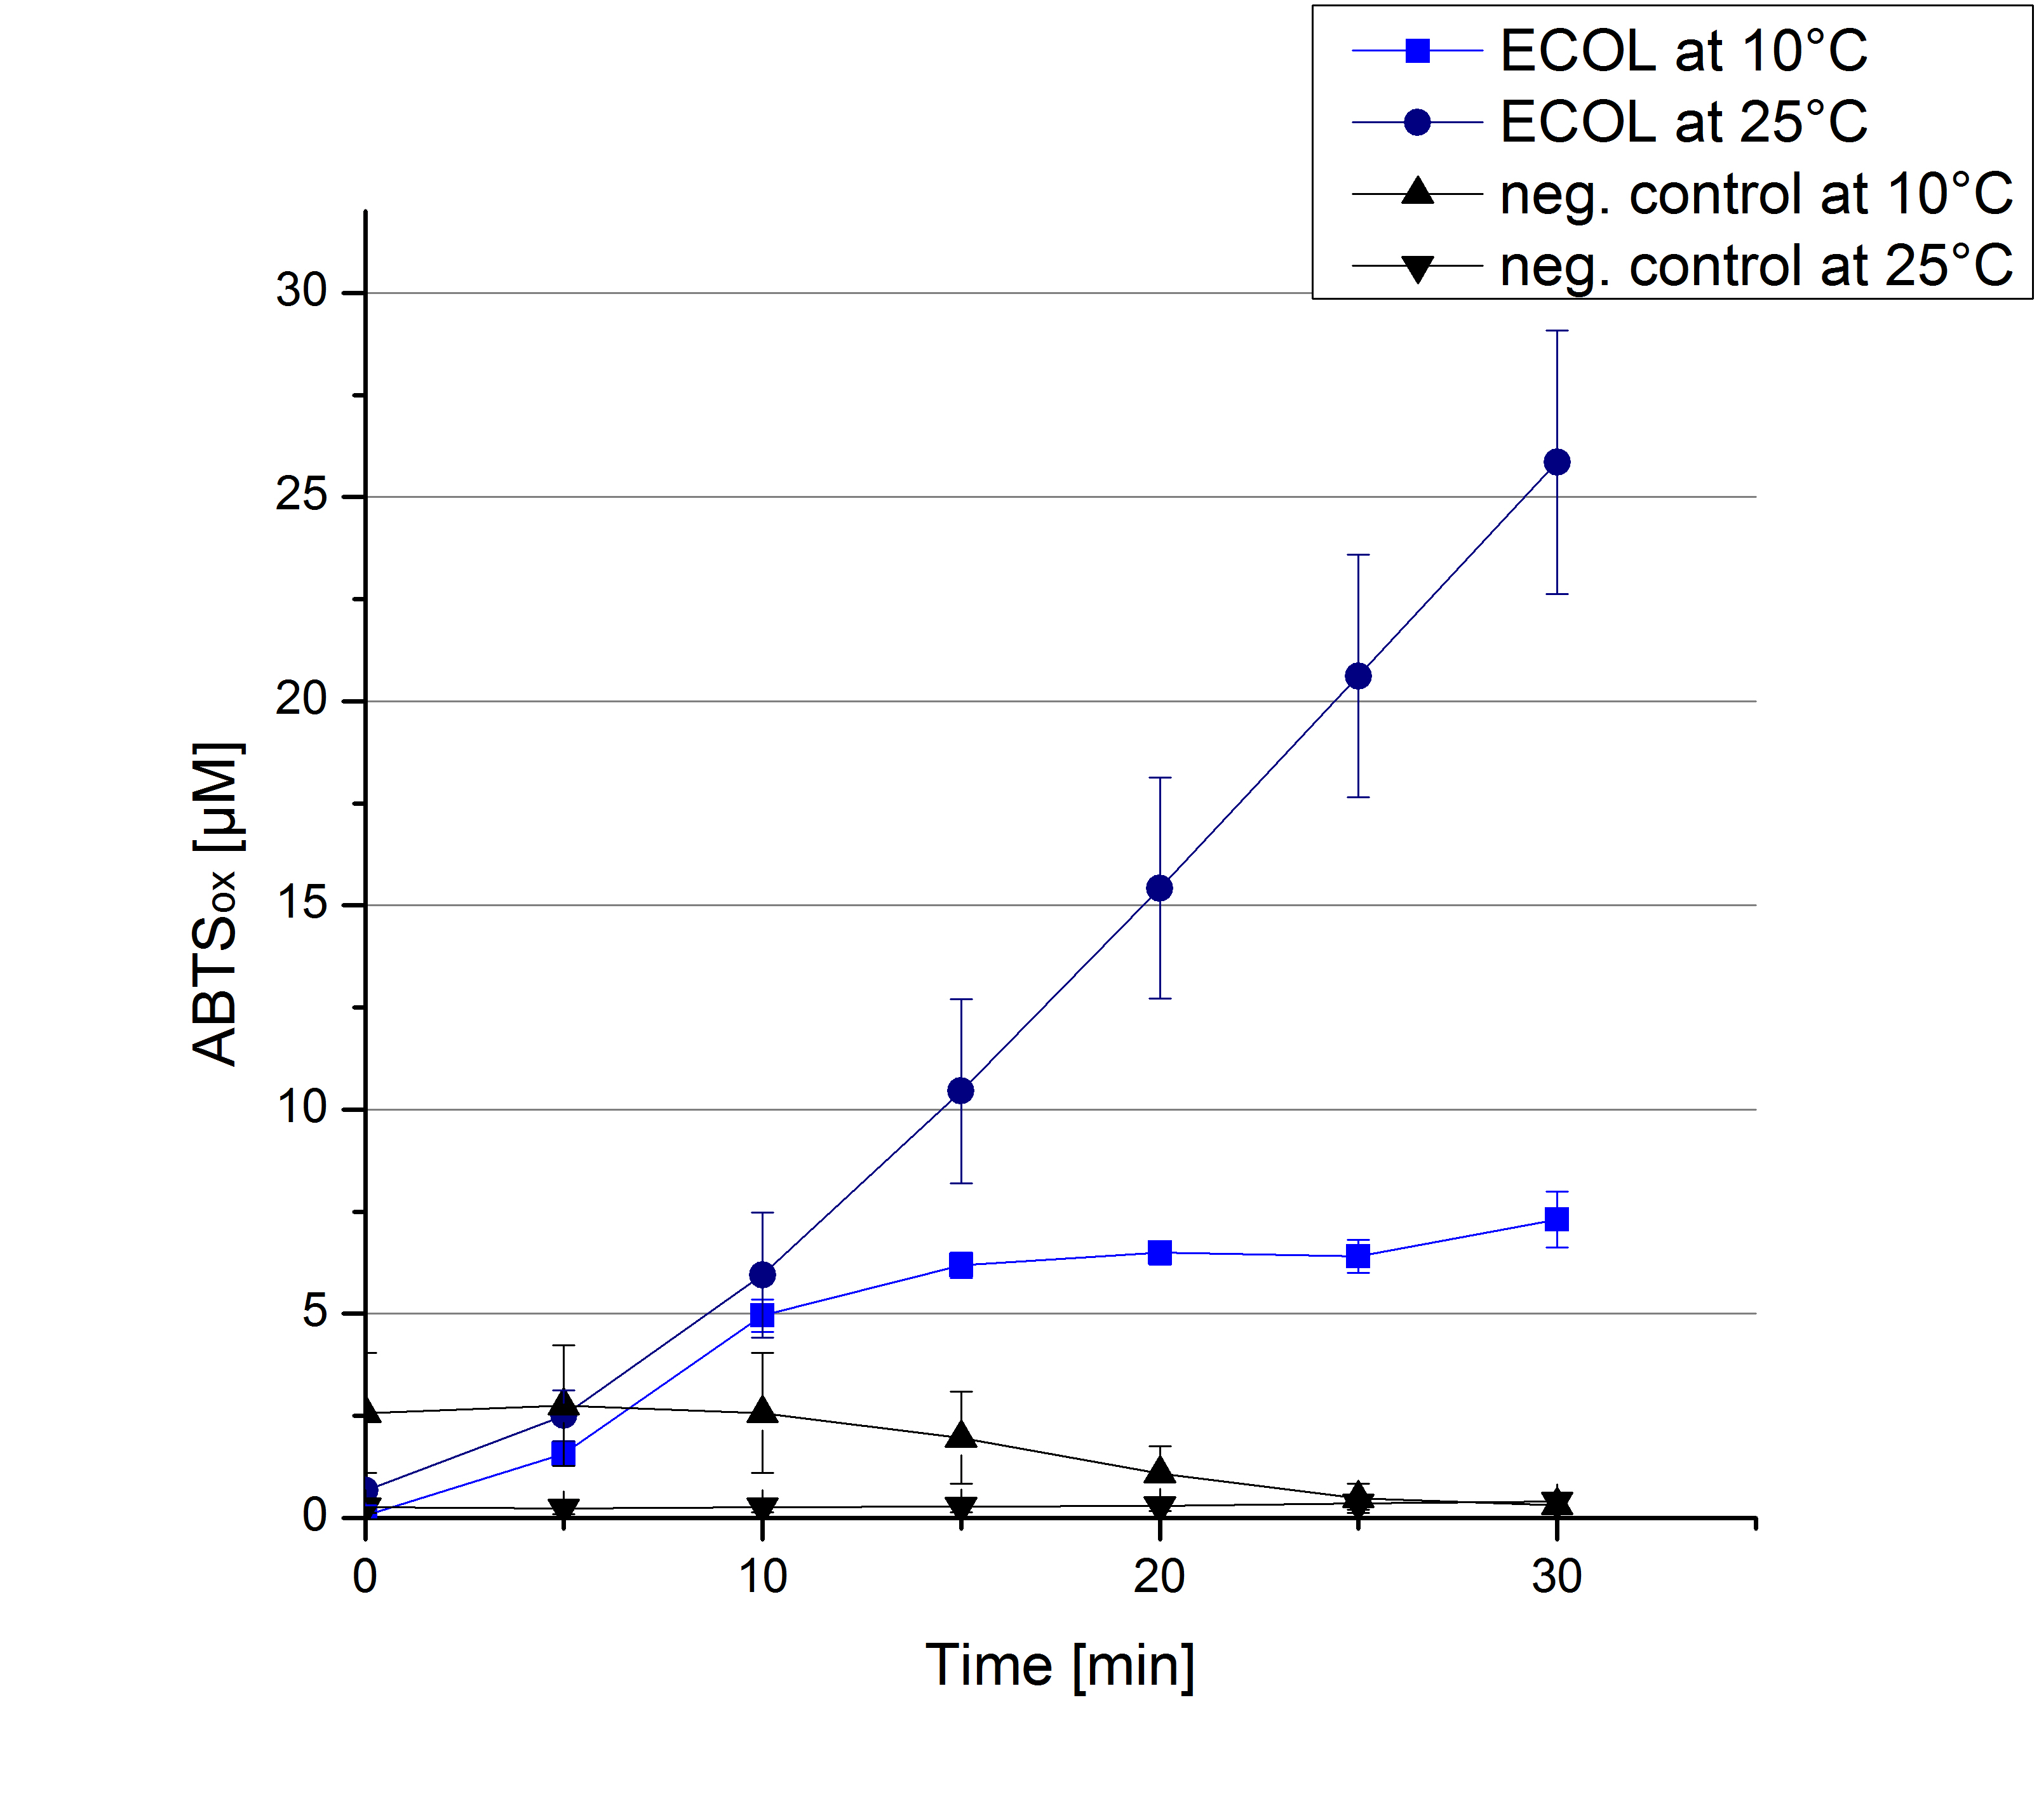
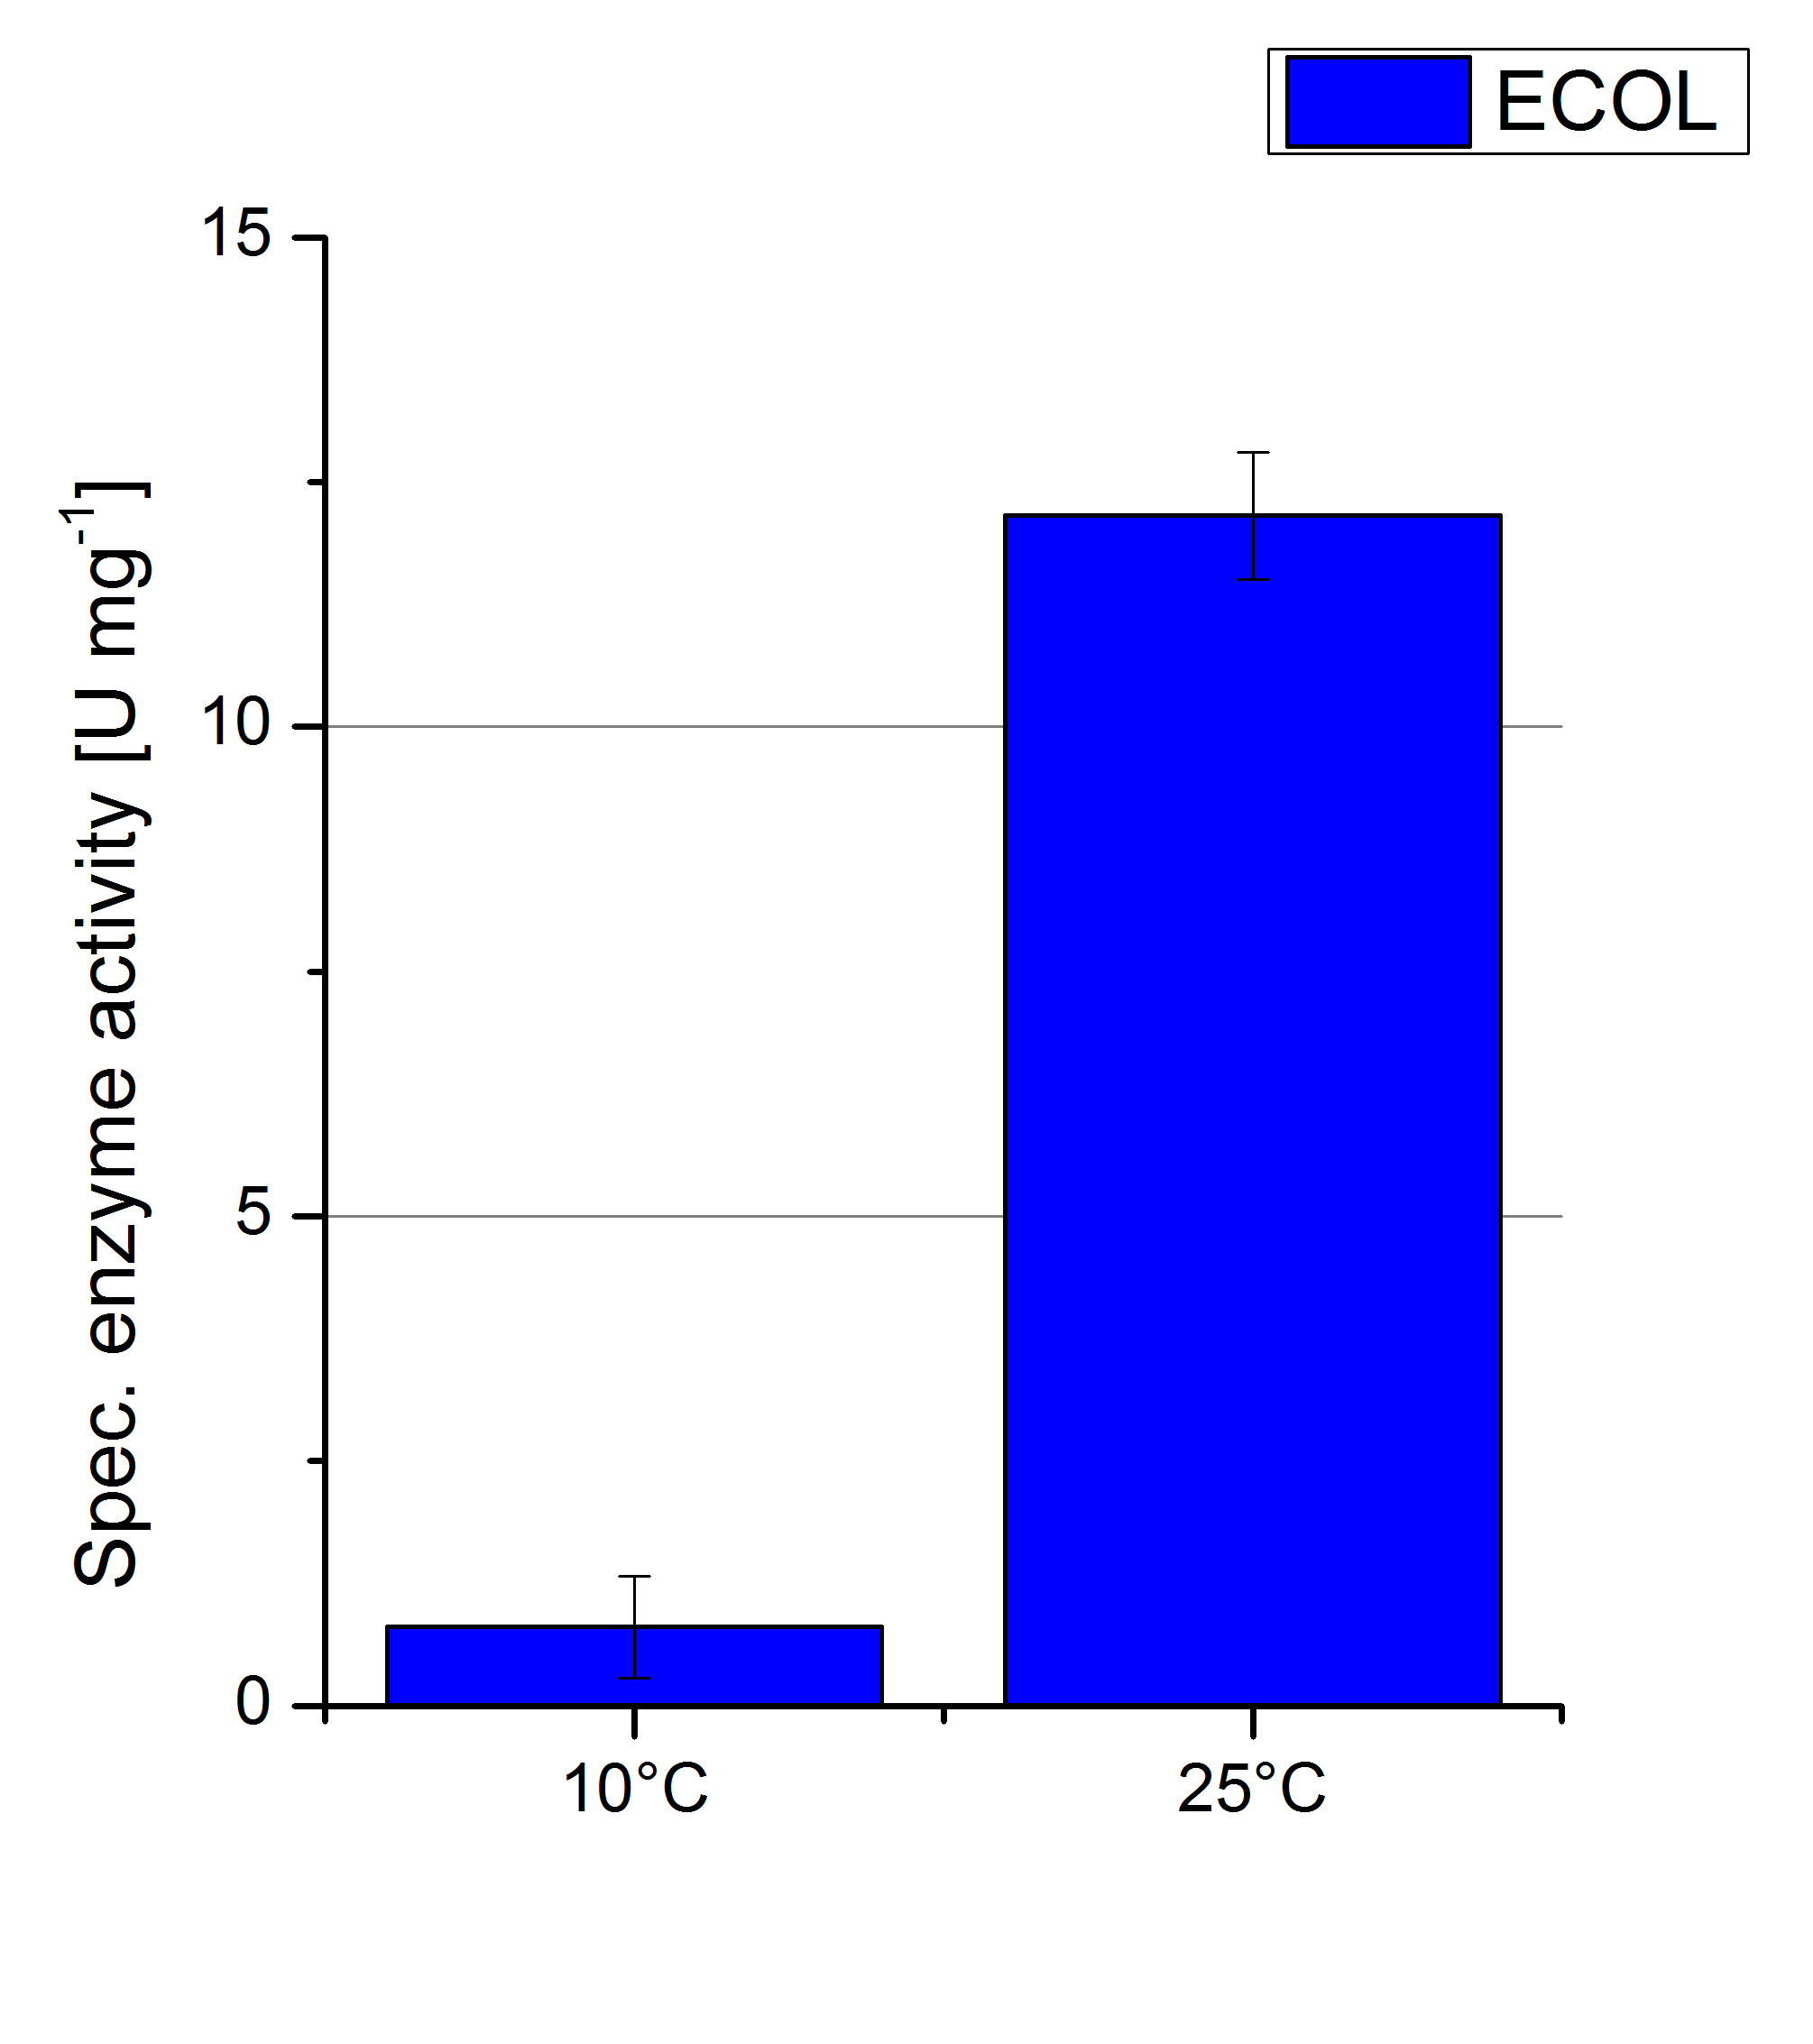
[[File:Bielefeld2012 ECOL Temp Units.jpg|right|200px|thumb|Deriving from the obtained values of oxidized ABTS in time at 10°C and 25°C the specific enzyme activity was calculated. For the temperatures a difference of 9 U/mg could be detected.]] | [[File:Bielefeld2012 ECOL Temp Units.jpg|right|200px|thumb|Deriving from the obtained values of oxidized ABTS in time at 10°C and 25°C the specific enzyme activity was calculated. For the temperatures a difference of 9 U/mg could be detected.]] | ||
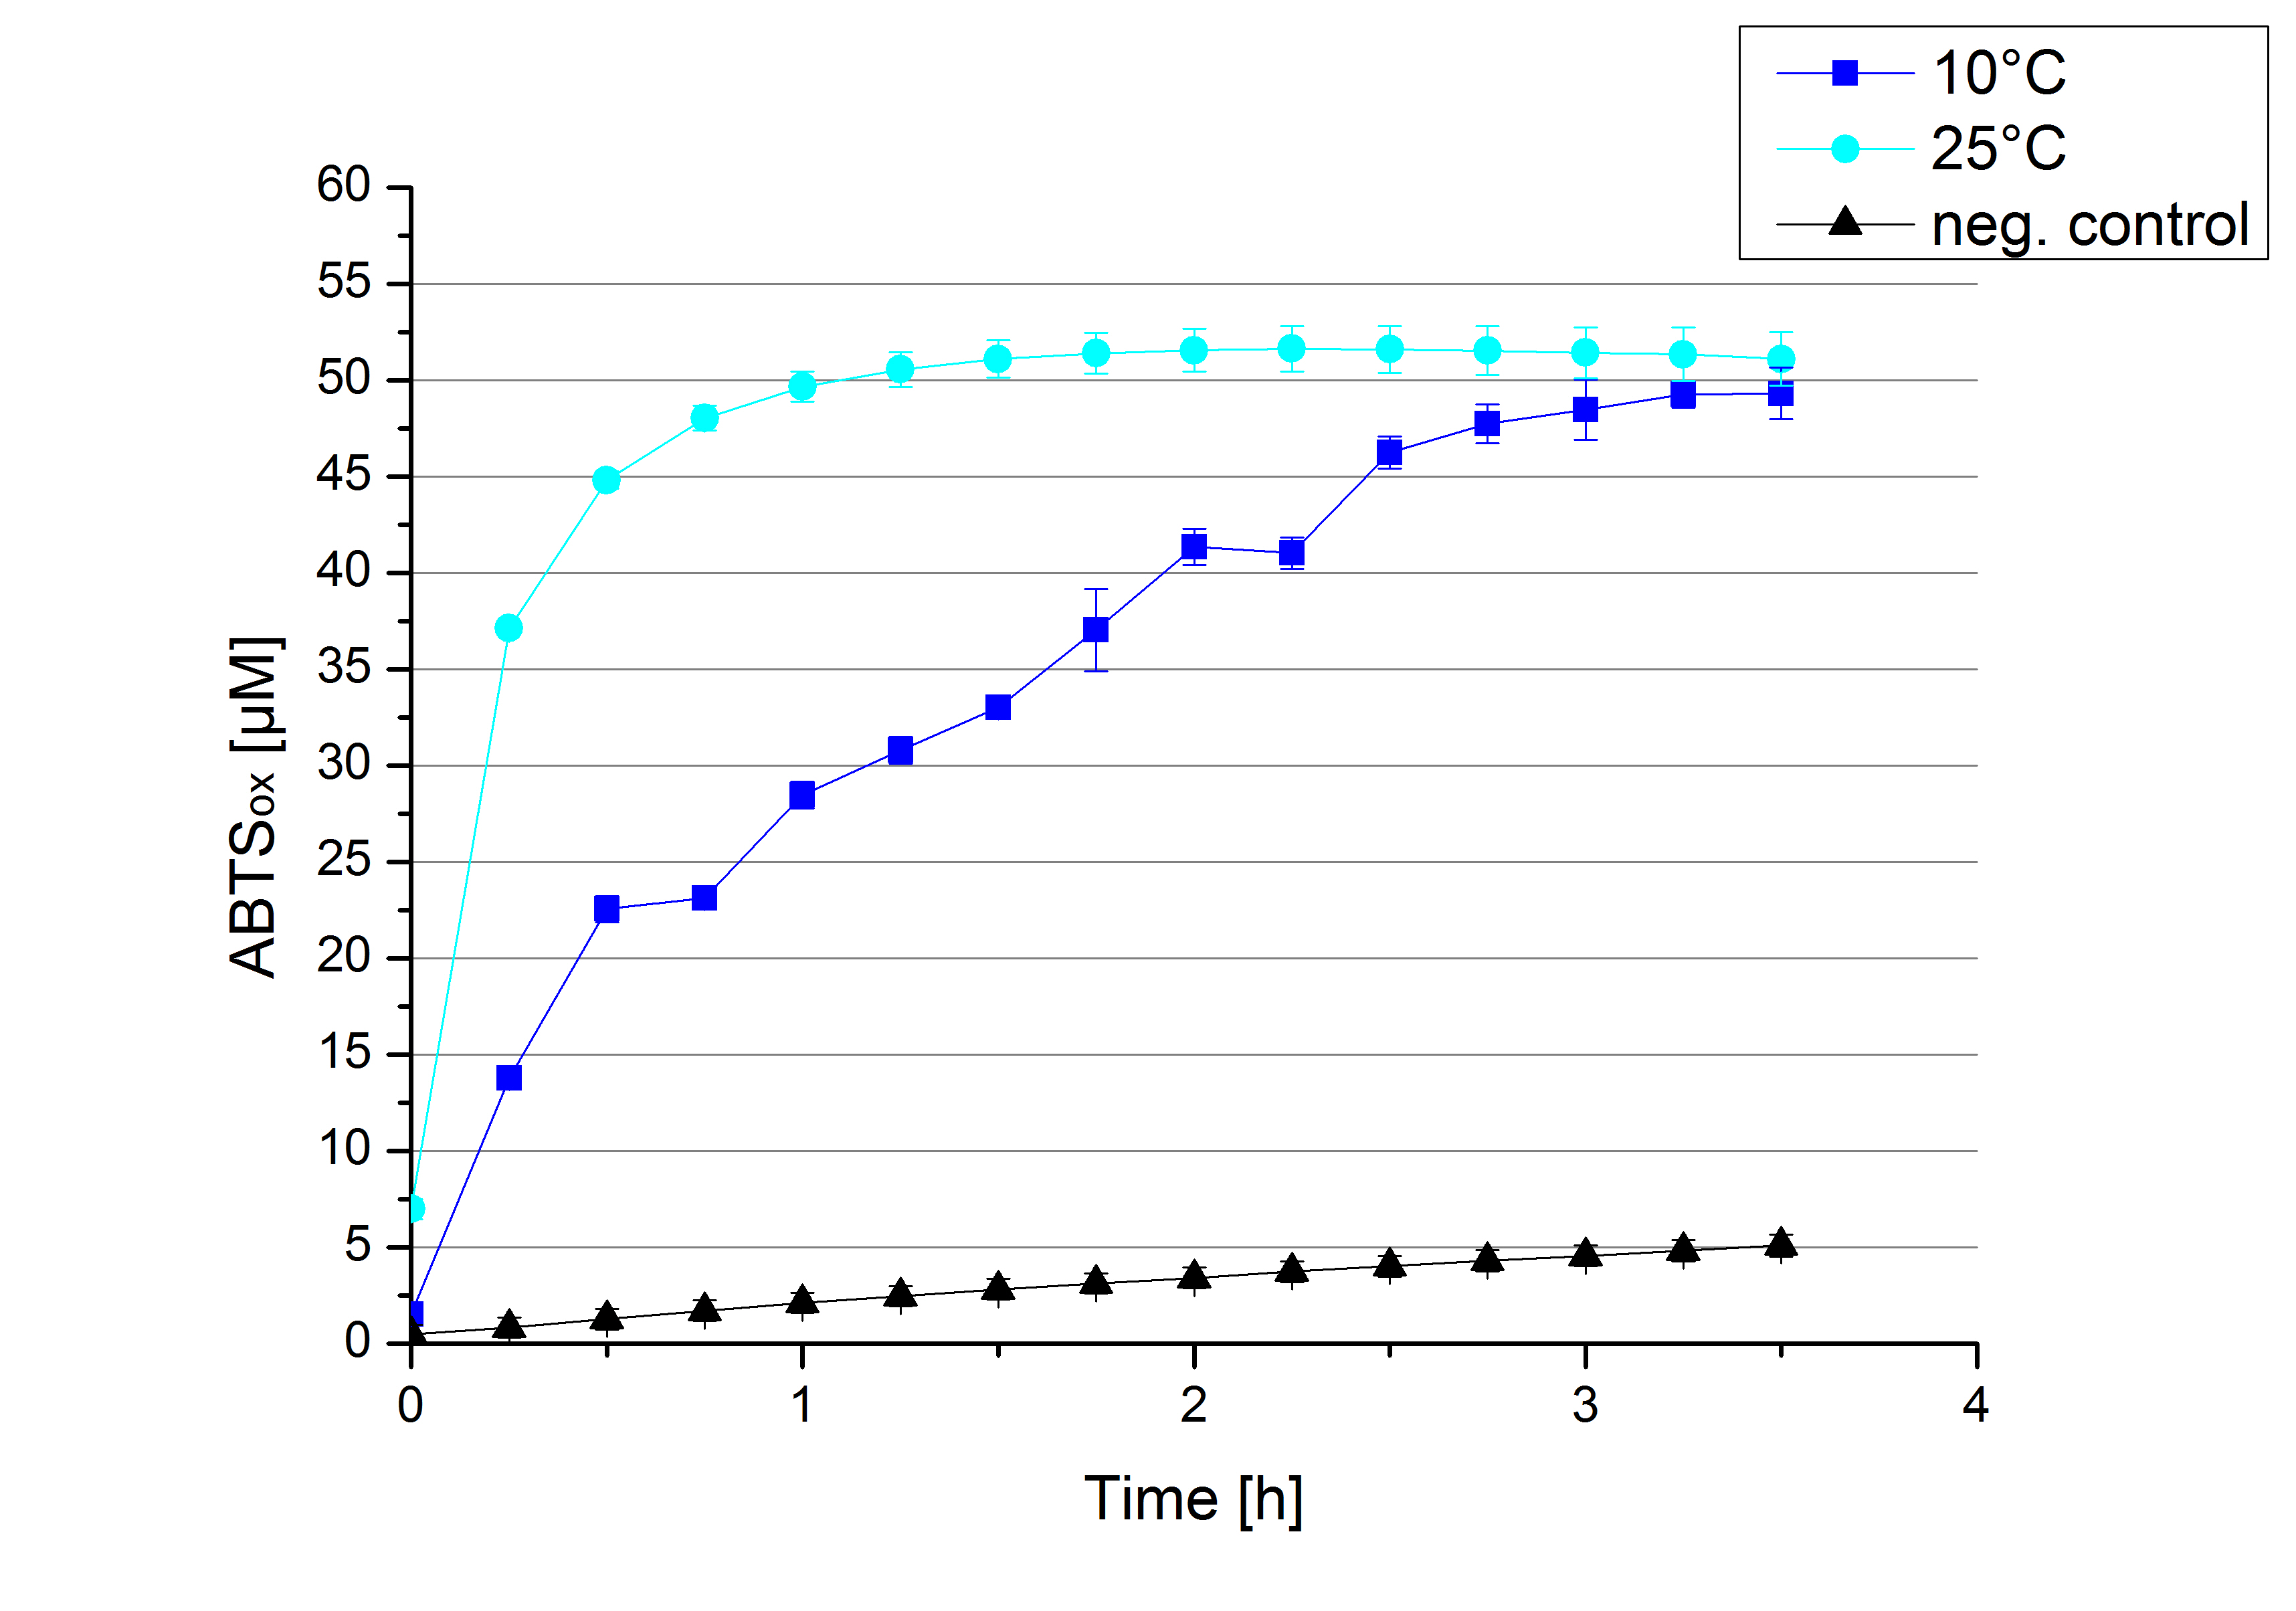
| - | To investigate the activity of ECOL at temperatures that will apply at a waste water treatment plant throughout the year, activity tests as described above were performed at 10°C and 25°C. The measurements were conducted for 30 minutes. The obtained results reveal a lower activity of ECOL at 10°C in comparison to 25°C (see Fig. X). The received values were used to calculate the specific enzyme activity which was | + | To investigate the activity of ECOL at temperatures that will apply at a waste water treatment plant throughout the year, activity tests as described above were performed at 10°C and 25°C. The measurements were conducted for 30 minutes. The obtained results reveal a lower activity of ECOL at 10°C in comparison to 25°C (see Fig. X). The received values were used to calculate the specific enzyme activity which was between 1 and 12 U mg<sup>-1 </sup>, respectively (see Figure X). The negative control without ECOL but 0.4 mM CuCl<sub>2</sub> at 10°C and 25°C show a negligible oxidation of ABTS. The activity of ECOL is decreased to about 90% at 10°C. An application of ECOL at warm temperatures is therefore possible but during the cold seasons a more cryo stable enzyme would be preferable. |
<br><br><br><br> | <br><br><br><br> | ||
Revision as of 23:00, 26 October 2012

Summary
First some trials of shaking flask cultivations were made with changing parameters to identify the best conditions for the production of the laccase CueO from E. coli BL21 (DE3) named ECOL fused to a His tag. Because of no measured activity in the cell lysate a purification method was established (using Ni-NTA His tag resin and Syringe or ÄKTA method). The purified ECOL could be identified by SDS-PAGE (molecular weight of 53.4 kDa) as well as by MALDI-TOF. The fractionated samples were also tested concerning their activity. A maximal activity of 55% was reached, measured in ABTSox [µM]. After measuring activity of ECOL a scale up was made up to 3 L and then also up to 6 L that enables an intense screening afterwards. A further scale up to 12 L with a optimized medium was implemented to enable additional experiments to characterize ECOL. Additional scale up experiments will be important for further application. The enzyme was characterized regarding its temperature and pH optimum and concerning the influence of different concentrations of CuCl2, ABTS, MeOH and acetonitrile.
Cultivation, Purification and SDS-PAGE
Shaking Flask Cultivations
The first trials to produce ECOL were produced in shaking flask with various designs (from 100 mL-1 to 1 L flasks, with and without baffles) and under different conditions. The parameters tested during our screening experiments were temperature (27 °C,30 °C and 37 °C), concentrations of chloramphenicol (20-170 µg mL-1), various induction strategies (autoinduction and manual induction) and cultivation time (6 - 24 h). Furthermore it was cultivated with and without 0.25 mM CuCl2 to provide a sufficient amount of copper, which is needed for the active center of the laccase. Based on the screening experiments we identified the best conditions under which ECOL was expressed. The addition of CuCl2 did not increase the activity, so it was omitted.
- flask design: shaking flask without baffles
- medium: autoinduction medium
- antibiotics: 60 µg mL-1 chloramphenicol
- temperature: 37 °C
- cultivation time: 12 h
The reproducibility of the measured data and results were investigated for the shaking flask and bioreactor cultivation.
3 L Fermentation E. coli KRX with <partinfo>BBa_K863005</partinfo>
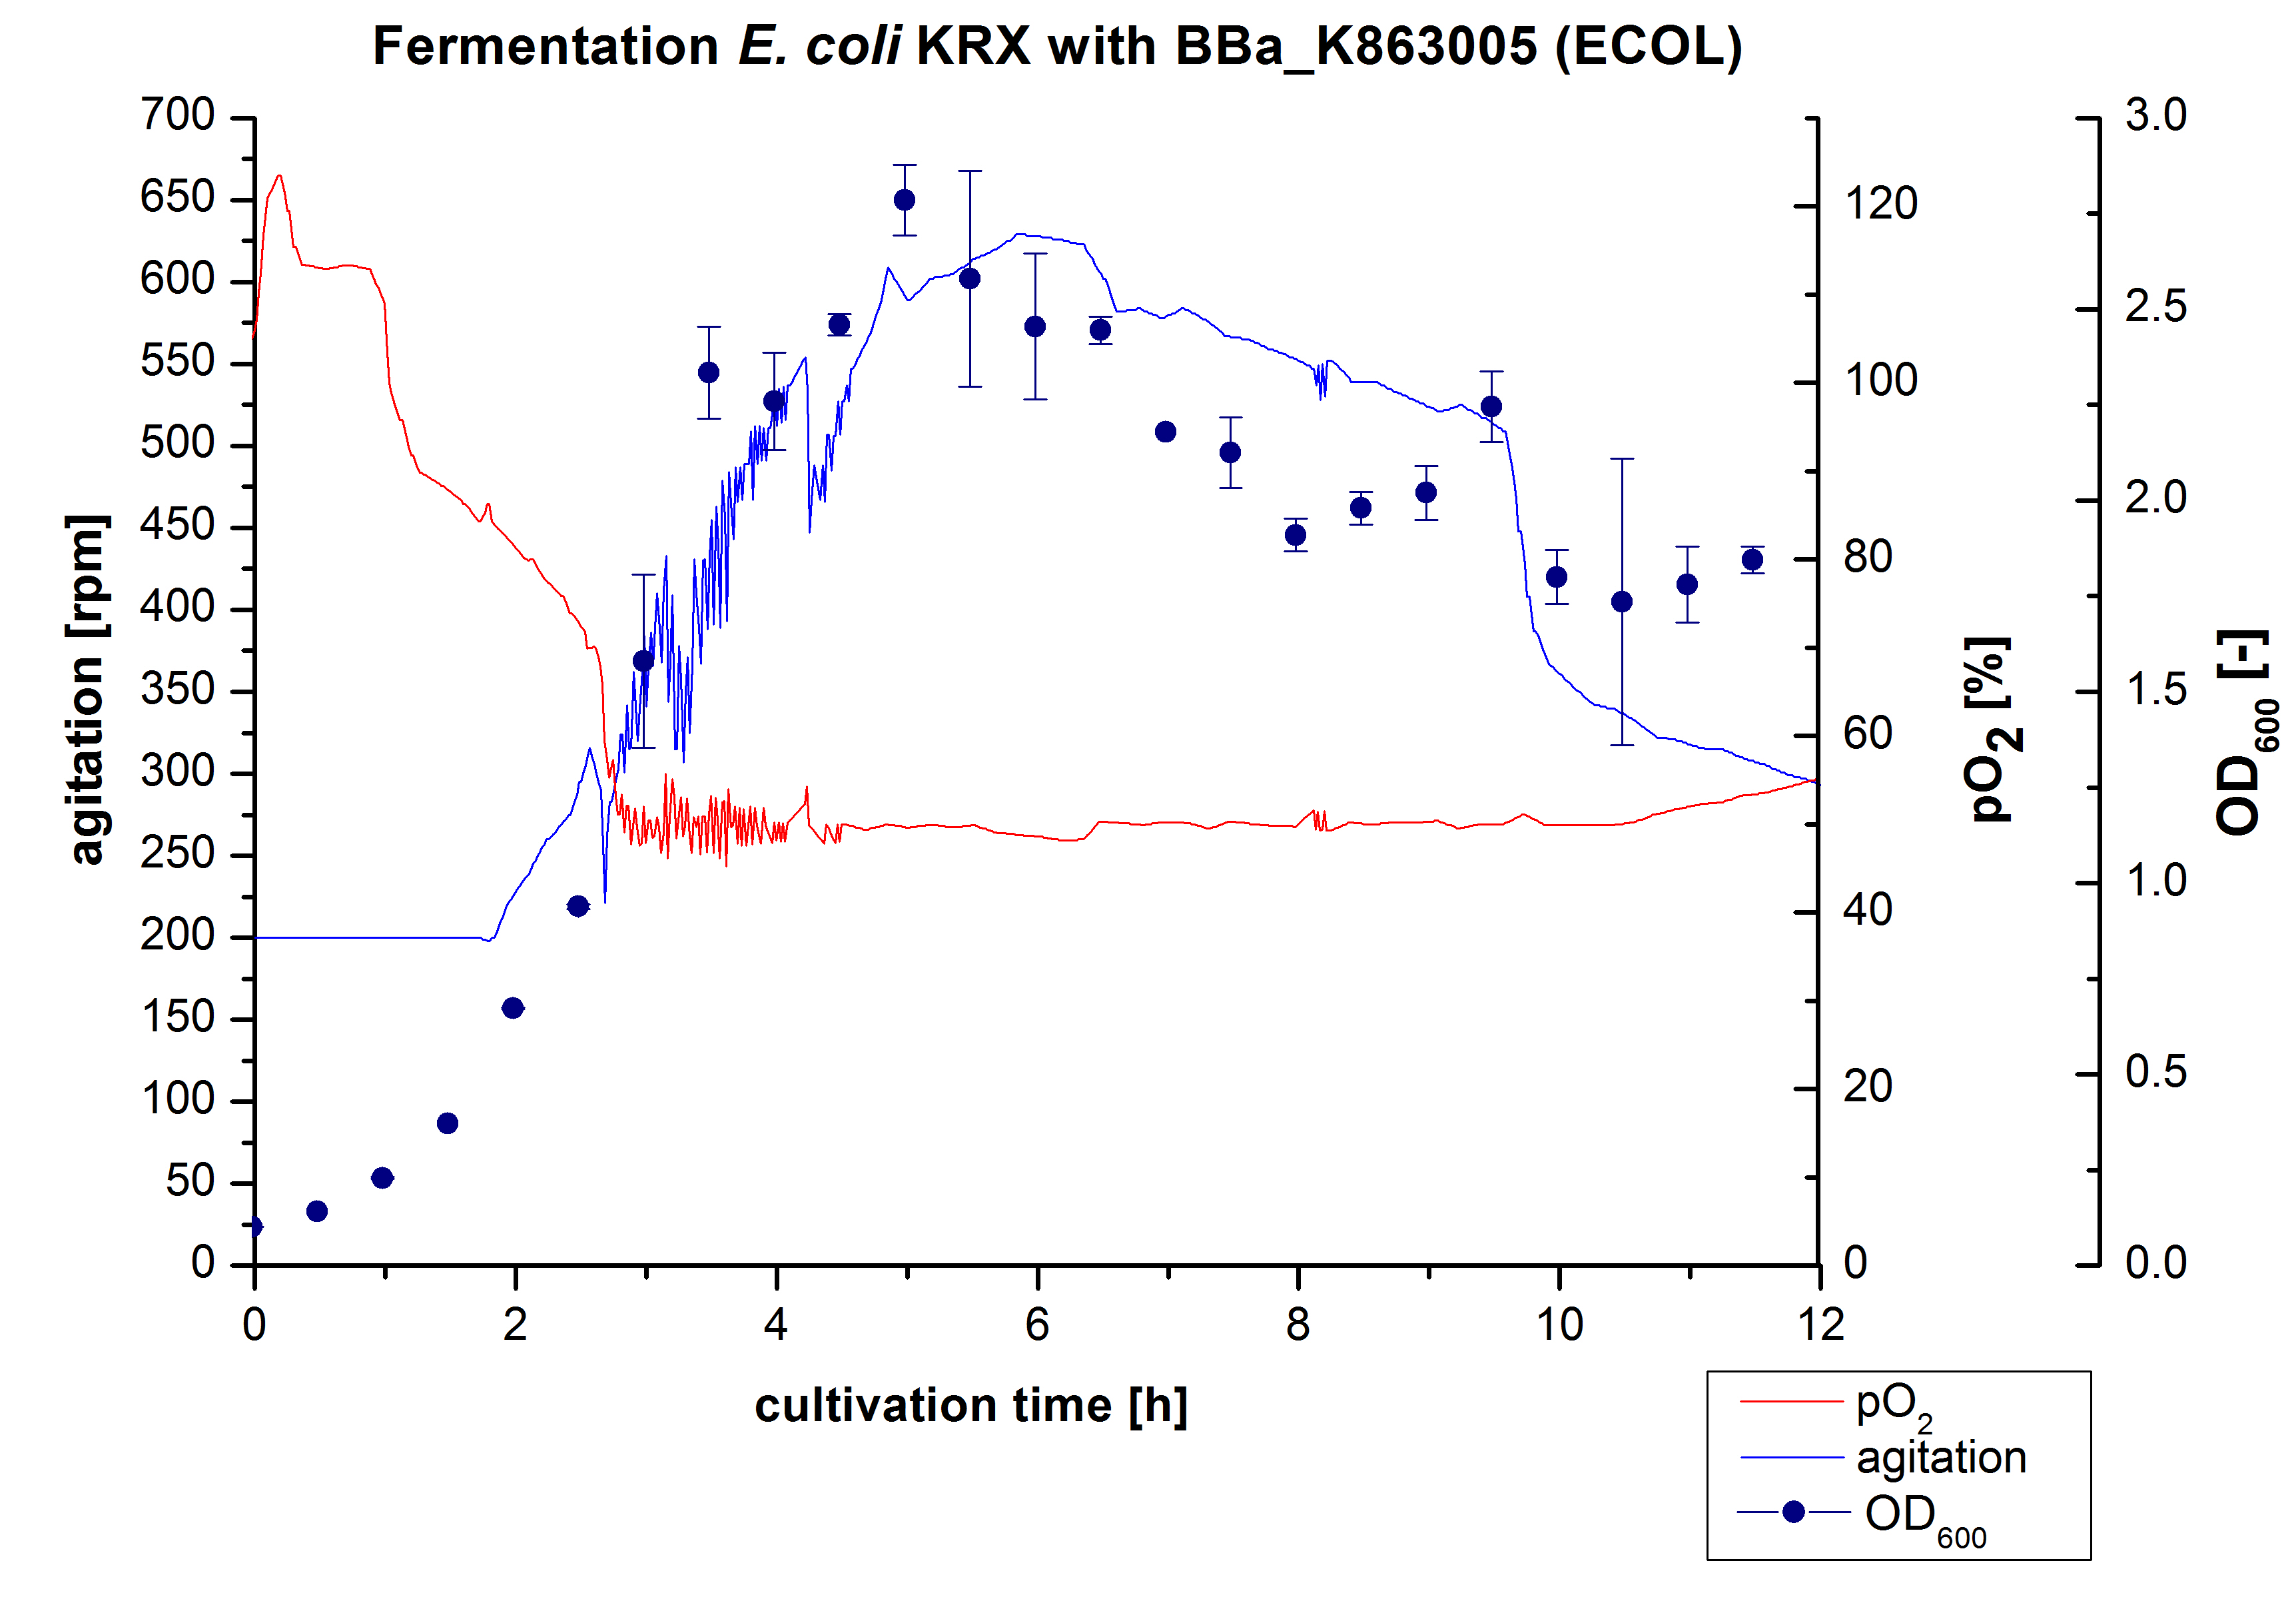
After the positive measurement of activity of ECOL we made a scale-up and fermented E. coli KRX with <partinfo>BBa_K863005</partinfo> in an Infors Labfors fermenter with a total volume of 3 L. Agitation speed, pO2 and OD600 were determined and illustrated in Figure 1. The exponential phase started after 1.5 hours of cultivation. The cell growth caused a decrease in pO2. After 2 hours of cultivation the agitation speed increased up to 629 rmp (5.9 hours) to hold the minimal pO2 level of 50 %. Then, after 4 hours there was a break in cell growth due to induction of protein expression. The maximal OD600 of 2.78 was reached after 5 hours. In comparison to E. coli KRX (OD600,max =4.86 after 8.5 hours) and to E. coli KRX with <partinfo>BBa_K863000</partinfo> (OD600,max =3.53 after 10 hours, time shift due to long lag phase) the OD600 max is lower. In the following hours, the OD600 and the agitation speed decreased and the pO2 increased, which indicates the death phase of the cells. This is caused by the cell toxicity of ECOL (reference: [http://www.dbu.de/OPAC/ab/DBU-Abschlussbericht-AZ-13191.pdf DBU final report]). Hence, cells were harvested after 12 hours.
Purification of ECOL
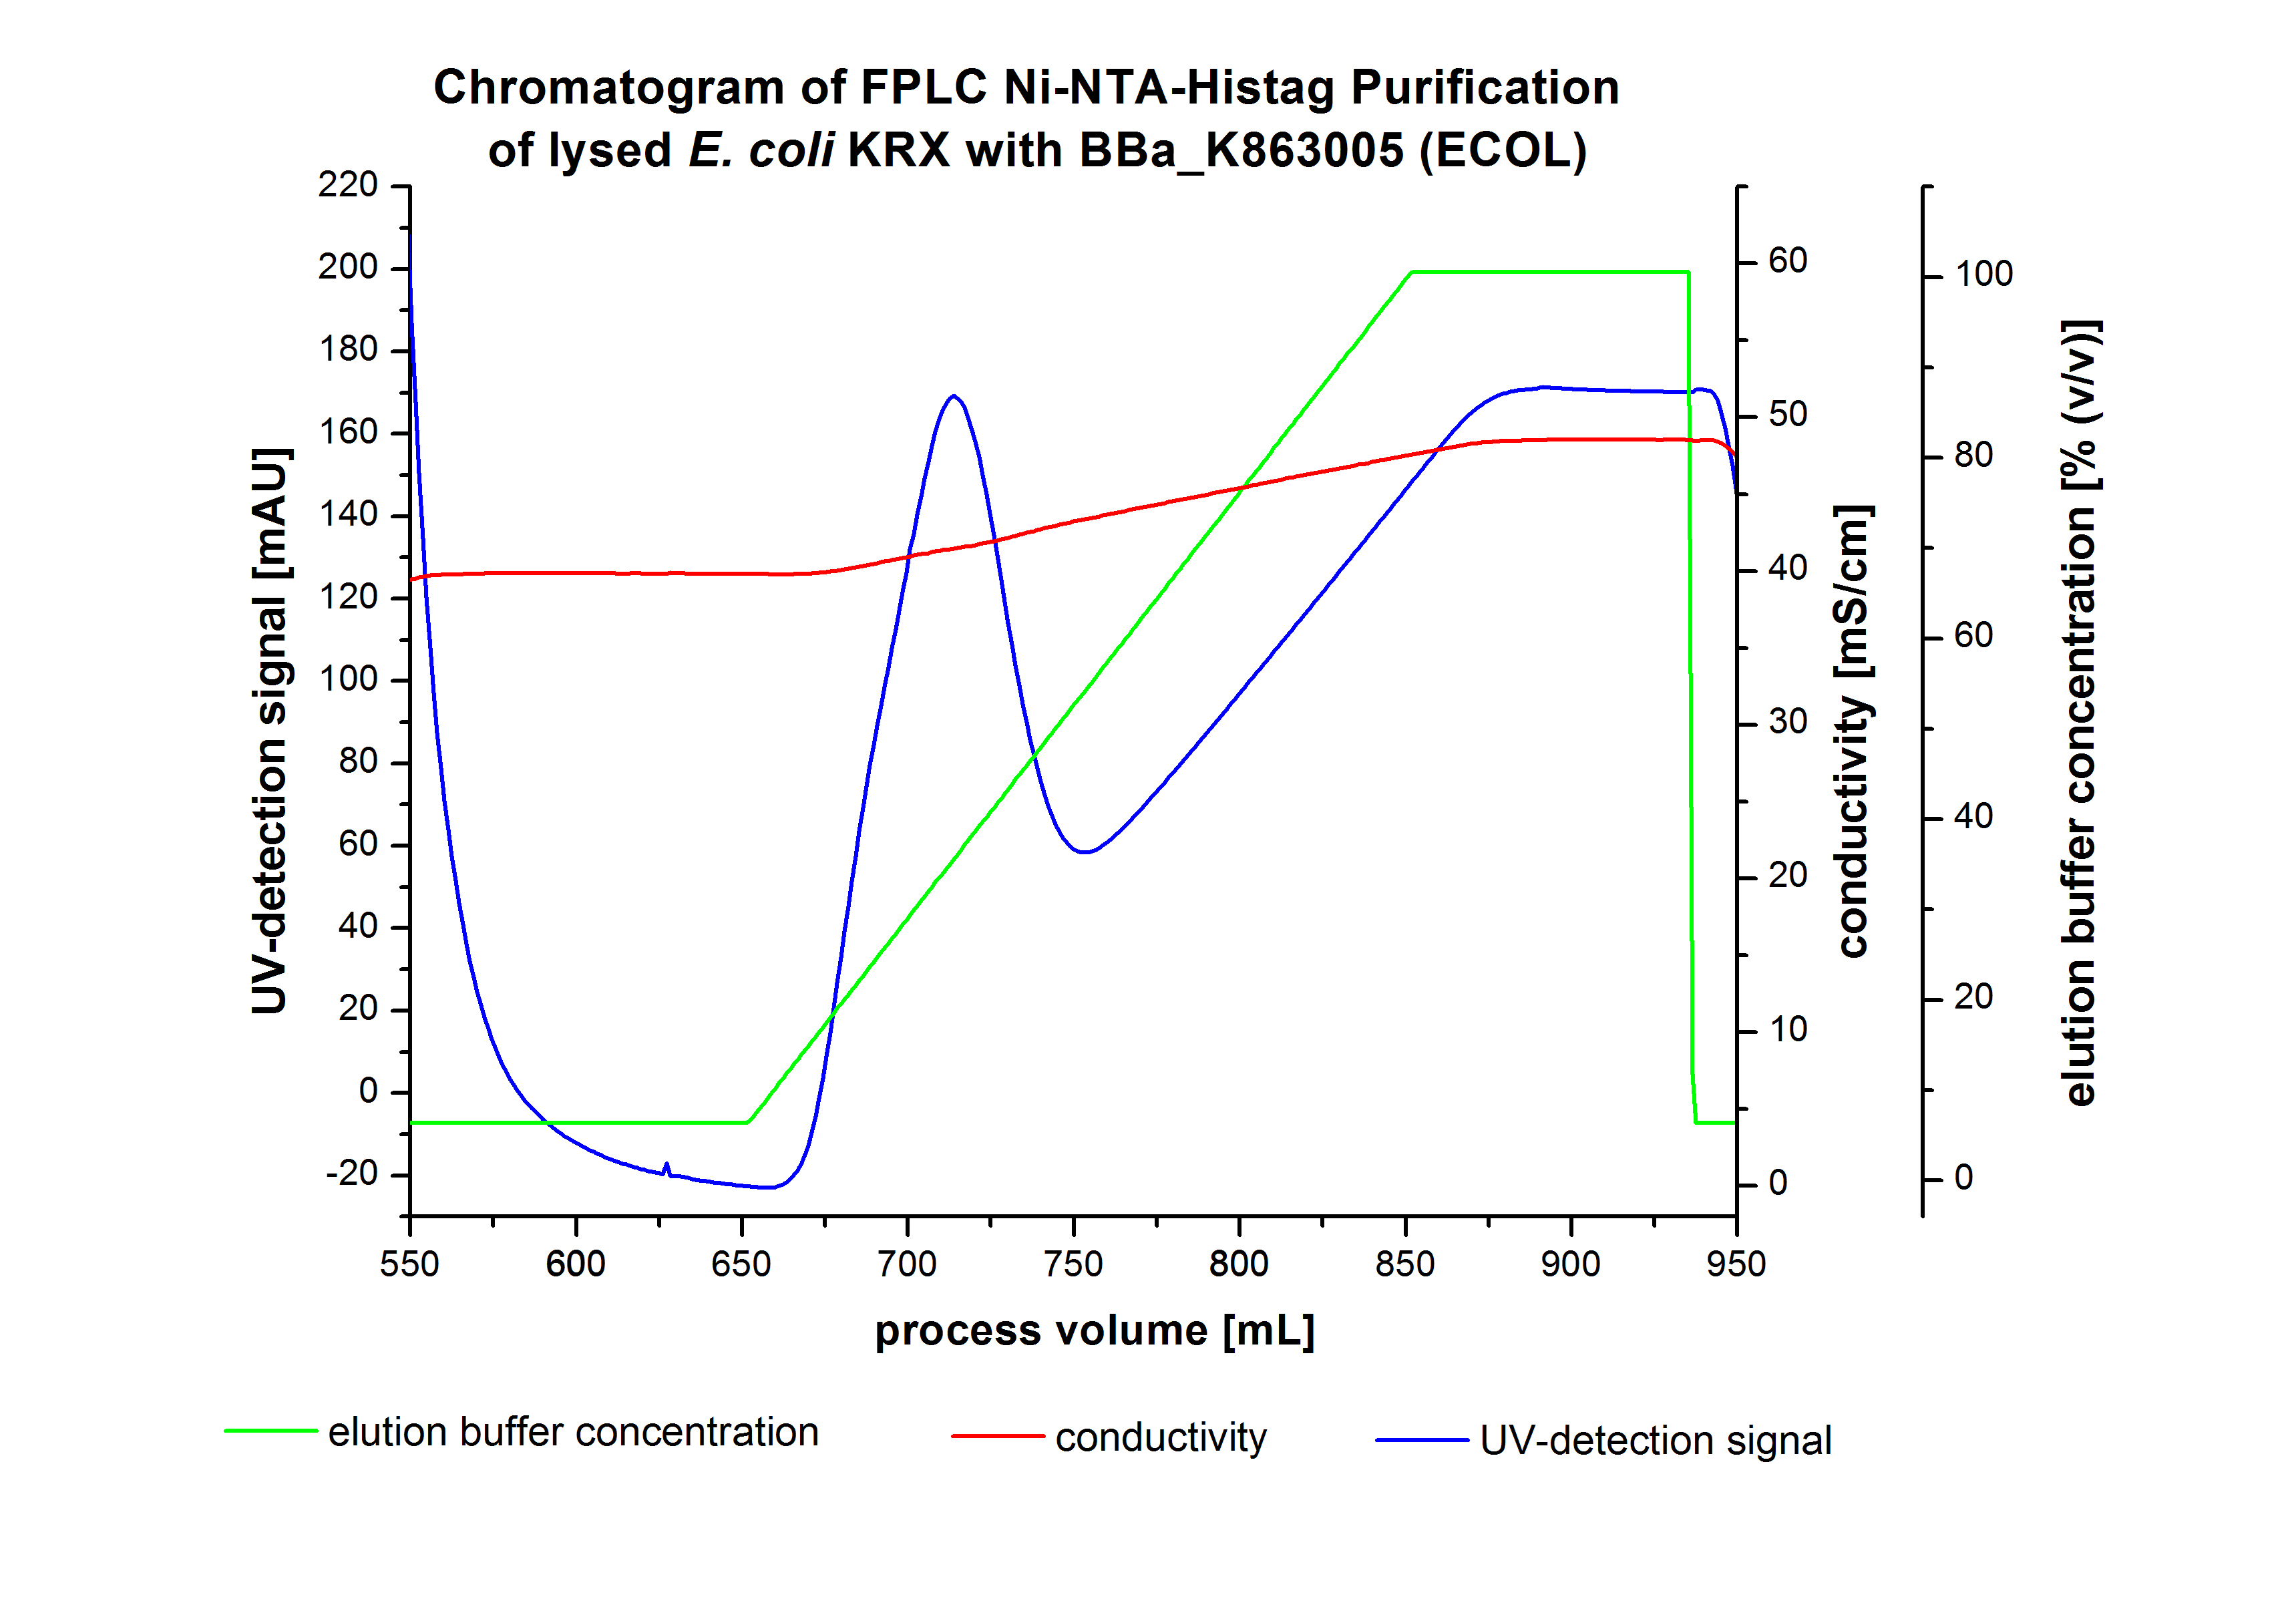
The harvested cells were resuspended in Ni-NTA- equilibration buffer, mechanically disrupted by homogenization and cell debris were removed by centrifugation. The supernatant of the cell lysate was loaded on the Ni-NTA column (15 mL Ni-NTA resin) with a flow rate of 1 mL min-1 cm-2. Then the column was washed with 10 column volumes (CV) Ni-NTA equilibration buffer. The bound proteins were eluted by an increasing Ni-NTA elution buffer step elution from 5 % (equates to 25 mM imidazol) with a length of 50 mL, to 50 % (equates to 250 mM imidazol) with a length of 60 mL, to 80 % (equates to 400 mM imidazol) with a length of 40 mL and finally to 100 % (equates to 500 mM imidazol) with a length of 80 mL. This strategy was chosen to improve the purification caused by a step by step increasing Ni-NTA-elution buffer concentration. The elution was collected in 10 mL fractions. Due to the high UV-detection signal of the loaded samples and to simplify the illustration of the detected product peak only the UV-detection signal of the wash step and the elution are shown. A typical chromatogram of purified laccases is illustrated here. The chromatogram of the ECOL elution is shown in Figure 2:
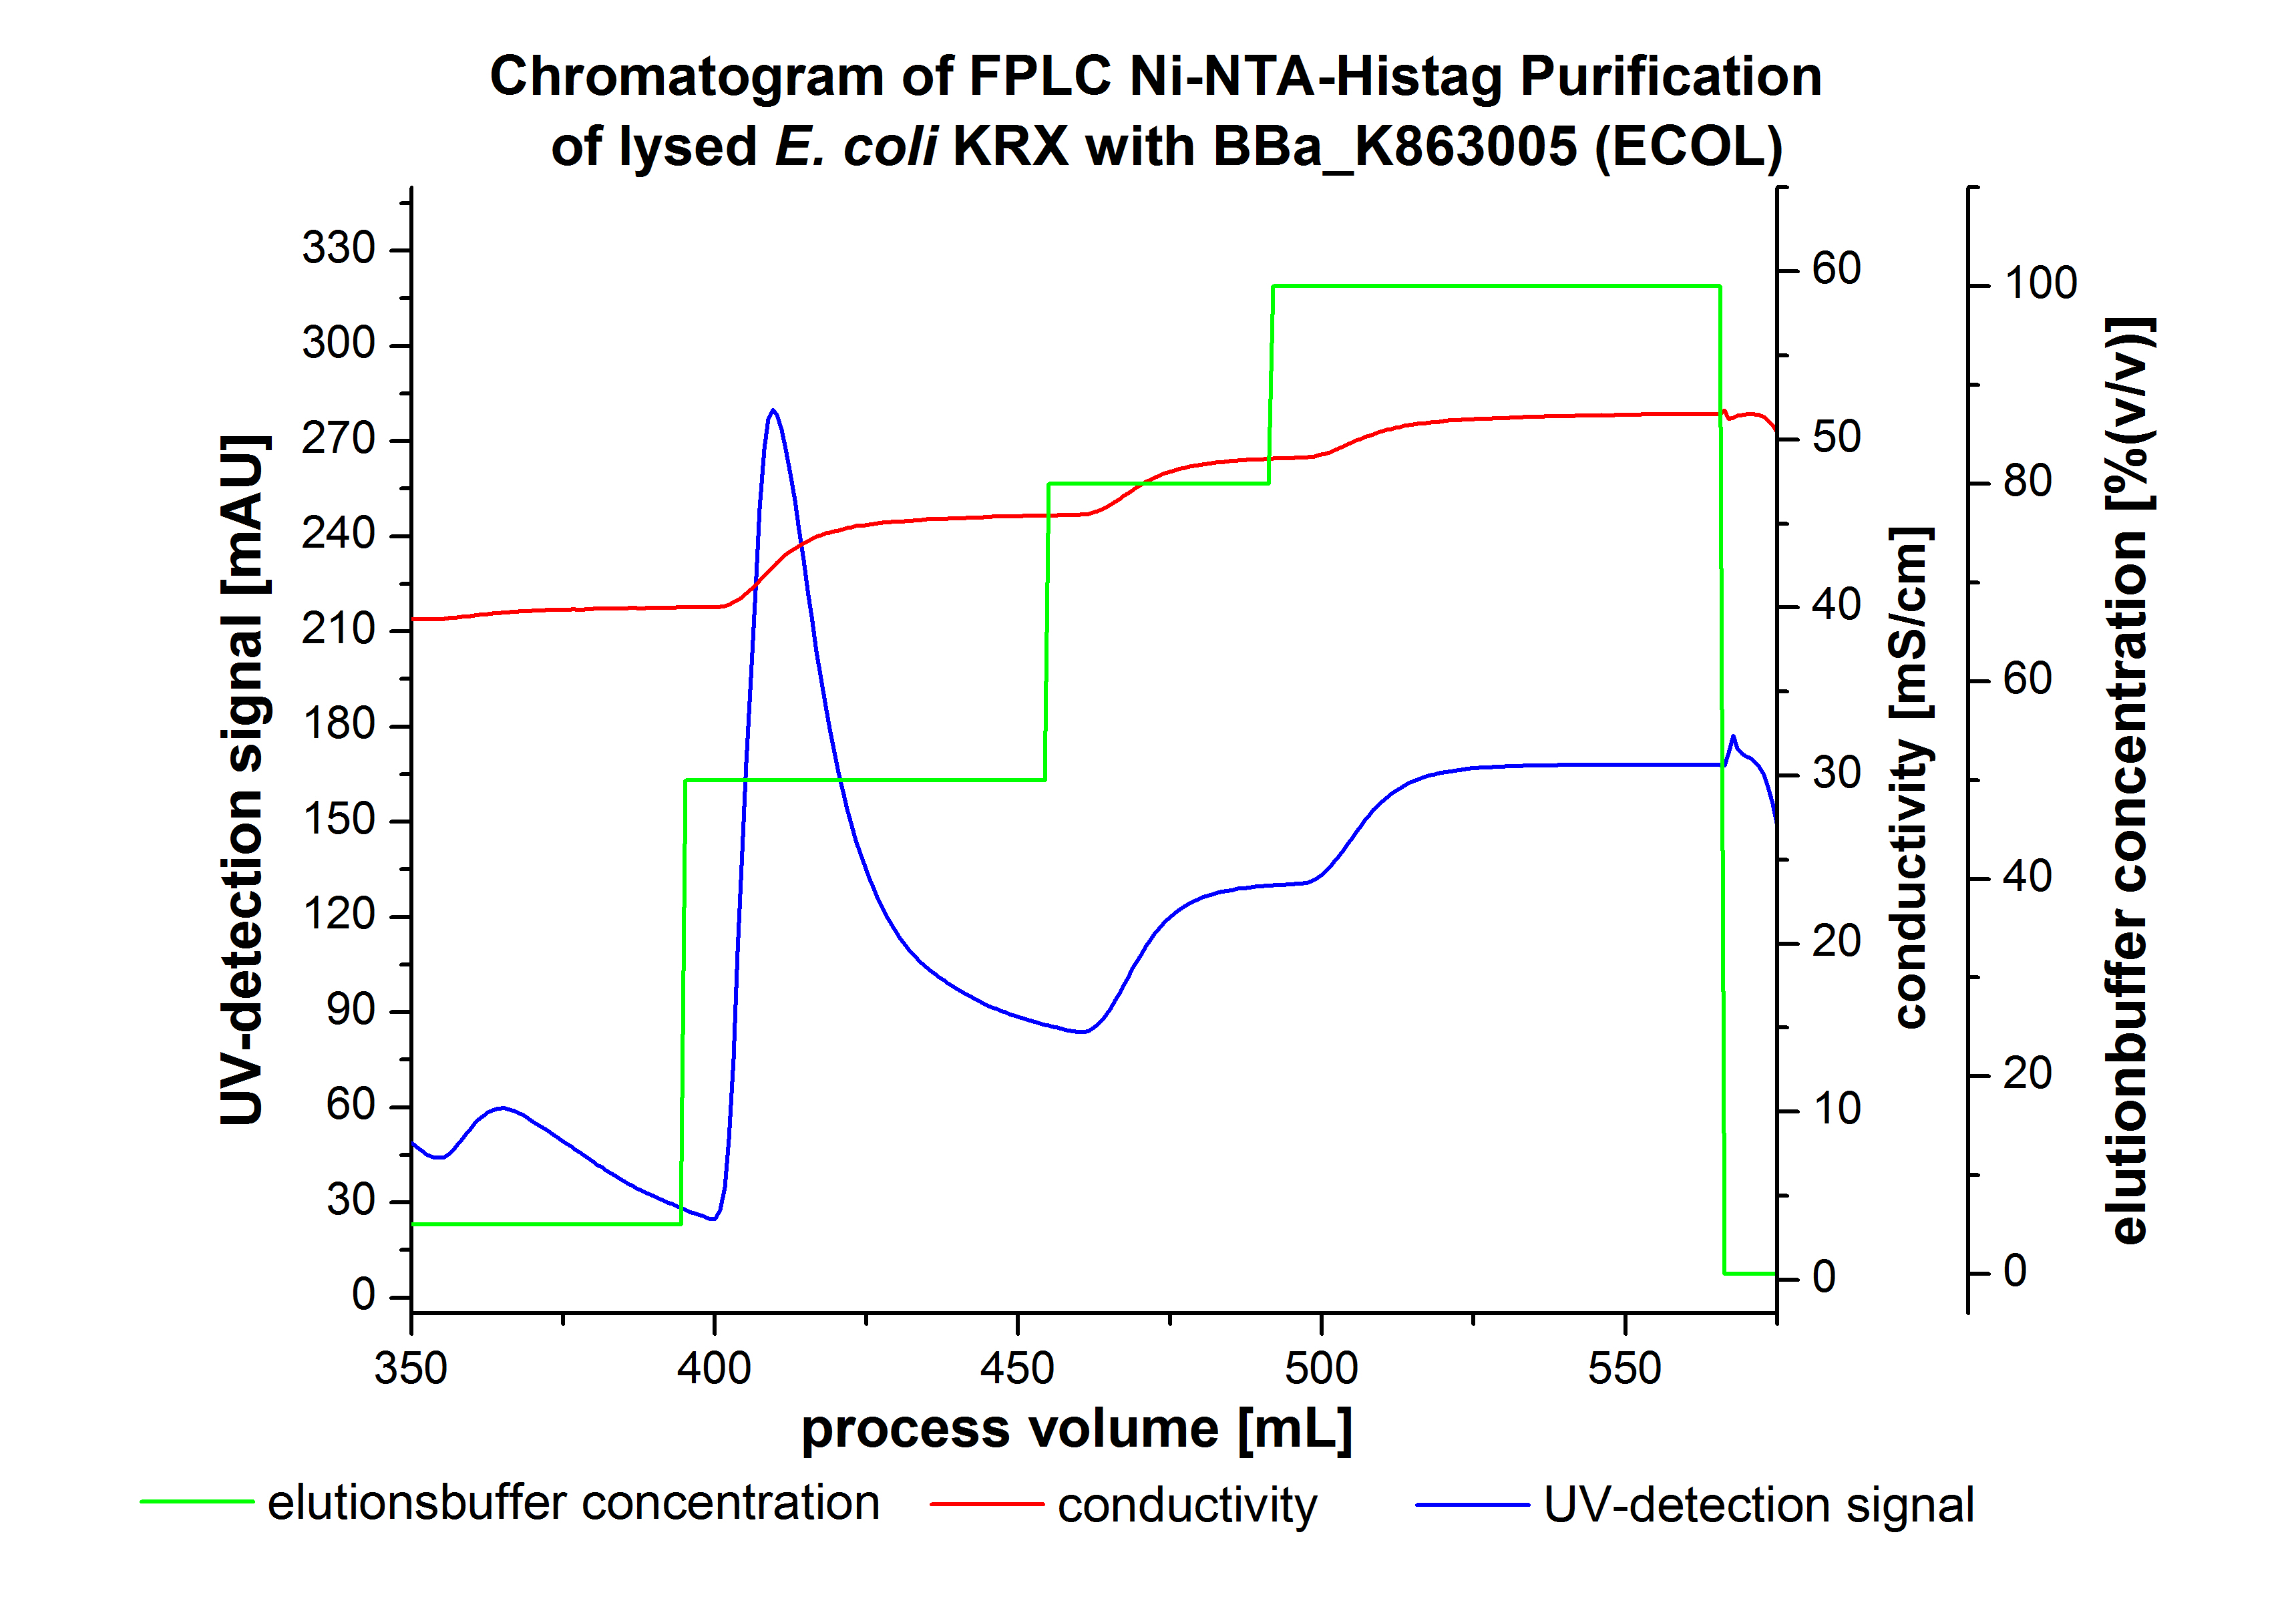
The chromatogram shows two distinguished peaks. The first peak was detected at a Ni-NTA-equilibration buffer concentration of 5 % (equates to 25 mM imidazol) and resulted from the elution of weakly bound proteins. After increasing the Ni-NTA elution buffer concentration to 50 % (equates to 250 mM imidazol), an UV-detection signal peak of 292 mAU was measured. The area of this peak indicates that a high amount of protein was eluted. The corresponding fractions were analyzed by SDS-PAGE to detect ECOL. There were no further peaks detectable. The following increasing UV detection signal results from the rising imidazol concentration of the Ni-NTA elution buffer. The corresponding SDS-PAGES are shown in Figure 3.
SDS-PAGE of ECOL purification
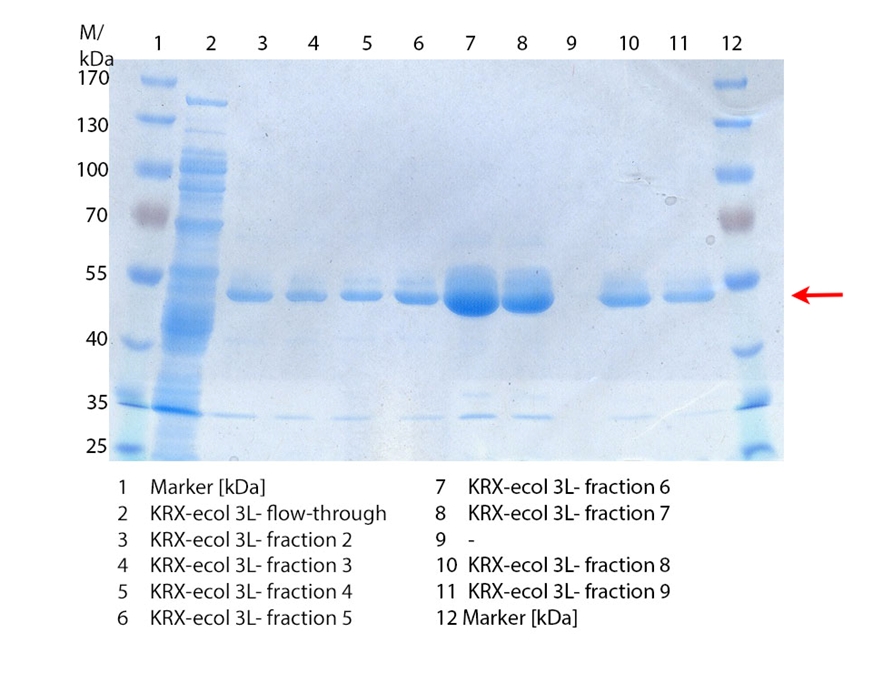
In Figure 3 the SDS-PAGE of the Ni-NTA His tag purification of the lysed culture (E. coli KRX containing [http://partsregistry.org/wiki/index.php?title=Part:BBa_K863005 BBa_K863005]) is shown including the flow-through and the fractions 2 to 9. The red arrow indicates the band of ECOL with a molecular weight of 53.4 kDa, which appears in all fractions. The strongest bands appear in fractions 6 and 7. These were the first two fractions (each 10 mL) eluted with 50 % Ni-NTA elution buffer (equates to 250 mM imidazol), in which the distinguished peak appeared.
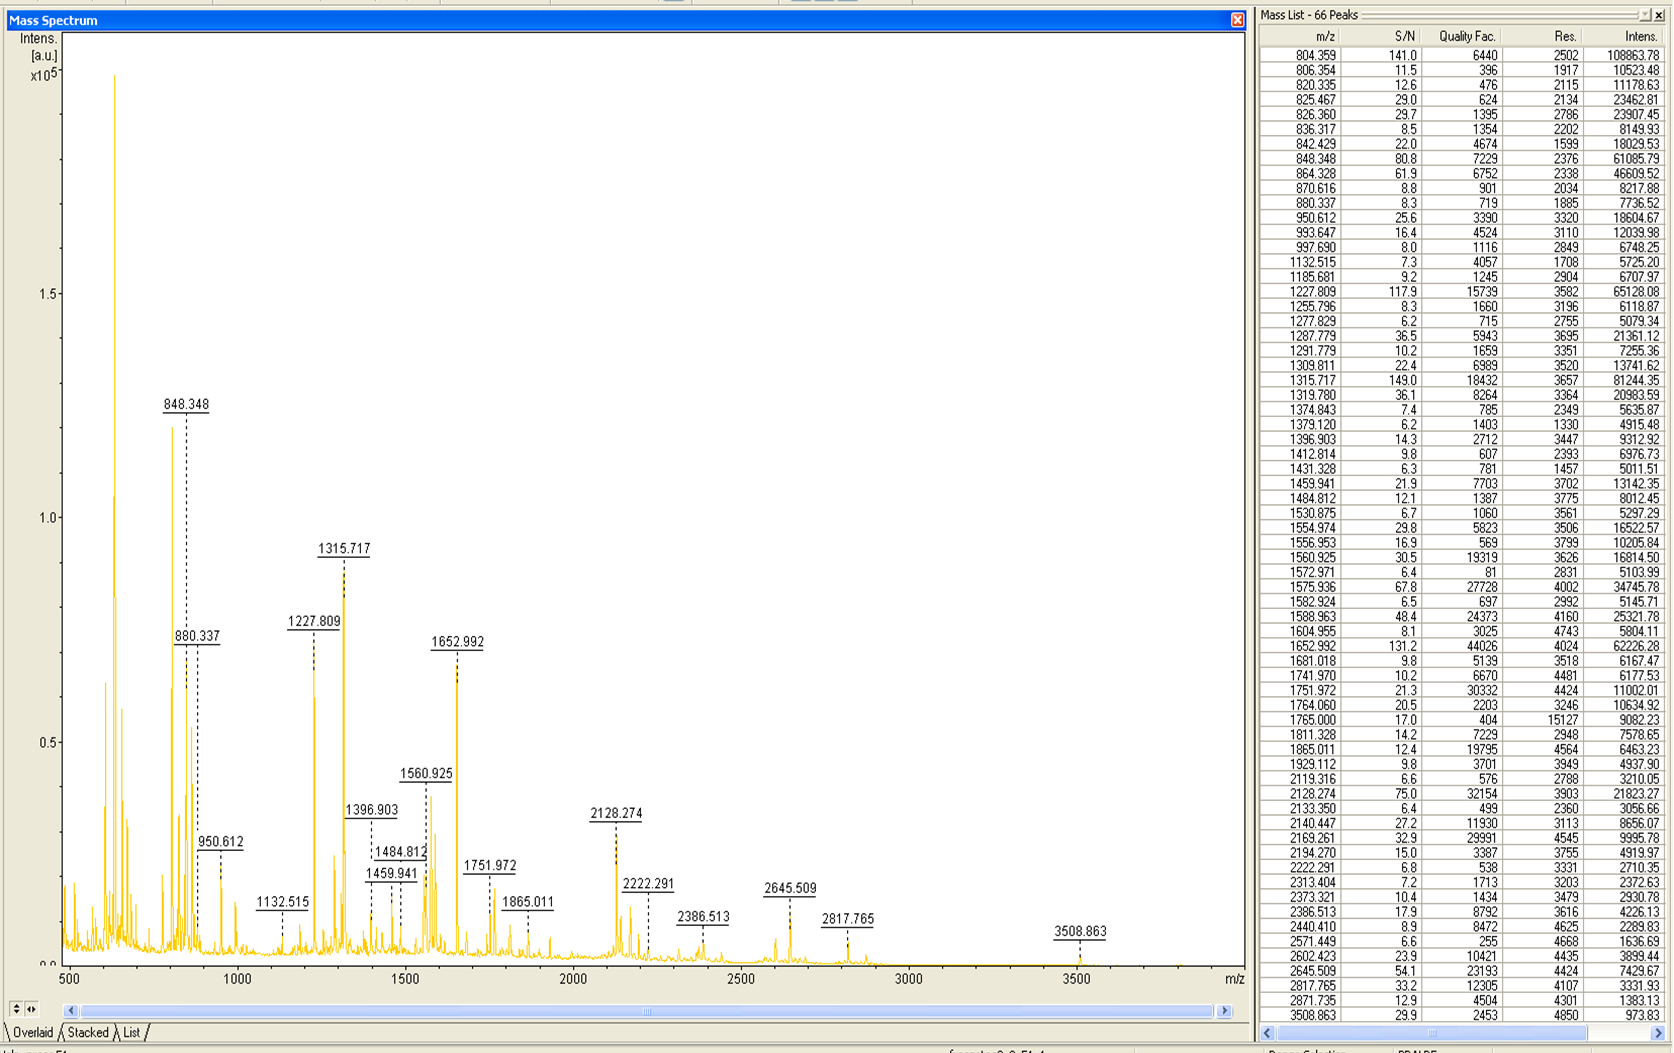
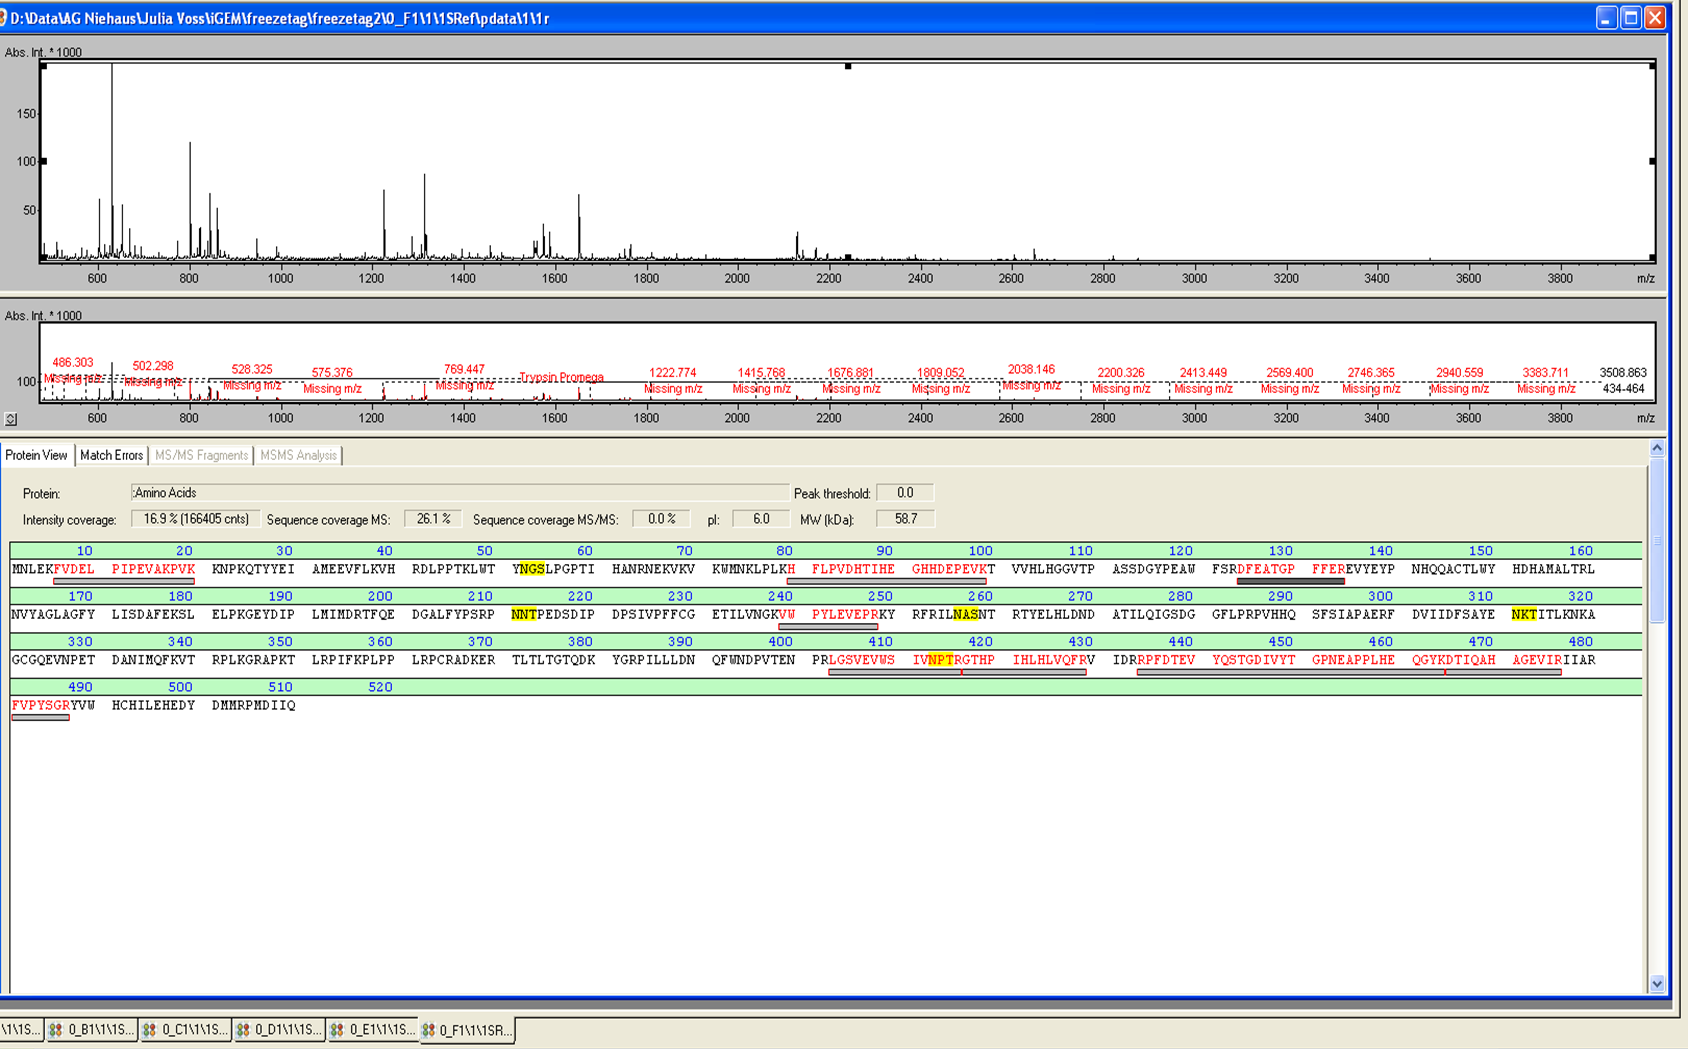
These bands were analyzed by MALDI-TOF and identified as CueO (ECOL). In contrast, the second, faint band with a lower molecular weight could not be identified.
6 L Fermentation of E. coli KRX with <partinfo>BBa_K863005</partinfo>
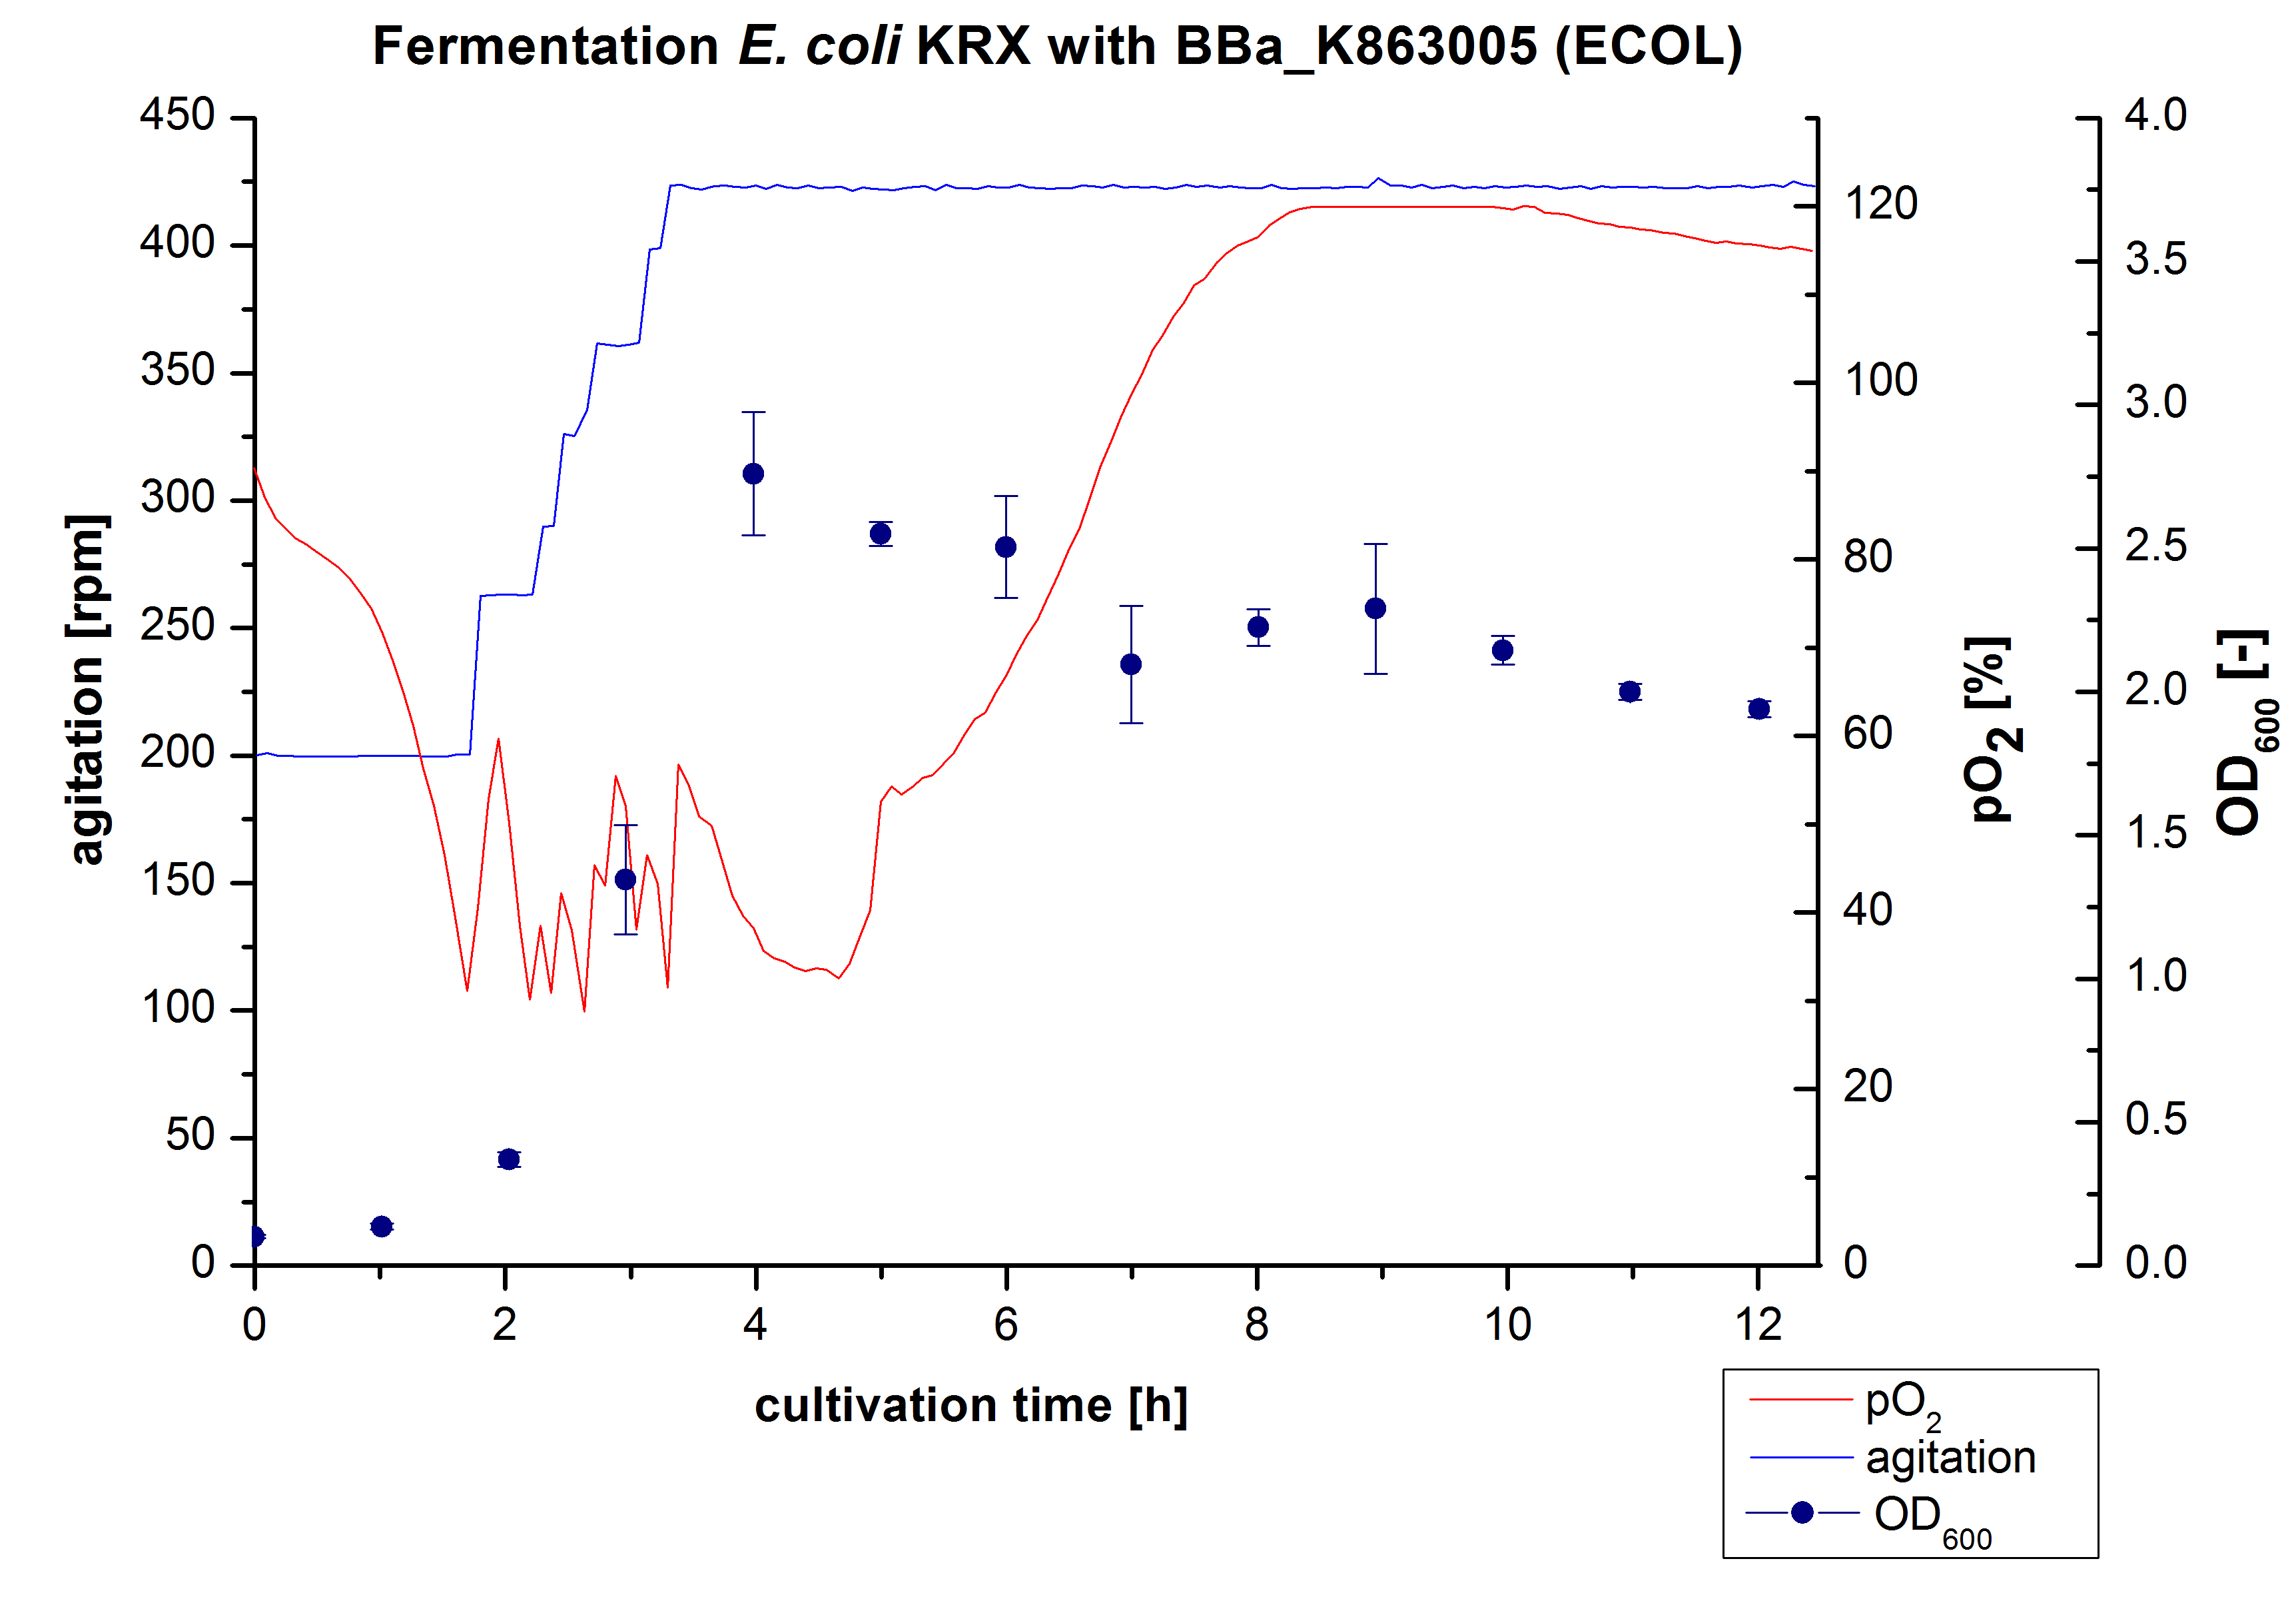
Another scale-up of the fermentation of E. coli KRX with <partinfo>BBa_K863005</partinfo> was made up to a final working volume of 6 L in a Bioengineering NFL 22 fermenter. Agitation speed, pO2 and OD600 were determined and illustrated in Figure 3. There was no noticeable lag phase and the cells immediately began to grow. The cells were in an exponential phase between 2 and 4 hours of cultivation, which results in a decrease of pO2 value and therefore in an increase of agitation speed. After 4 hours of cultivation the maximal OD600 of 2.76 was reached, which is comparable to the 3 L fermentation of E. coli KRX with <partinfo>BBa_K863005</partinfo>. Due to induction of protein expression there is a break in cell growth. The death phase started, which is indicated by an increasing pO2 and a decreasing OD600. This demonstrates the cytotoxicity of the laccase for E. coli, which was reported by the [http://www.dbu.de/OPAC/ab/DBU-Abschlussbericht-AZ-13191.pdf DBU]. In comparison to the fermentation of E. coli KRX with <partinfo>BBa_K863000</partinfo> under the same conditions (OD600,max= 3.53), the OD600,max was lower. Cells were harvested after 12 hours.
Purification of ECOL
The harvested cells were resuspended in Ni-NTA-equilibration buffer, mechanically disrupted by homogenization and cell debris were removed by centrifugation. The supernatant of the cell lysate was loaded on the Ni-NTA column (15 mL Ni-NTA resin) with a flow rate of 1 mL min-1 cm-2. The column was washed by 10 column volumes (CV) Ni-NTA- equilibration buffer. The bound proteins were eluted by an increasing Ni-NTA- elution buffer gradient from 0 % to 100 % with a length of 200 mL and the elution was collected in 10 mL fractions. Due to the high UV-detection signal of the loaded samples and to simplify the illustration of the detected product peak only the UV-detection signal of the wash step and the eluate are shown. A typical chromatogram of purified laccases is shown here. The chromatogram of the ECOL elution is shown in Figure 5:
After washing the column with 10 CV Ni-NTA-elution buffer the elution process was started. At a process volume of 670 mL to 750 mL the chromatogram shows a remarkable widespread peak (UV-detection signal 189 mAU) caused by the elution of a high amount of proteins. The run of the curve show a fronting. This can be explained by the elution of weakly bound proteins, which elutes at low imidazol concentrations. A better result could be achieved with a step elution strategy (see purification of the 3 L Fermentation above). To detect ECOL the corresponding fractions were analyzed by SDS-PAGE.
SDS-PAGES of ECOL purification

In Figure 6 the SDS-PAGE of the Ni-NTA His tag purification of the lysed culture E. coli KRX containing [http://partsregistry.org/wiki/index.php?title=Part:BBa_K863005 BBa_K863005] (6 L fermentation) including the flow-through, wash and the fractions 1 to 15 (except from fraction 11/12) is shown. The red arrow indicates the band of ECOL with a molecular weight of 53.4 kDa, which appears in all fractions. The strongest bands appear from fractions 3 and 8 with a decreasing amount of other non-specific bands. In summary, the scale up was successful, improving protein production and purification once again.
Furthermore the bands were analyzed by MALDI-TOF and identified as CueO (ECOL).
Since Regionals: 12 L Fermentation E. coli KRX with <partinfo>BBa_K863005</partinfo>

Finally we made another scale-up and fermented E. coli KRX with <partinfo>BBa_K863005</partinfo> in an Bioengineering NLF 22 fermenter with a total volume of 12 L to produce a high amount of the enzyme for further characterization. This time we used HSG autoinduction medium to get a higher biomass. Agitation speed, pO2 and OD600 were determined and we analyzed the glycerin concentration of the samples. The data are illustrated in Figure 7. To adapt to the medium, there is a lag phase of one hour. Between the 3 and 8 hours of cultivation the cells are in the exponential phase. During this phase the cells consumed O2, so that the agitation speed was increased automatically, as well as glycerin. After 11 hours of cultivation the pO2 increased, the glycerin is completely consumed and the cells are in the stationary phase. The maximal OD600 of 11.1 was reached after 15 hours of cultivation. The cells were harvested after 19 hours of cultivation.
Since Regionals: Purification of ECOL
The harvested cells were resuspended in Ni-NTA- equilibration buffer, mechanically disrupted by homogenization and cell debris were removed by centrifugation, microfiltration as well as diafiltration to concentrate the protein concentration in the cell lysate solution. This solution of the cell lysate was loaded on the Ni-NTA column (15 mL Ni-NTA resin) with a flow rate of 1 mL min-1 cm-2. Then the column was washed with 10 column volumes (CV) Ni-NTA equilibration buffer. The bound proteins were eluted by an increasing Ni-NTA elution buffer step elution from 5 % (equates to 25 mM imidazol) with a length of 40 mL, to 50 % (equates to 250 mM imidazol) with a length of 80 mL, to 80 % (equates to 400 mM imidazol) and finally to 100 % (equates to 500 mM imidazol) with a length of 80 mL. This strategy was chosen to improve the purification caused by a step by step increasing Ni-NTA-elution buffer concentration. The elution was collected in 10 mL fractions. Due to the high UV-detection signal of the loaded samples and to simplify the illustration of the detected product peak only the UV-detection signal of the wash step and the elution are shown. A typical chromatogram of purified laccases is illustrated here. The chromatogram of the ECOL elution is shown in Figure 2:
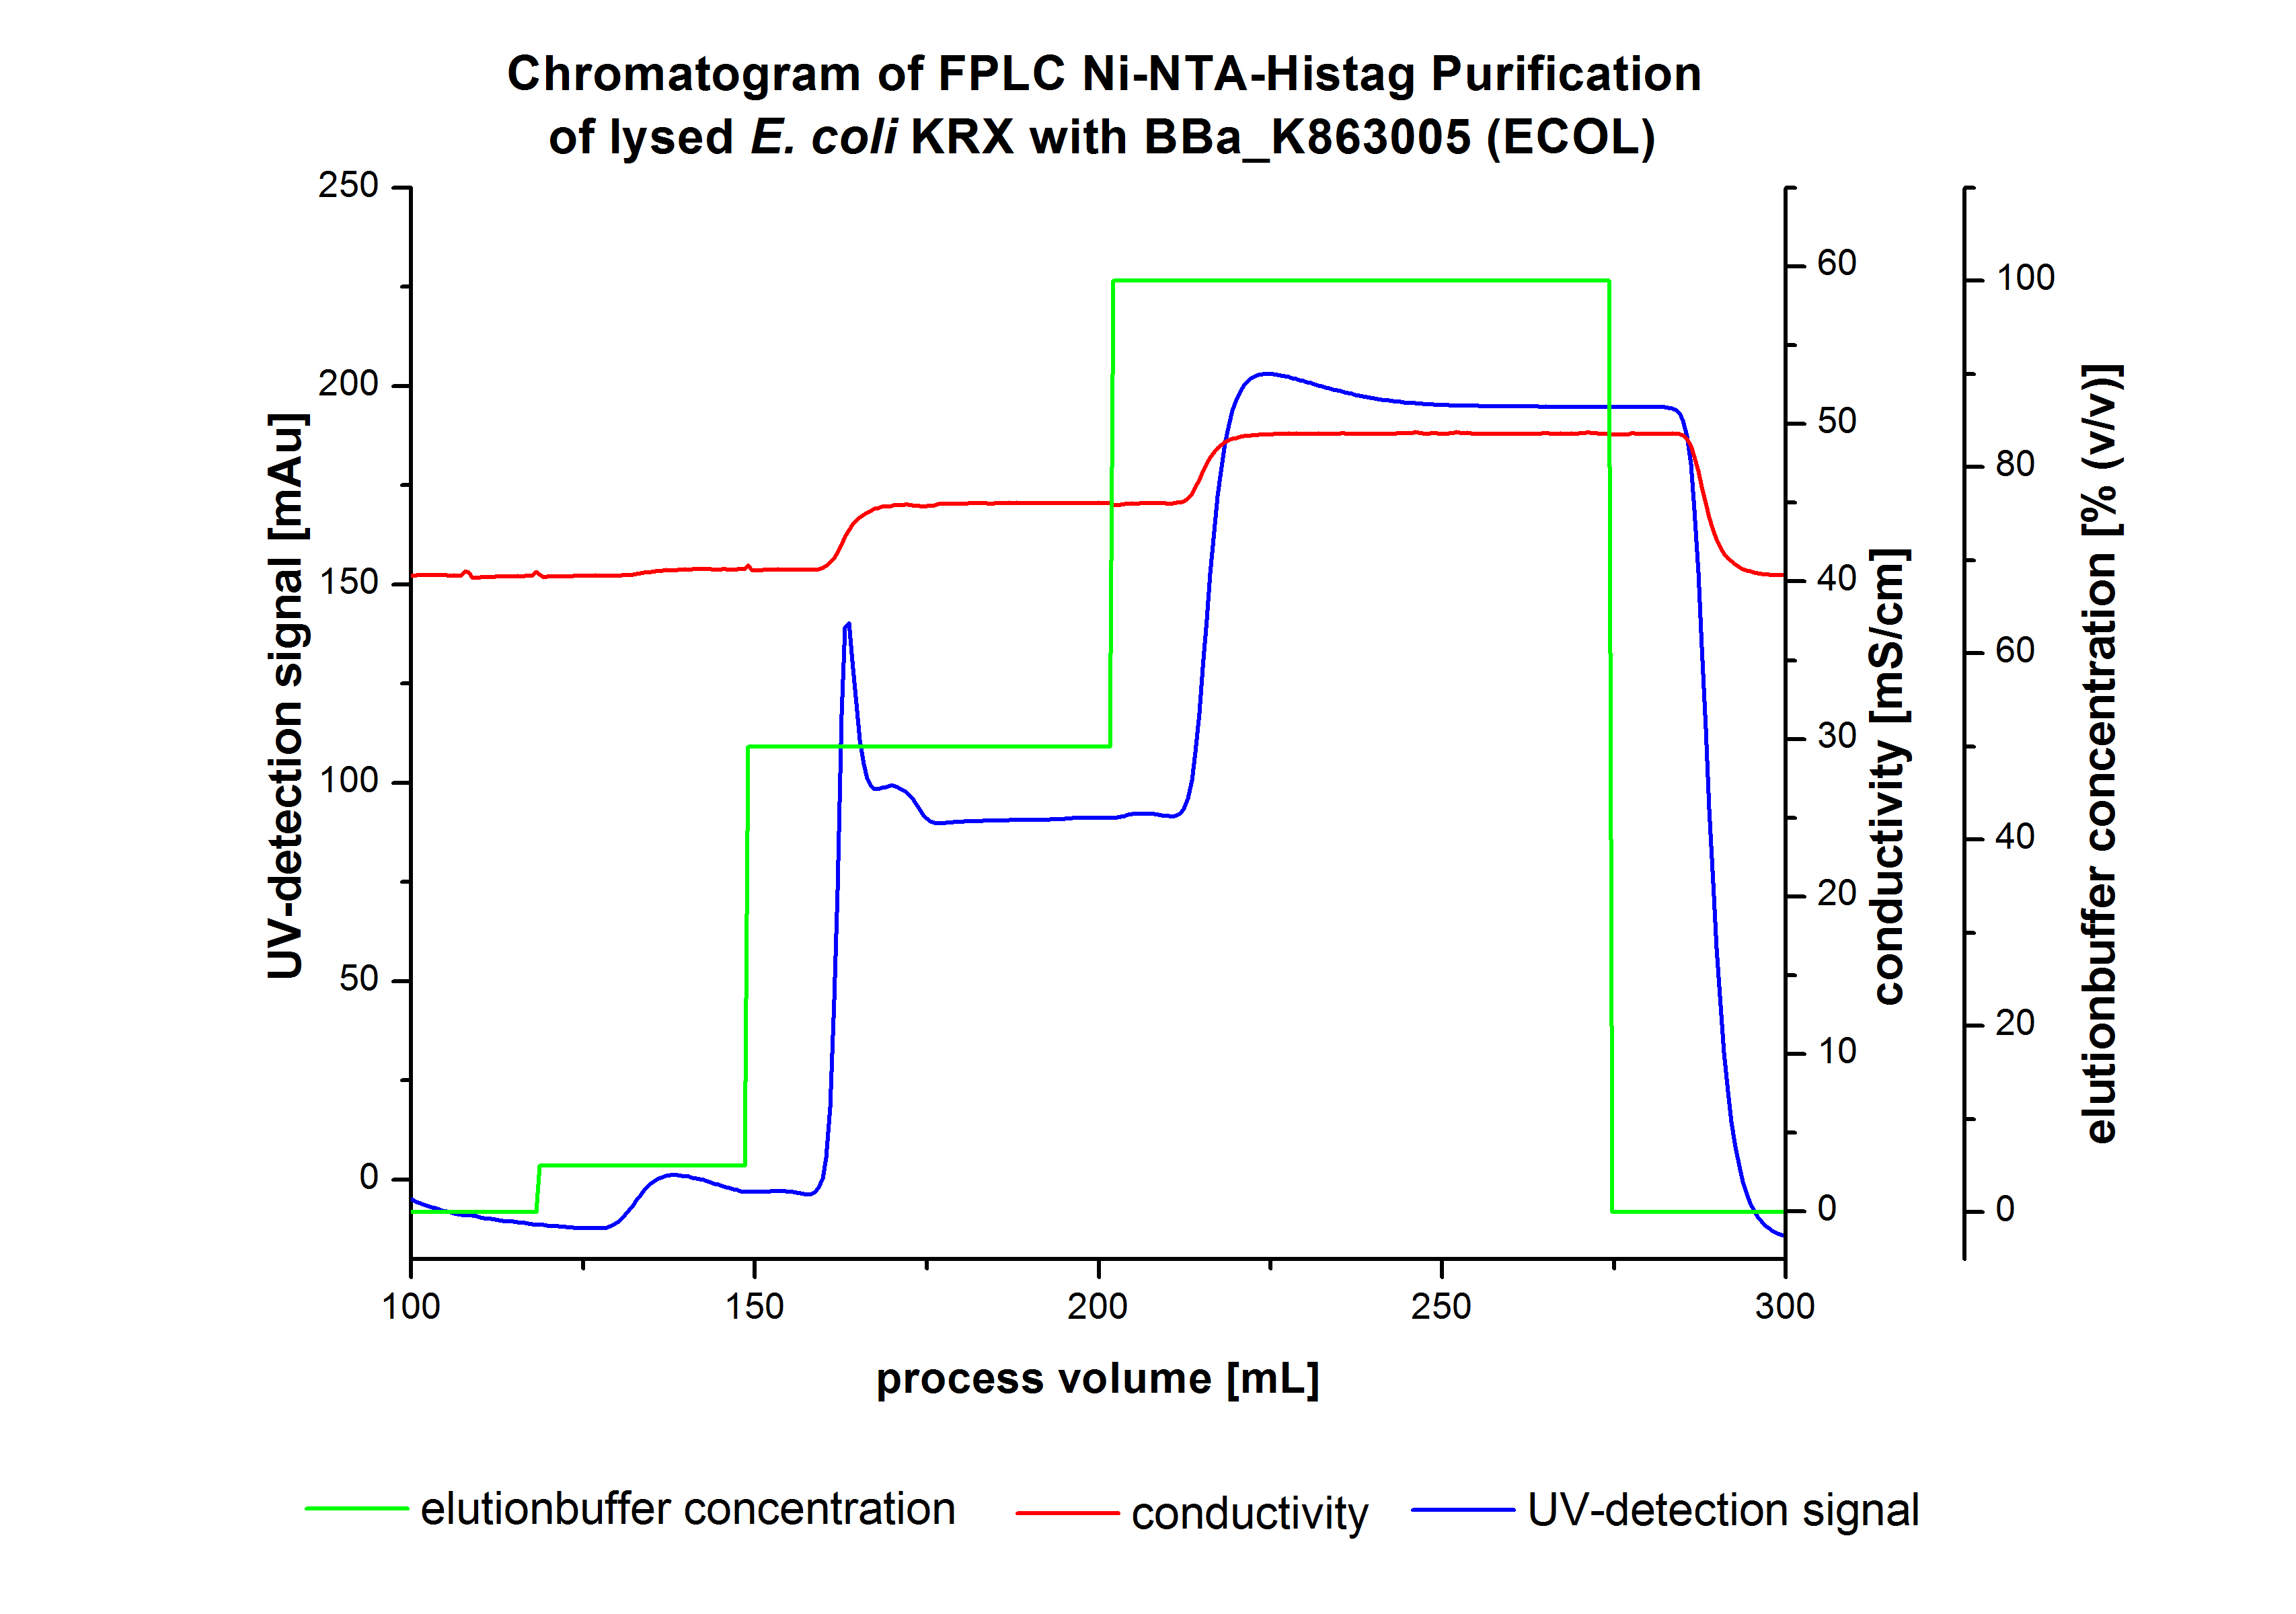
The chromatogram shows two distinguished peaks. The first peak was detected at a Ni-NTA-equilibration buffer concentration of 5 % (equates to 25 mM imidazol) and resulted from the elution of weakly bound proteins. After increasing the Ni-NTA elution buffer concentration to 50 % (equates to 250 mM imidazol), an UV-detection signal peak of 140 mAU was measured. The area of this peak indicates that a high amount of protein was eluted. In addition, a second peak right behind the first peak can be detected. At this point it is not clear wich peak contains our product and which peak is cause by impurities. The corresponding fractions were analyzed by SDS-PAGE to detect ECOL. A last peak can be detected after increasing the elutionsbuffer concentration to 100%(equates to 500 mM imidazol). This peak could be explained by impurities which were strongly bound on the Ni-NTA-resin. All corresponding fractions with an UV-signal were analysed by SDS-PAGES. The Results are shown in Figure 3.
MALDI-TOF Analysis of ECOL
The E. coli laccase was identified using the following software
- FlexControl
- Flexanalysis and
- Biotools
Activity Analysis of [http://partsregistry.org/wiki/index.php?title=Part:BBa_K863005 ECOL]
Initial activity tests of purified fractions
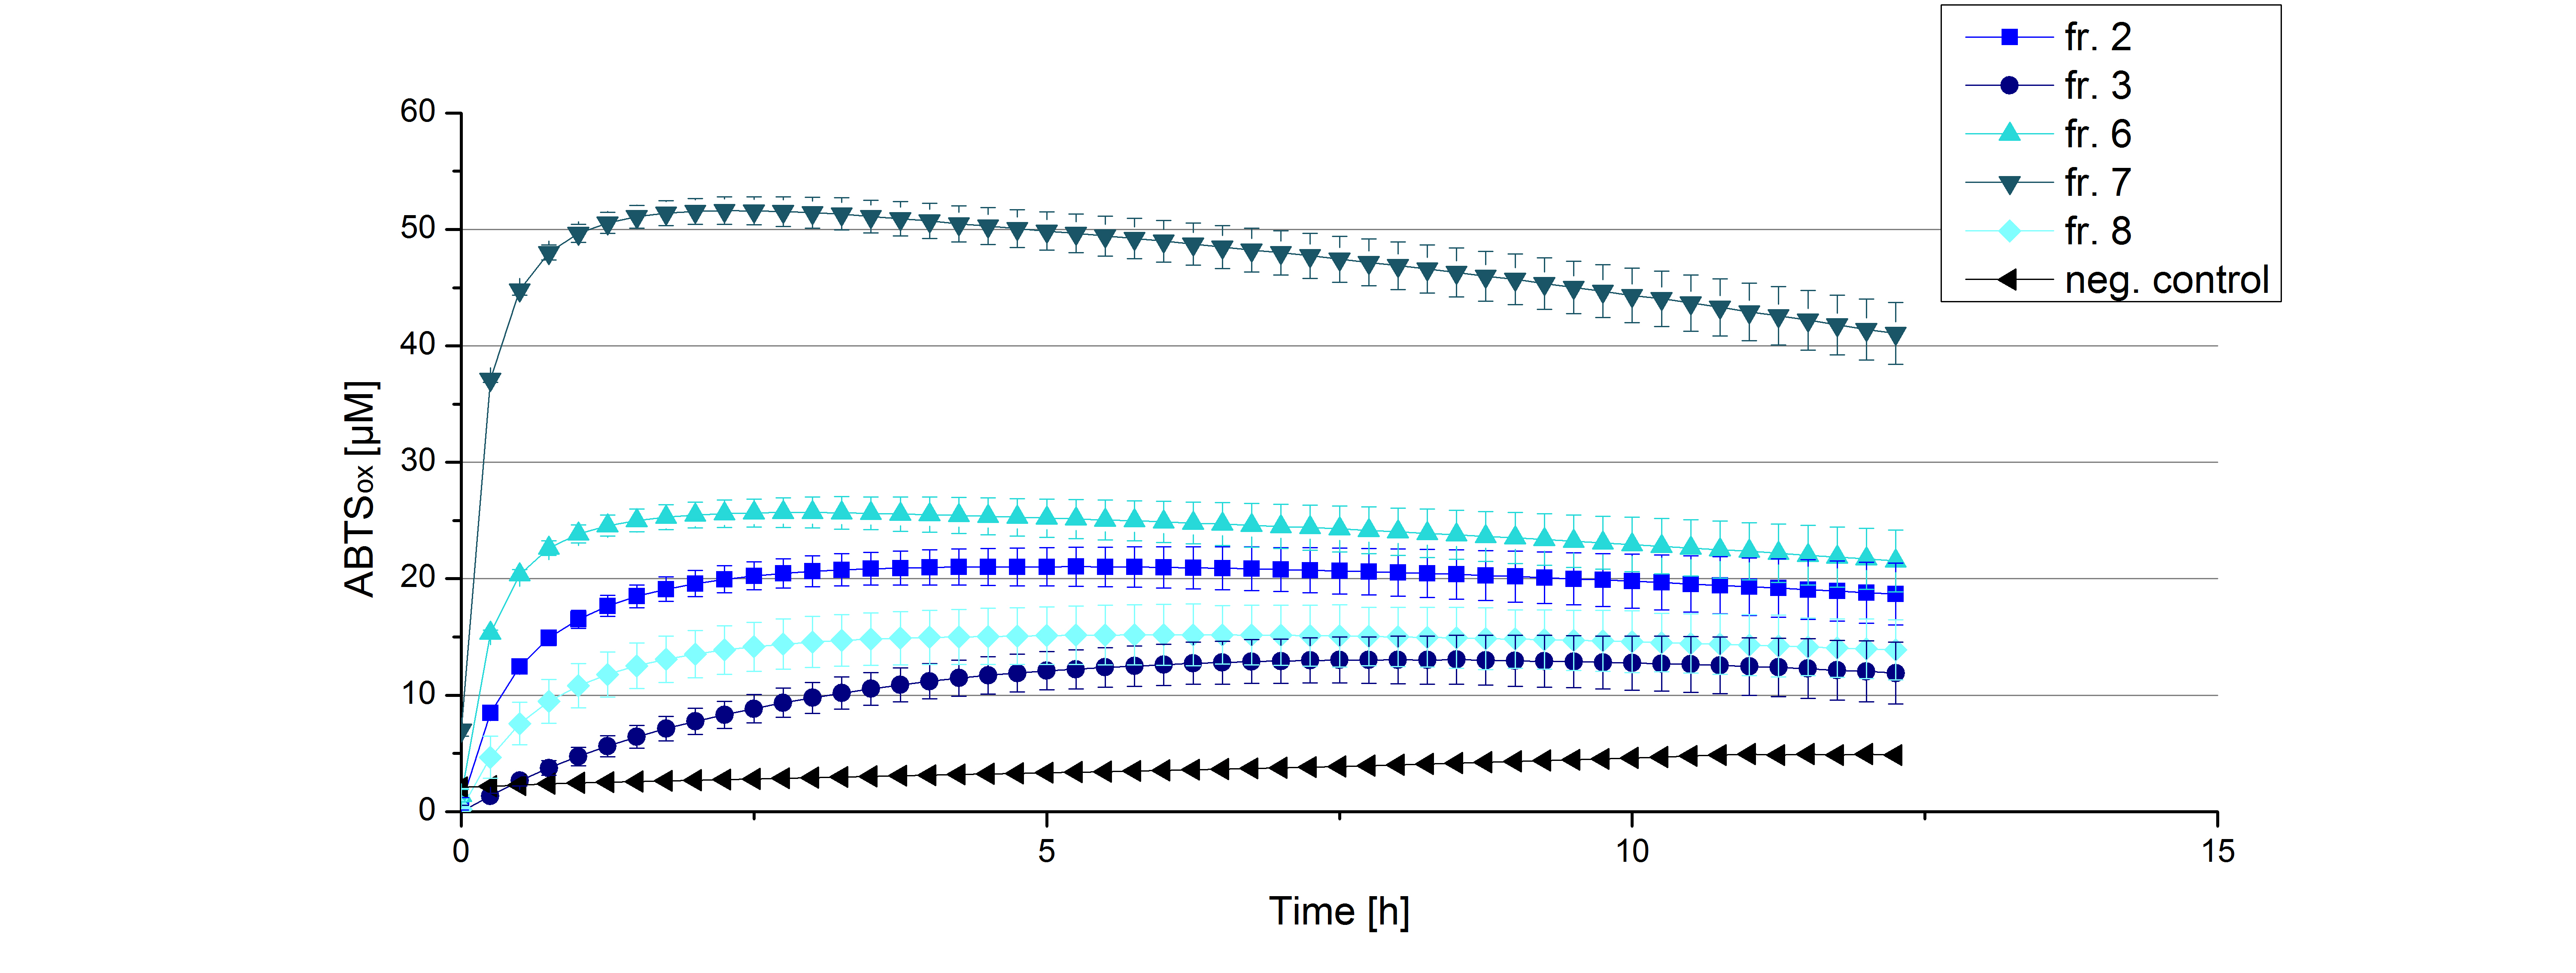
Initial tests were done with elution fractions 2,3,6,7 and 8 to determine the activity of the purified [http://partsregistry.org/Part:BBa_K863005 ECOL] laccase. The fractions were rebuffered into deionized H2O using [http://www.sigmaaldrich.com/content/dam/sigma-aldrich/docs/Supelco/Product_Information_Sheet/4774.pdf HiTrap Desalting Columns] and incubated with 0.4 mM CuCl2. The reaction setup included 140 µL of a elution fraction, 100 mM sodium acetate buffer (pH 5), and 198 deionized H2O and 0.1 mM ABTS and the absorption was measured at 420 nm to detect oxidization over a time period of 12 hours at 25°C. Each fraction contained active laccase able to oxidize ABTS (see Figure 9). After 1 hour saturation was observed with ~52 µM oxidized ABTS. After 12 hours ~10 µM ABTS got reduced again, if referred to fraction 6. This behavior has been observed in the activity plot ofTVEL0 before, indicating, that the oxidation catalyzed by this laccase is reversible. Additionally protein concentrations of each fraction were identified using the Bradford protocol. The tested fractions showed different amounts of protein after rebuffering, ranging from 0.2 to 0.6 mg mL-1. Fraction 7, containing the most protein and also most of active laccase was chosen for subsequent activity tests of [http://partsregistry.org/Part:BBa_K863005 ECOL]. The protein concentration was reduced to 0.03 mg mL-1 for each measured sample to allow a comparison between TVEL0 measurements and [http://partsregistry.org/Part:BBa_K863005 ECOL] measurements.
[http://partsregistry.org/Part:BBa_K863005 ECOL] pH optimum
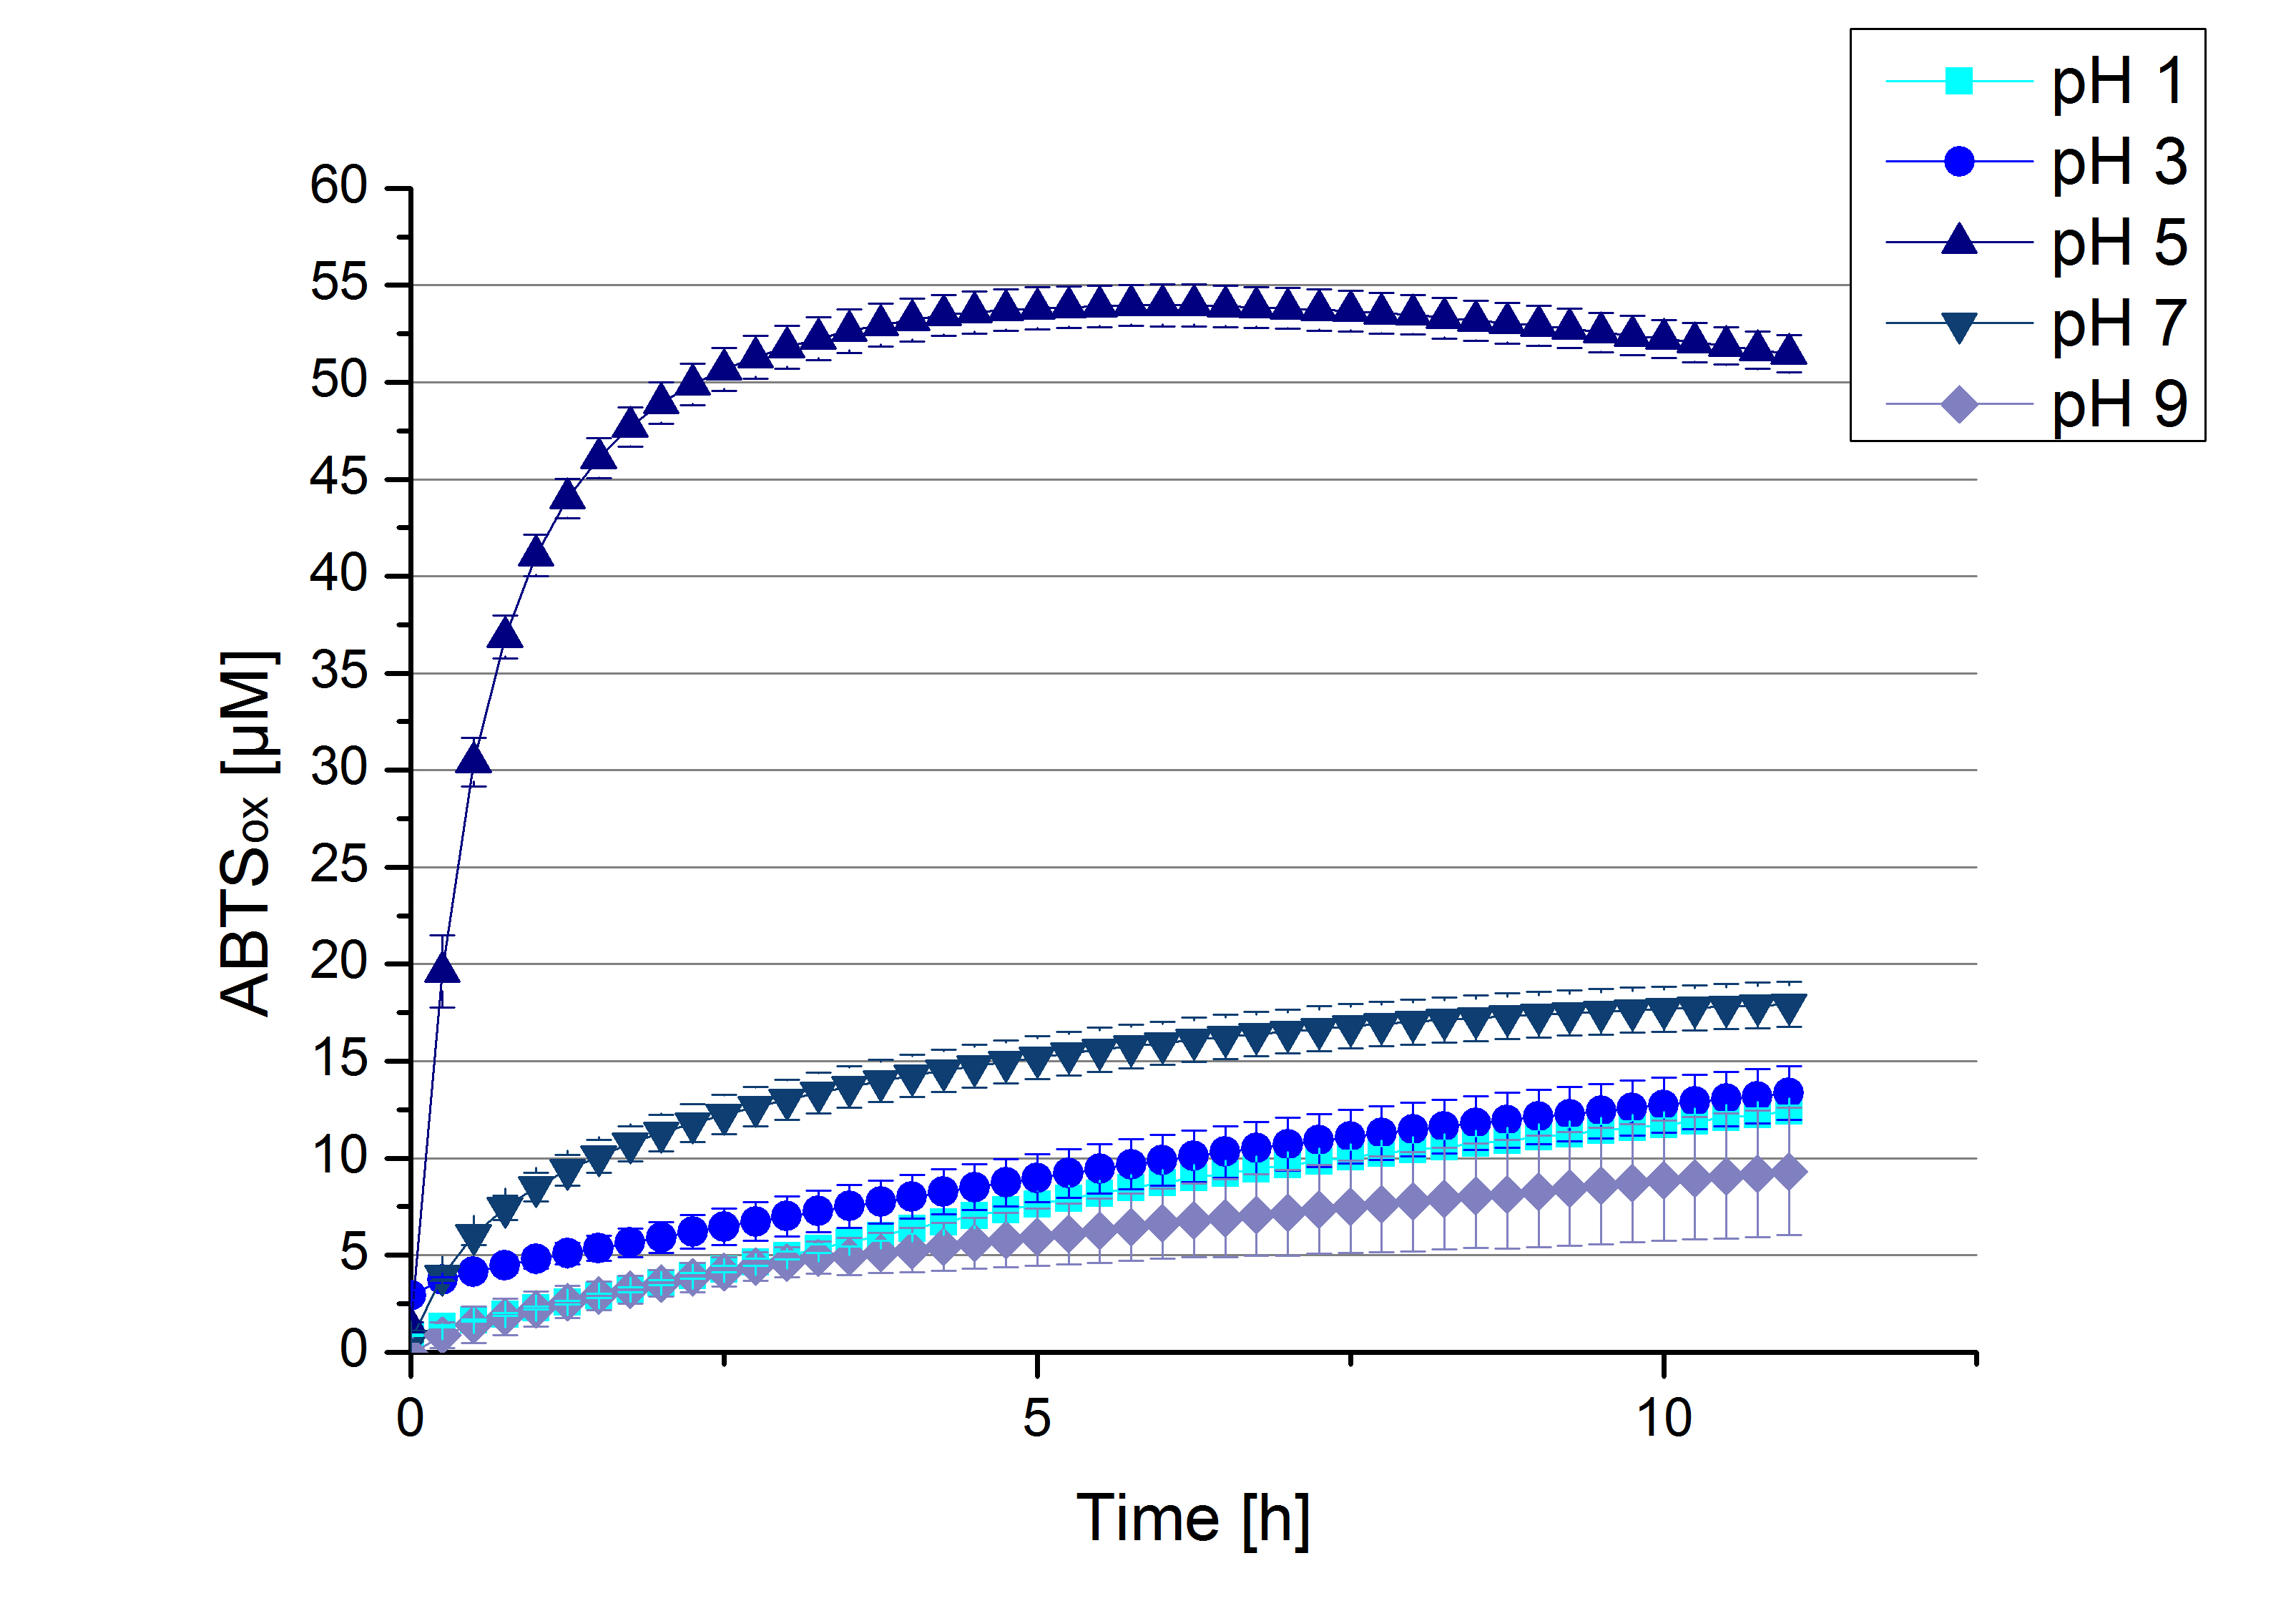
To determine at which pH the [http://partsregistry.org/Part:BBa_K863005 ECOL] laccase has its optimum in activity, a gradient of sodium acetate buffer pHs was prepared. Starting with pH 1 to pH 9 [http://partsregistry.org/Part:BBa_K863005 ECOL] activity was tested using the described conditions above and 0.03 mg mL-1 protein. The results are shown in Figure 10. A distinct pH optimum can be seen at pH 5. Saturation is reached after 2.5 hours with 53% oxidization of ABTS by the [http://partsregistry.org/Part:BBa_K863005 ECOL] laccase at pH 5 (53 µM oxidized ABTS). The other tested pHs only led to a oxidation of up to 17% of added ABTS, respectively. Figure 11 shows the results of the analog experiments with laccase that was not incubated with CuCl2 before the activity measurements. Again, a pH optimum at pH 5 can be determined with 24 µM ABTS (24%) oxidized by [http://partsregistry.org/Part:BBa_K863005 ECOL] after 8 hours under these conditions.
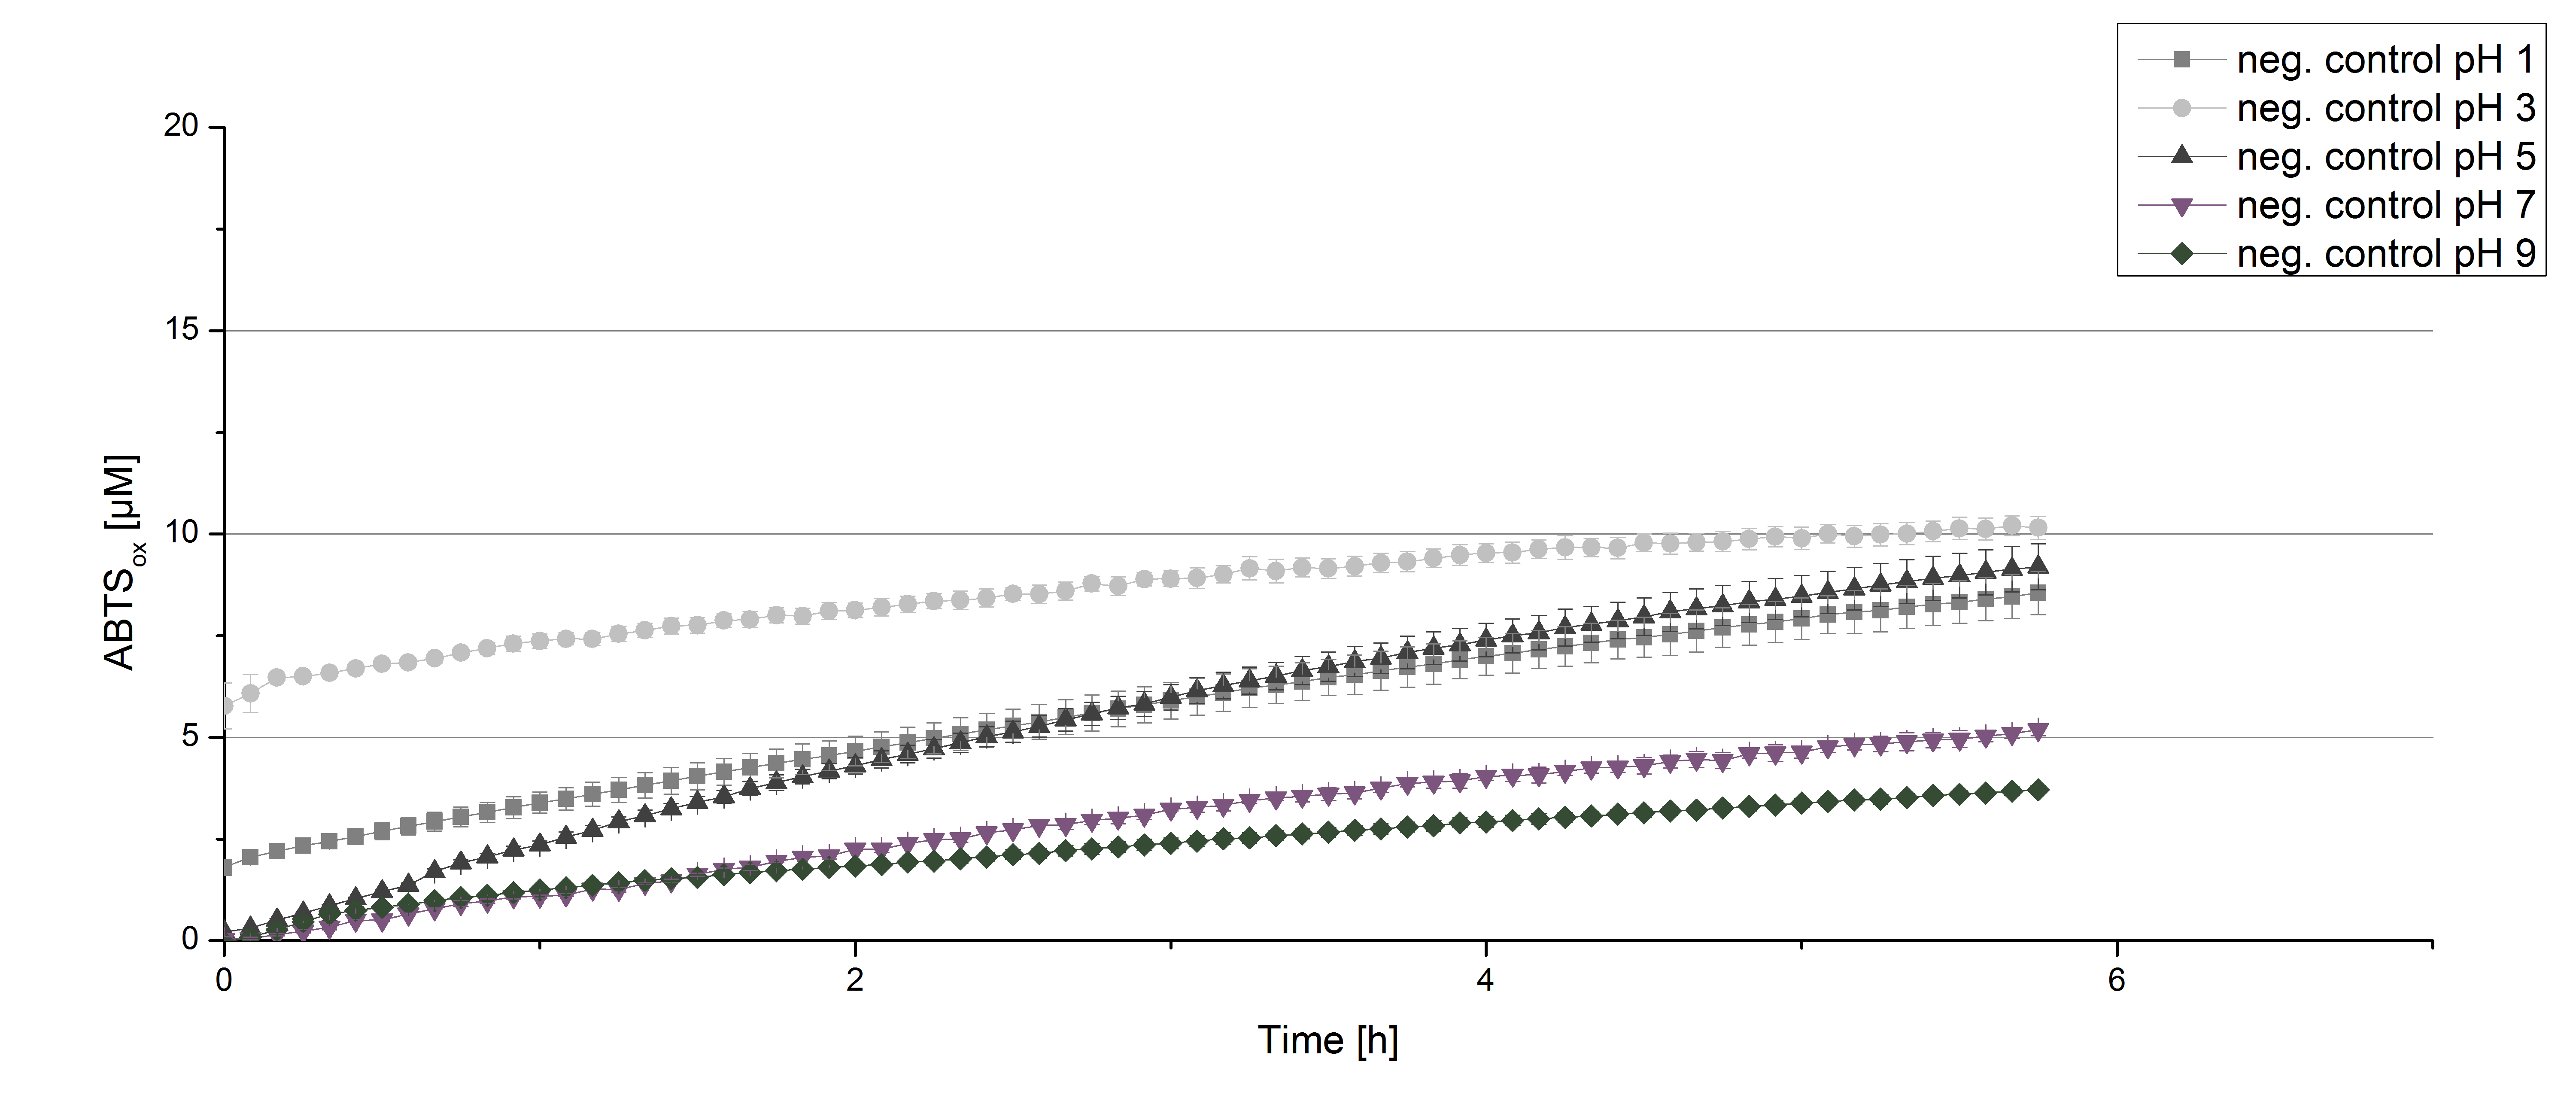
Figure 12 represents the negative control showing the oxidization of ABTS by 0.4 mM CuCl2 at the chosen pHs. The greatest increase in oxidized ABTS can be seen at a pH of 5: after 5 hours 15% ABTS is oxidized by CuCl2 alone. Nevertheless this result does not have an impact on the activity of the [http://partsregistry.org/Part:BBa_K863005 ECOL] laccase at pH 5, which is still the optimal pH. Therefore it has the same pH optimum as TVEL0.
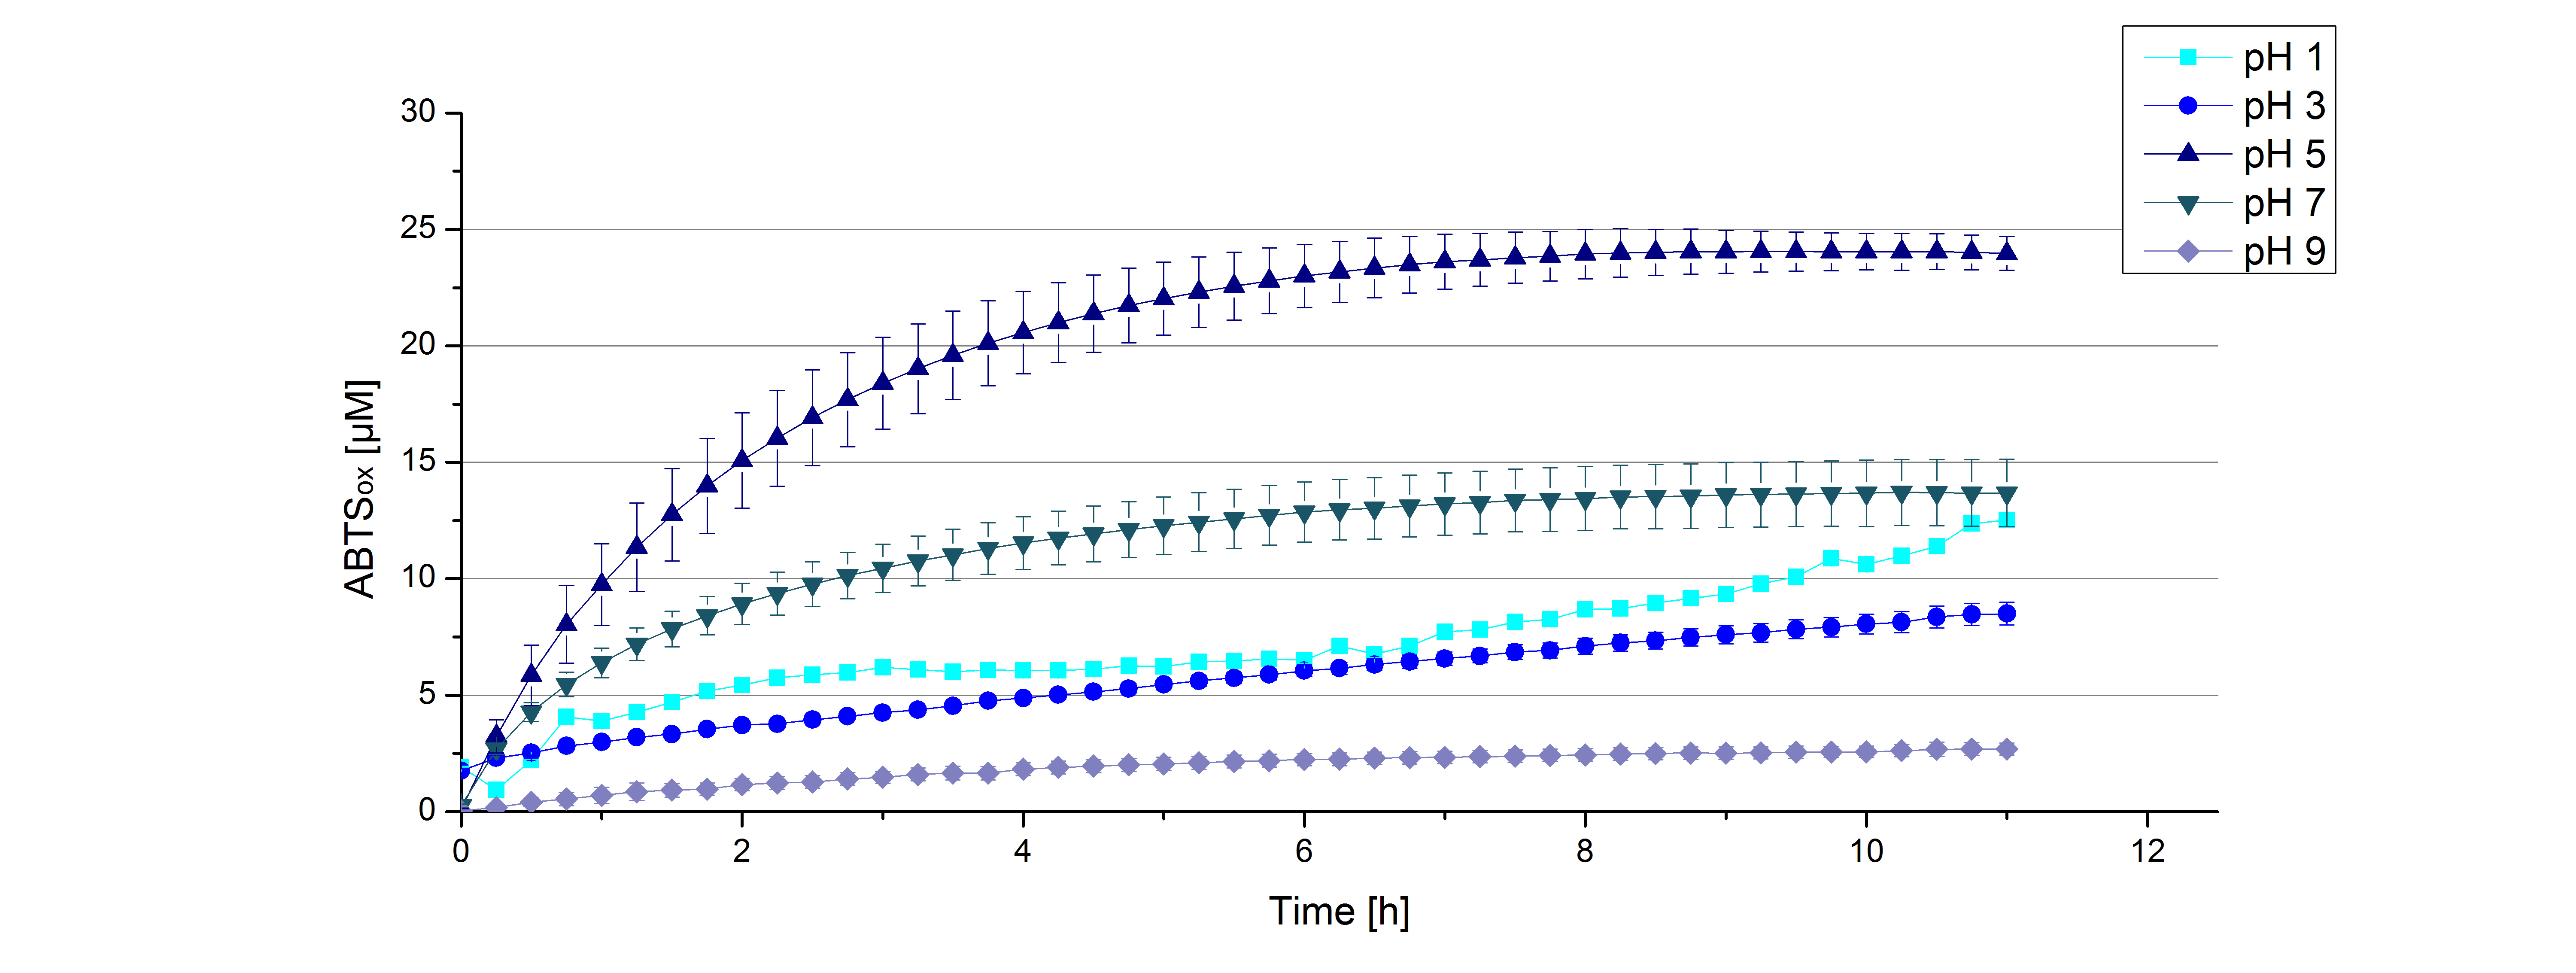
With regard to our project knowledge of the optimal pH is useful. Since waste water in waste water treatment plants has an average
pH of 6.9 it has to be kept in mind, that a adjustment of the pH is necessary for optimal laccase activity.
[http://partsregistry.org/Part:BBa_K863005 ECOL] CuCl2 concentration
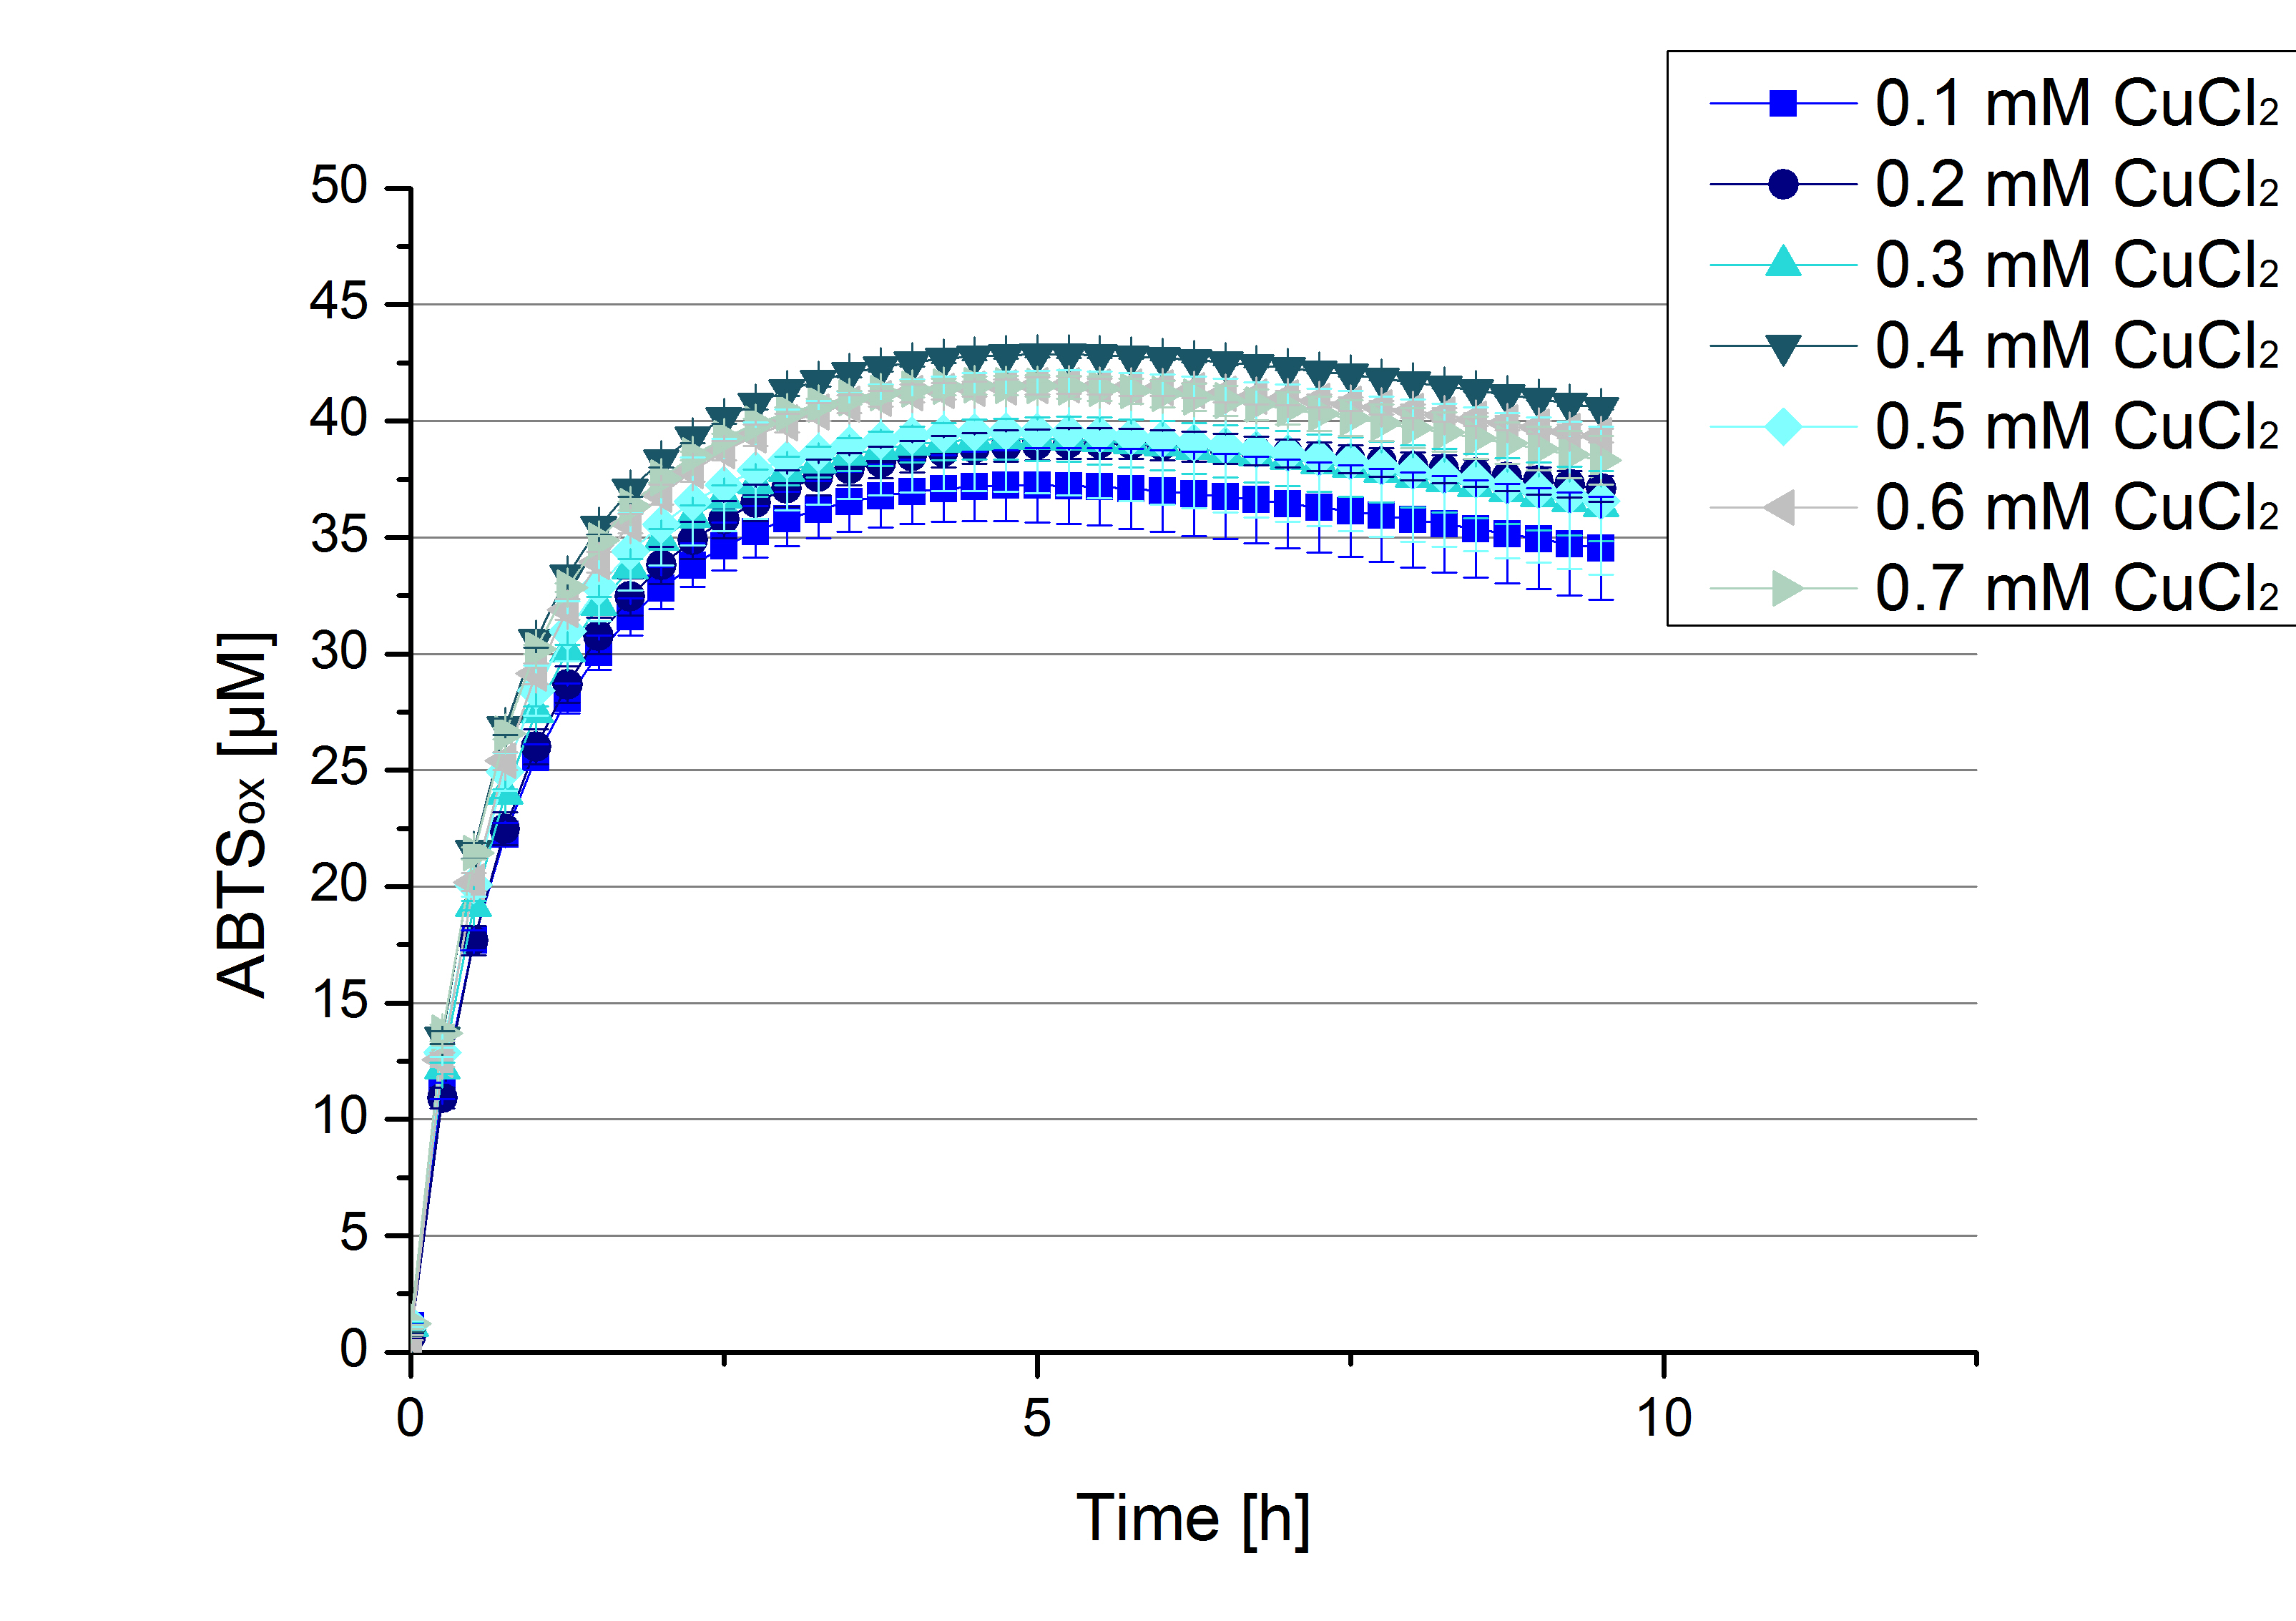
Another test of [http://partsregistry.org/Part:BBa_K863005 ECOL] was done to survey the best CuCl2 concentration for the activity of the purified [http://partsregistry.org/Part:BBa_K863005 ECOL] laccase. 0.03 mg mL-1 protein were incubated with different CuCl2 concentration ranging from 0 to 0.7 mM CuCl2. Activity tests were performed with the incubated samples, in 100 mM sodium actetate buffer (pH 5), 0.1 mM ABTS, to a final volume of 200 µL. The activity was measured at 420 nm, 25°C and over a time period of 10 hours. As expected the saturation takes place after 5 hours (see Figure 13). The differences in the activity of [http://partsregistry.org/Part:BBa_K863005 ECOL] laccase incubated in different CuCl2 differ minimal. The highest activity of [http://partsregistry.org/Part:BBa_K863005 ECOL] laccase is observed after incubation with 0.4 mM CuCl2 (42% of added ABTS). With a higher concentration of 0.7 mM CuCl2 the activity seems to be reduced (only 41% ABTS got oxidized). This leads to the assumption that CuCl2 supports the [http://partsregistry.org/Part:BBa_K863005 ECOL] laccase activity but concentrations exceeding this value of CuCl2 may have a negative impact on the ability of oxidizing ABTS. Without any CuCl2 application [http://partsregistry.org/Part:BBa_K863005 ECOL] laccase show less activity in oxidizing ABTS (see Figure 12). This fits the expectations as laccases are copper reliant enzymes and gain their activity through the incorporation of copper. Additionally negative controls were done using the tested concentrations of CuCl2 but no laccase was added to detect the oxidization of ABTS through copper (see Figure 14). The more CuCl2 was present, the more ABTS was oxidized after 5 hours. Still the maximal change accounts only for ~6% oxidized ABTS after 5 hours.
In relation to apply the laccase in waste water treatment plants it is beneficial knowing, that small amounts of CuCl2 are enough to activate the enzymes. This reduces the cost factor for the needed CuCl2 to incubate the laccases before application.
[http://partsregistry.org/Part:BBa_K863005 ECOL] activity at different temperatures
To investigate the activity of [http://partsregistry.org/Part:BBa_K863005 ECOL] at lower temperatures activity tests as described above were done at 10°C and 25°C (Figure 15). A significant decrease in the activity can be observed upon reducing the temperature from 25°C to 10°C. While the activity at 10 °C is reduced, final saturation levels are still comparable: after 3,5 hours, only 2% difference in oxidized ABTS is observable. The negative control without the [http://partsregistry.org/Part:BBa_K863005 ECOL] laccase and only 0.4 mM CuCl2 at 10°C shows a negligible oxidation of ABTS. Although a decrease in the activity of [http://partsregistry.org/Part:BBa_K863005 ECOL] laccase was expected the observed reduction in enzyme activity is problematic for the possible application in waste water treatment plants where the temperature differs from 8.1°C to 20.8°C. A more cryo tolerant enzyme would be preferable.
[http://partsregistry.org/Part:BBa_K863005 ECOL] activity depending on different ABTS concentrations
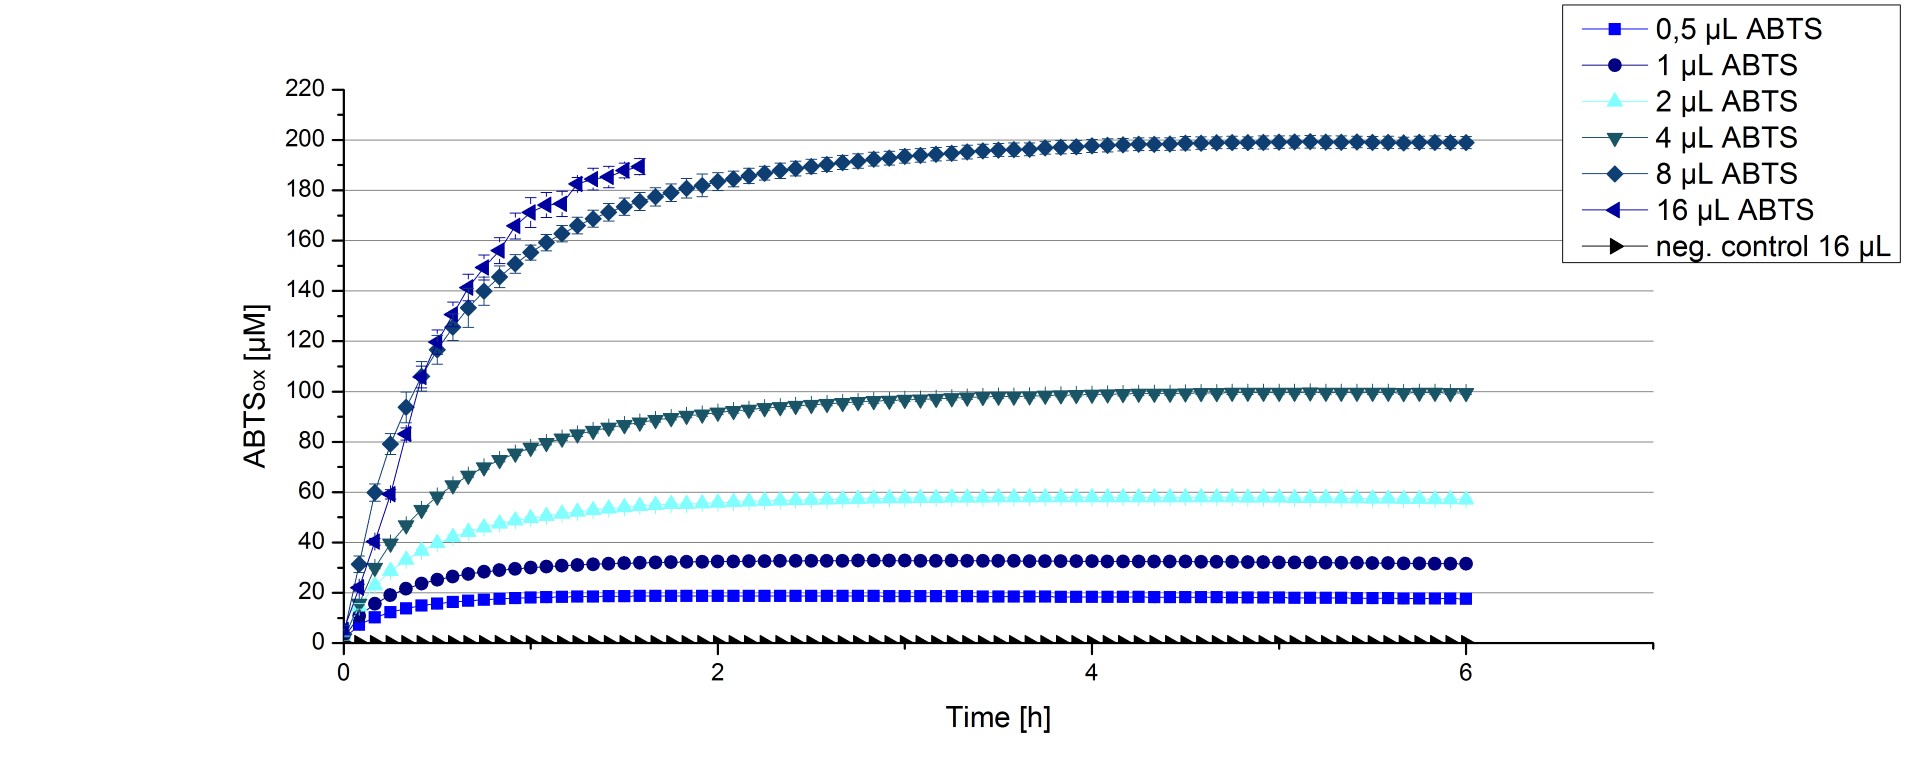
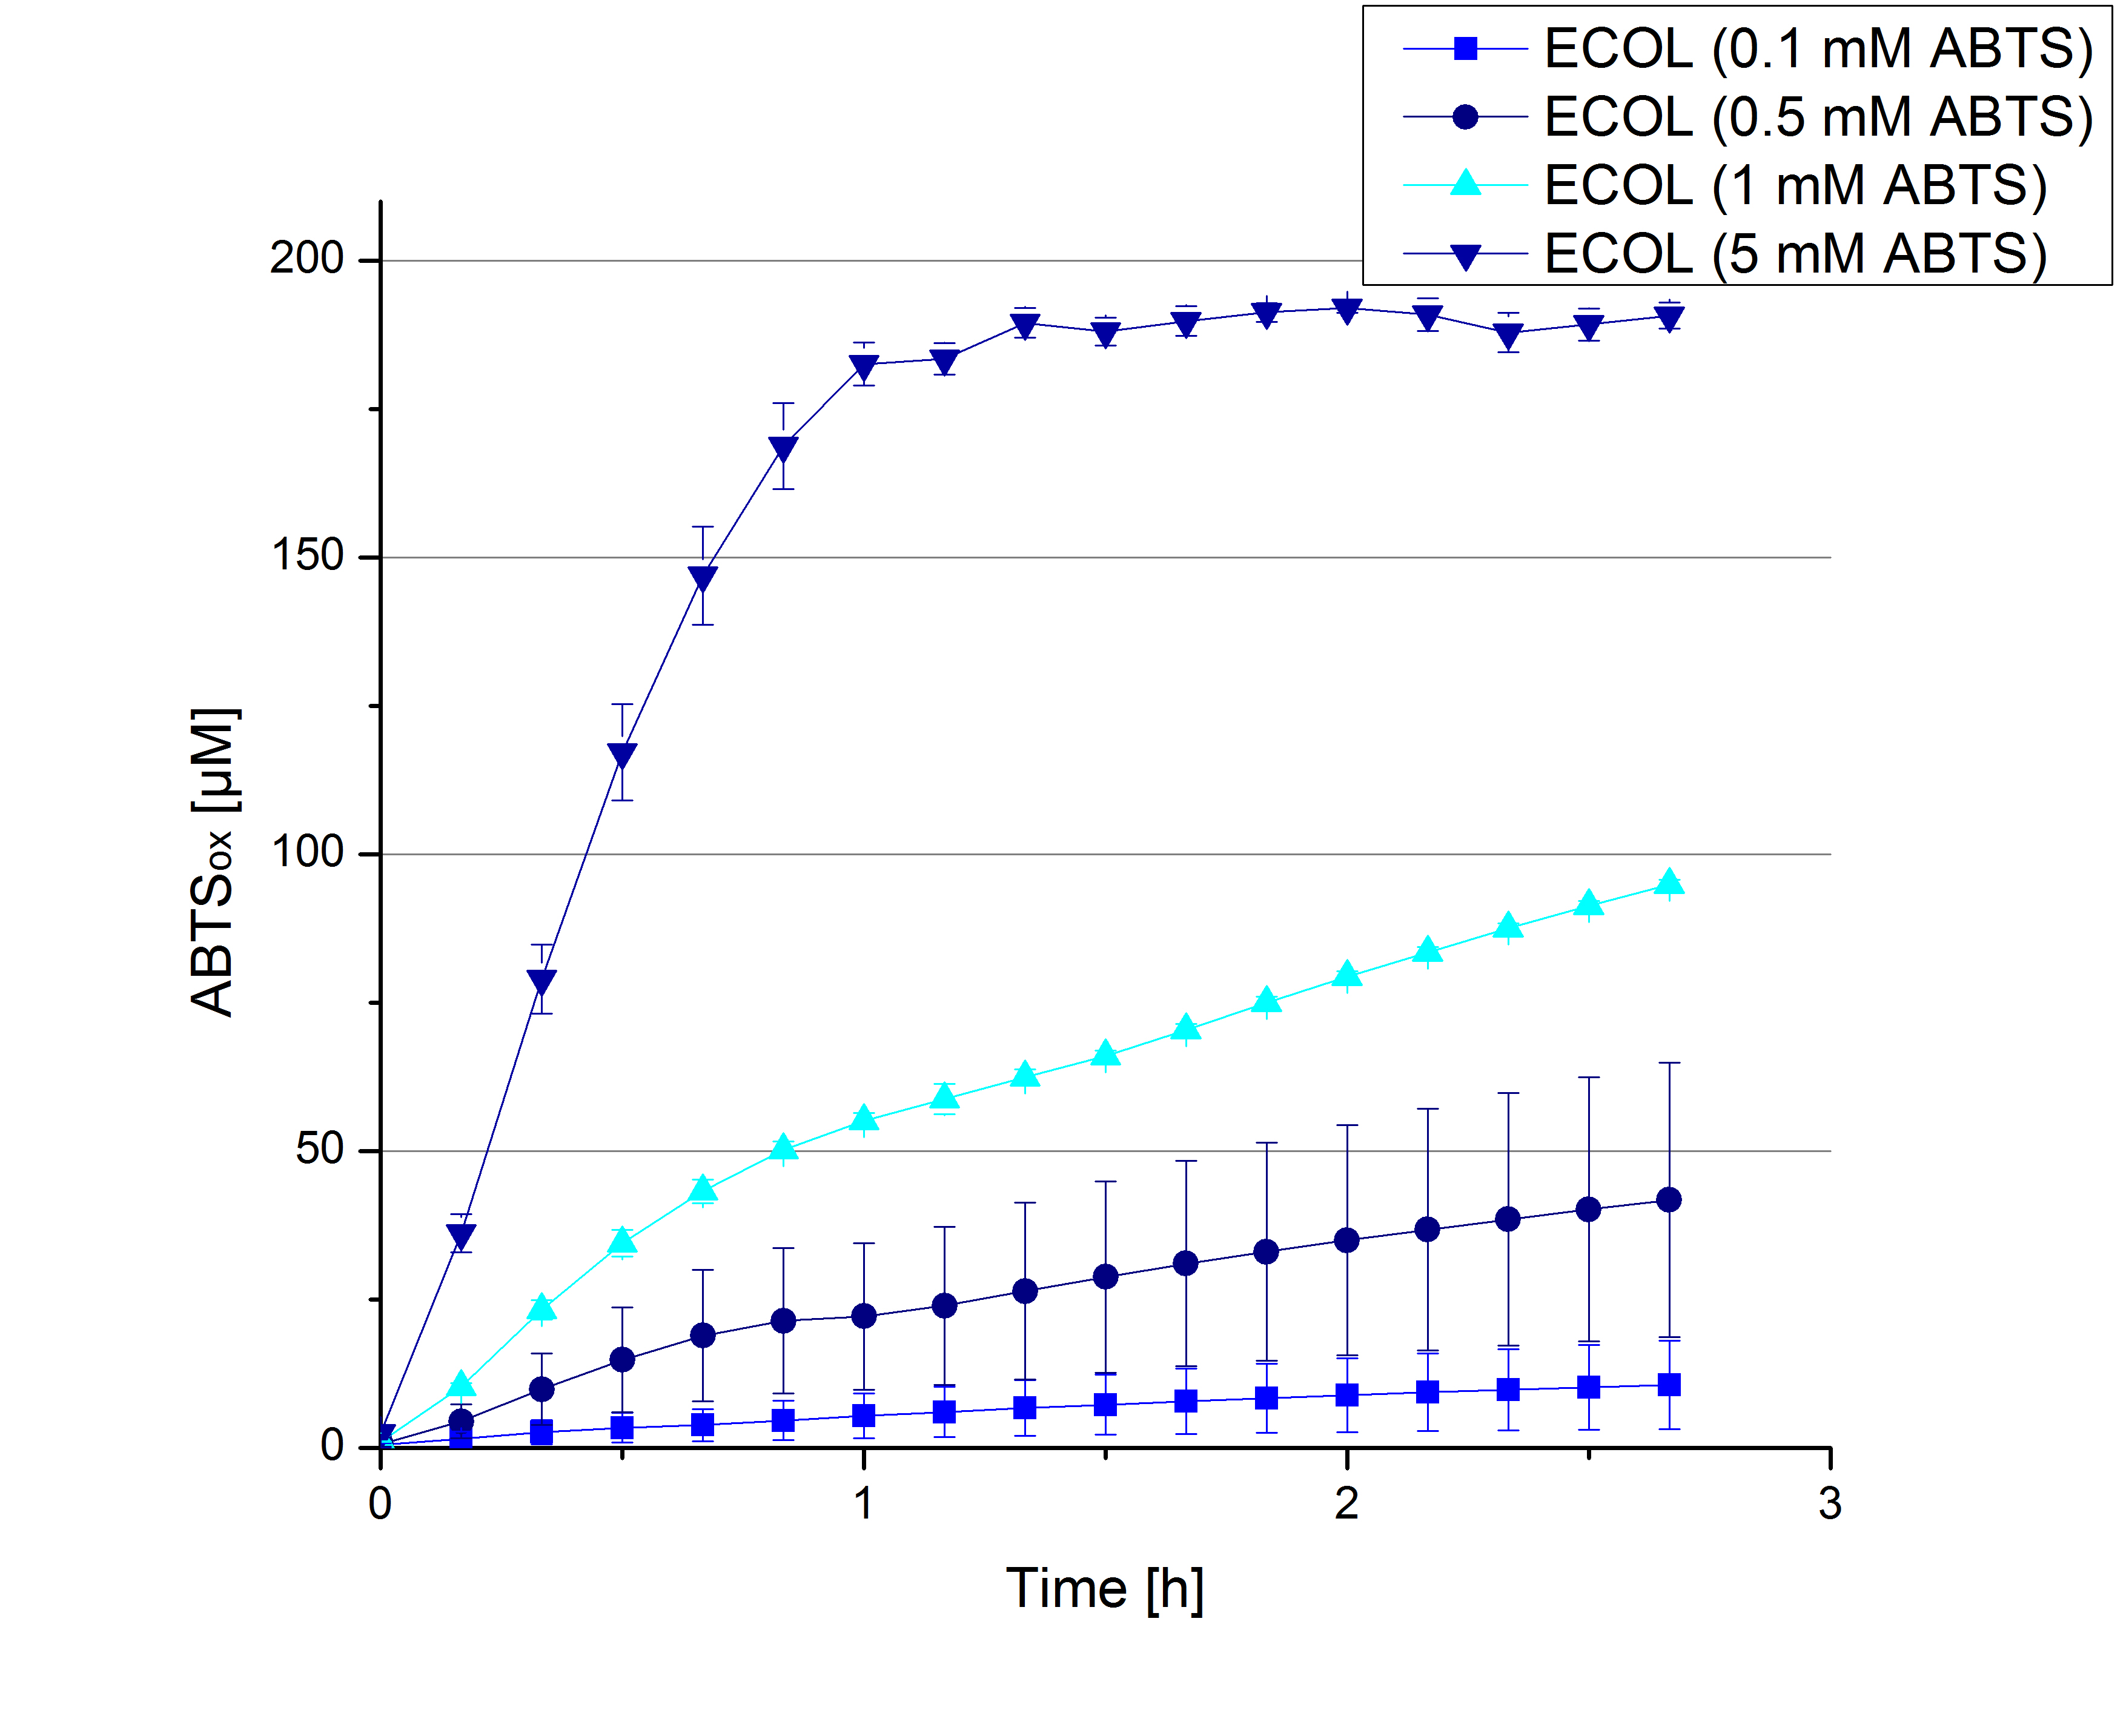
Furthermore [http://partsregistry.org/Part:BBa_K863005 ECOL] laccase were tested using different amounts of ABTS to calculate KM and Kcat values. The same measurement setup as described above was used only with different amounts of ABTS. As anticipated the amount of oxidized ABTS increased in dependence of the amount of ABTS used (Figure 16). The results of the measurements of the samples tested with 16 µL could not be detected longer than 1.5 h because the values were higher than the detection spectrum of the device used (TecanReader).
Impact of MeOH and acetonitrile on [http://partsregistry.org/Part:BBa_K863005 ECOL]
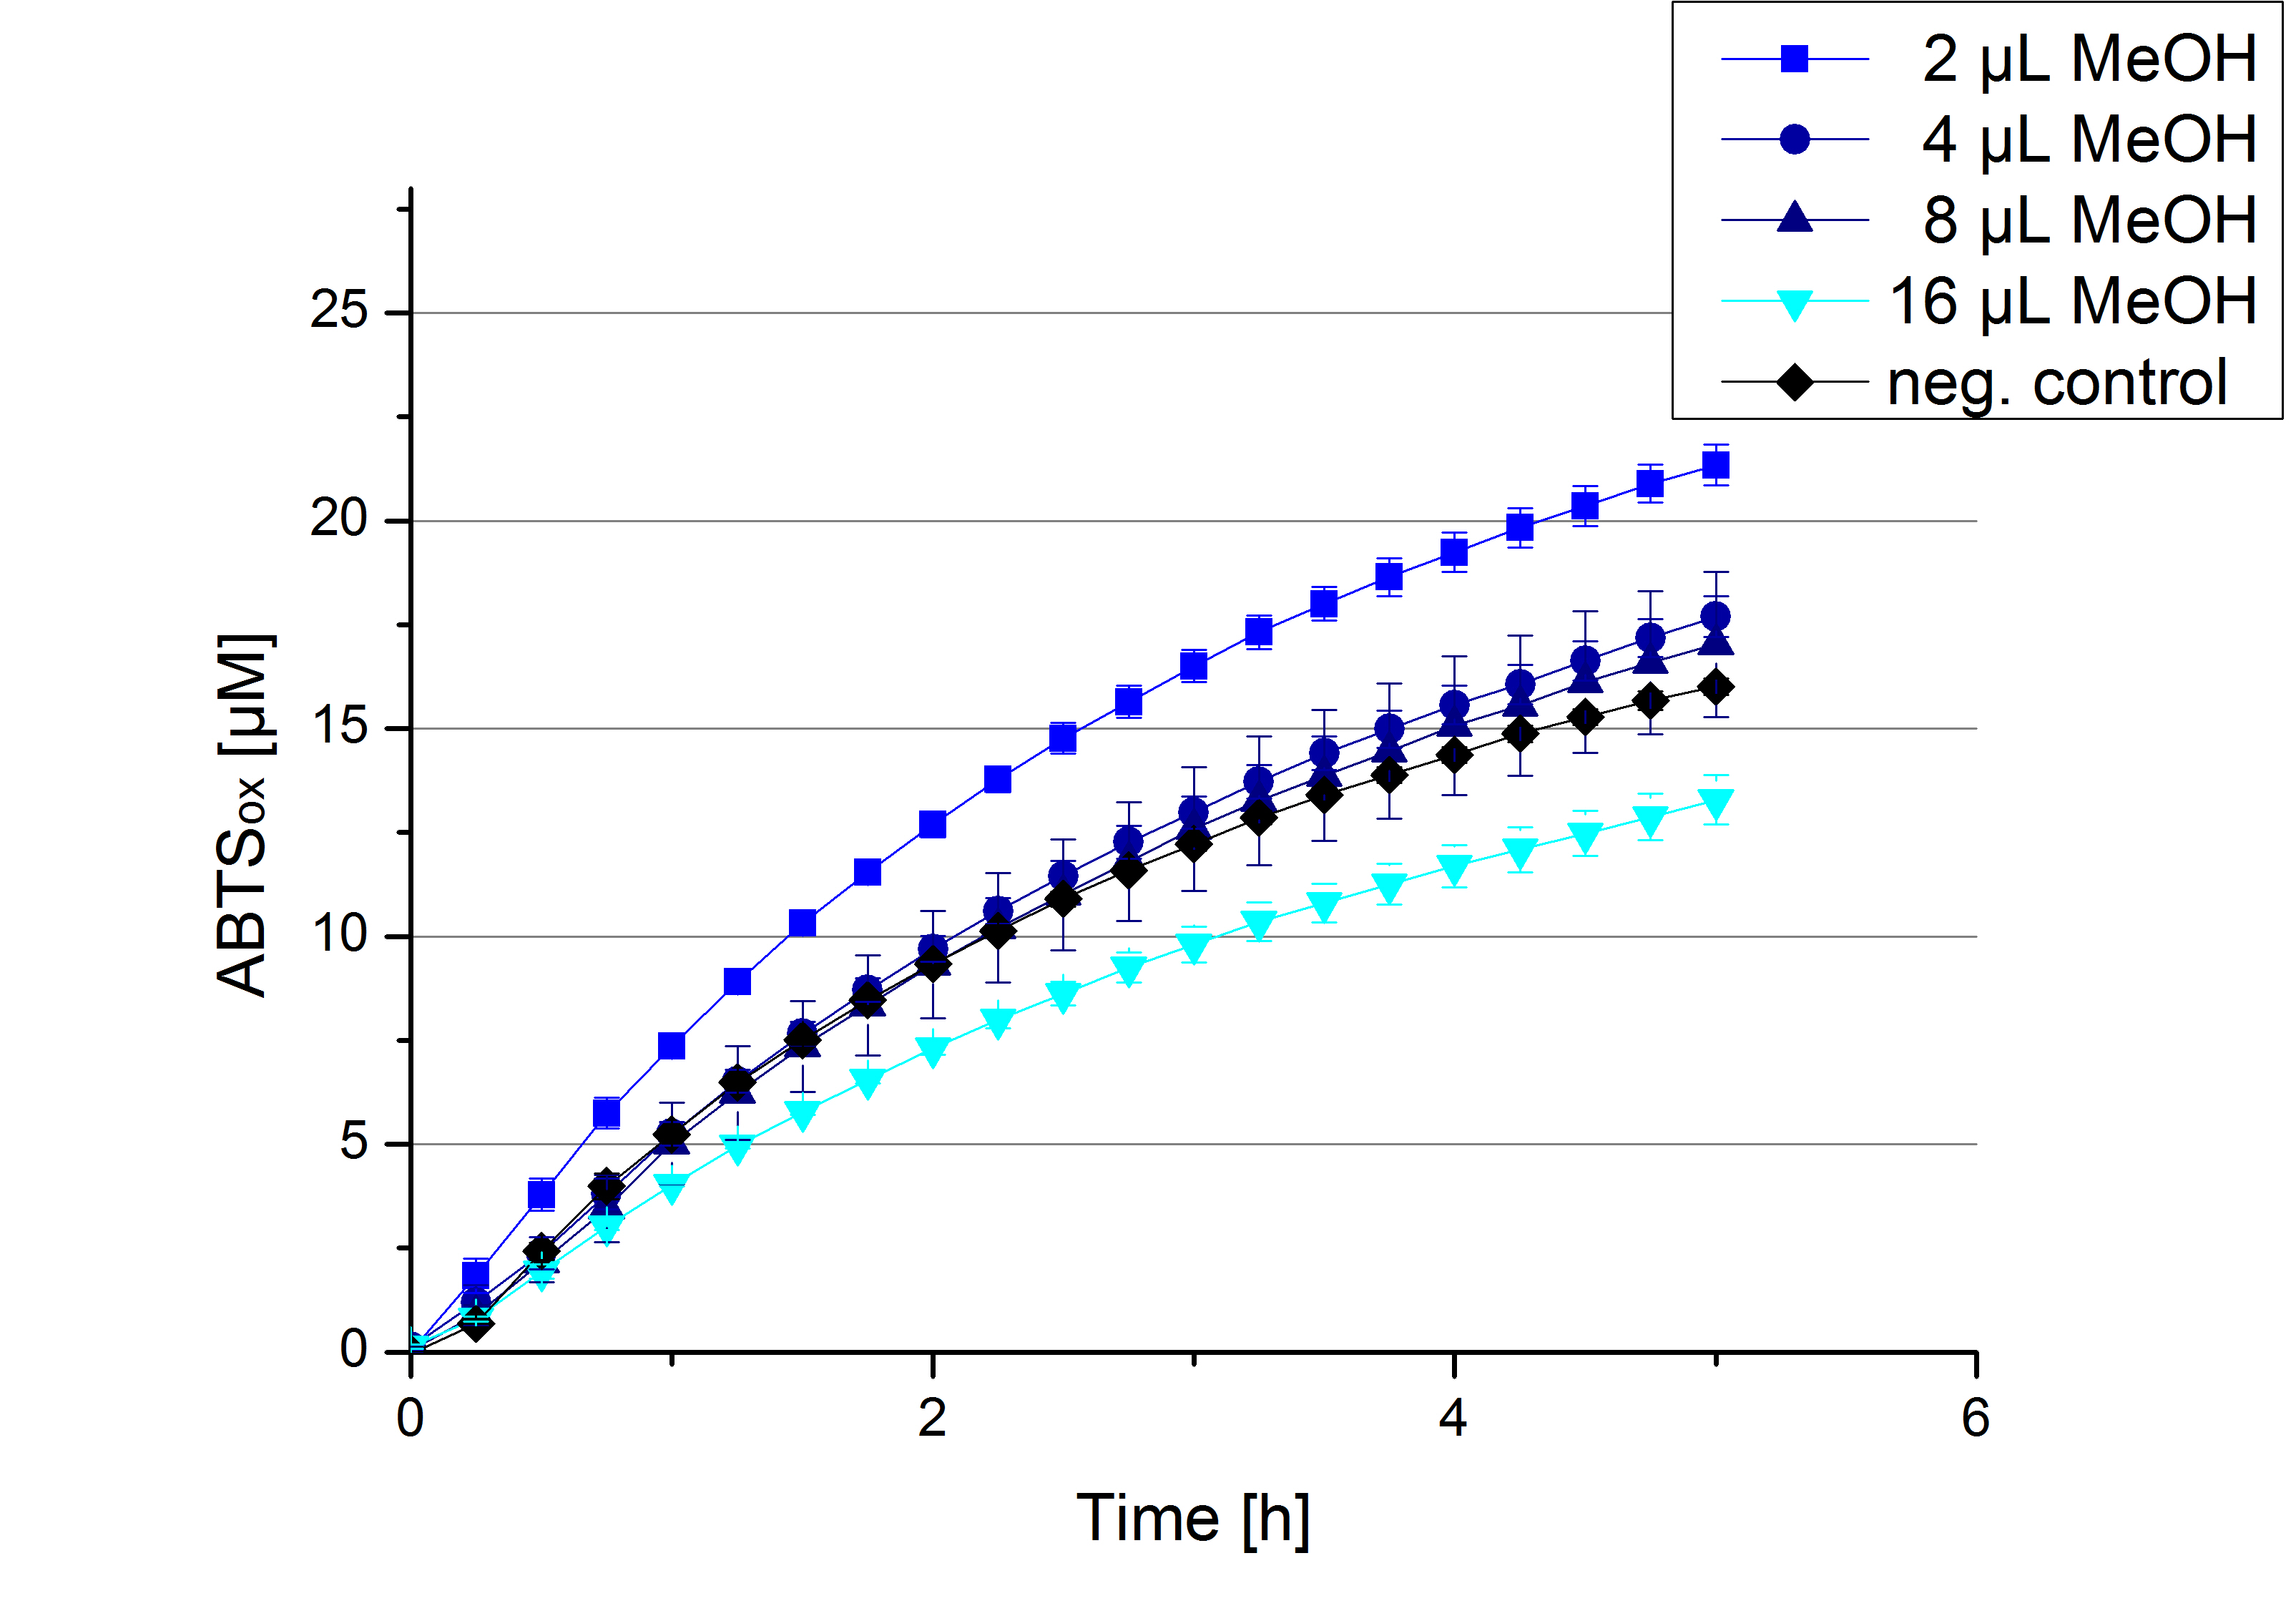
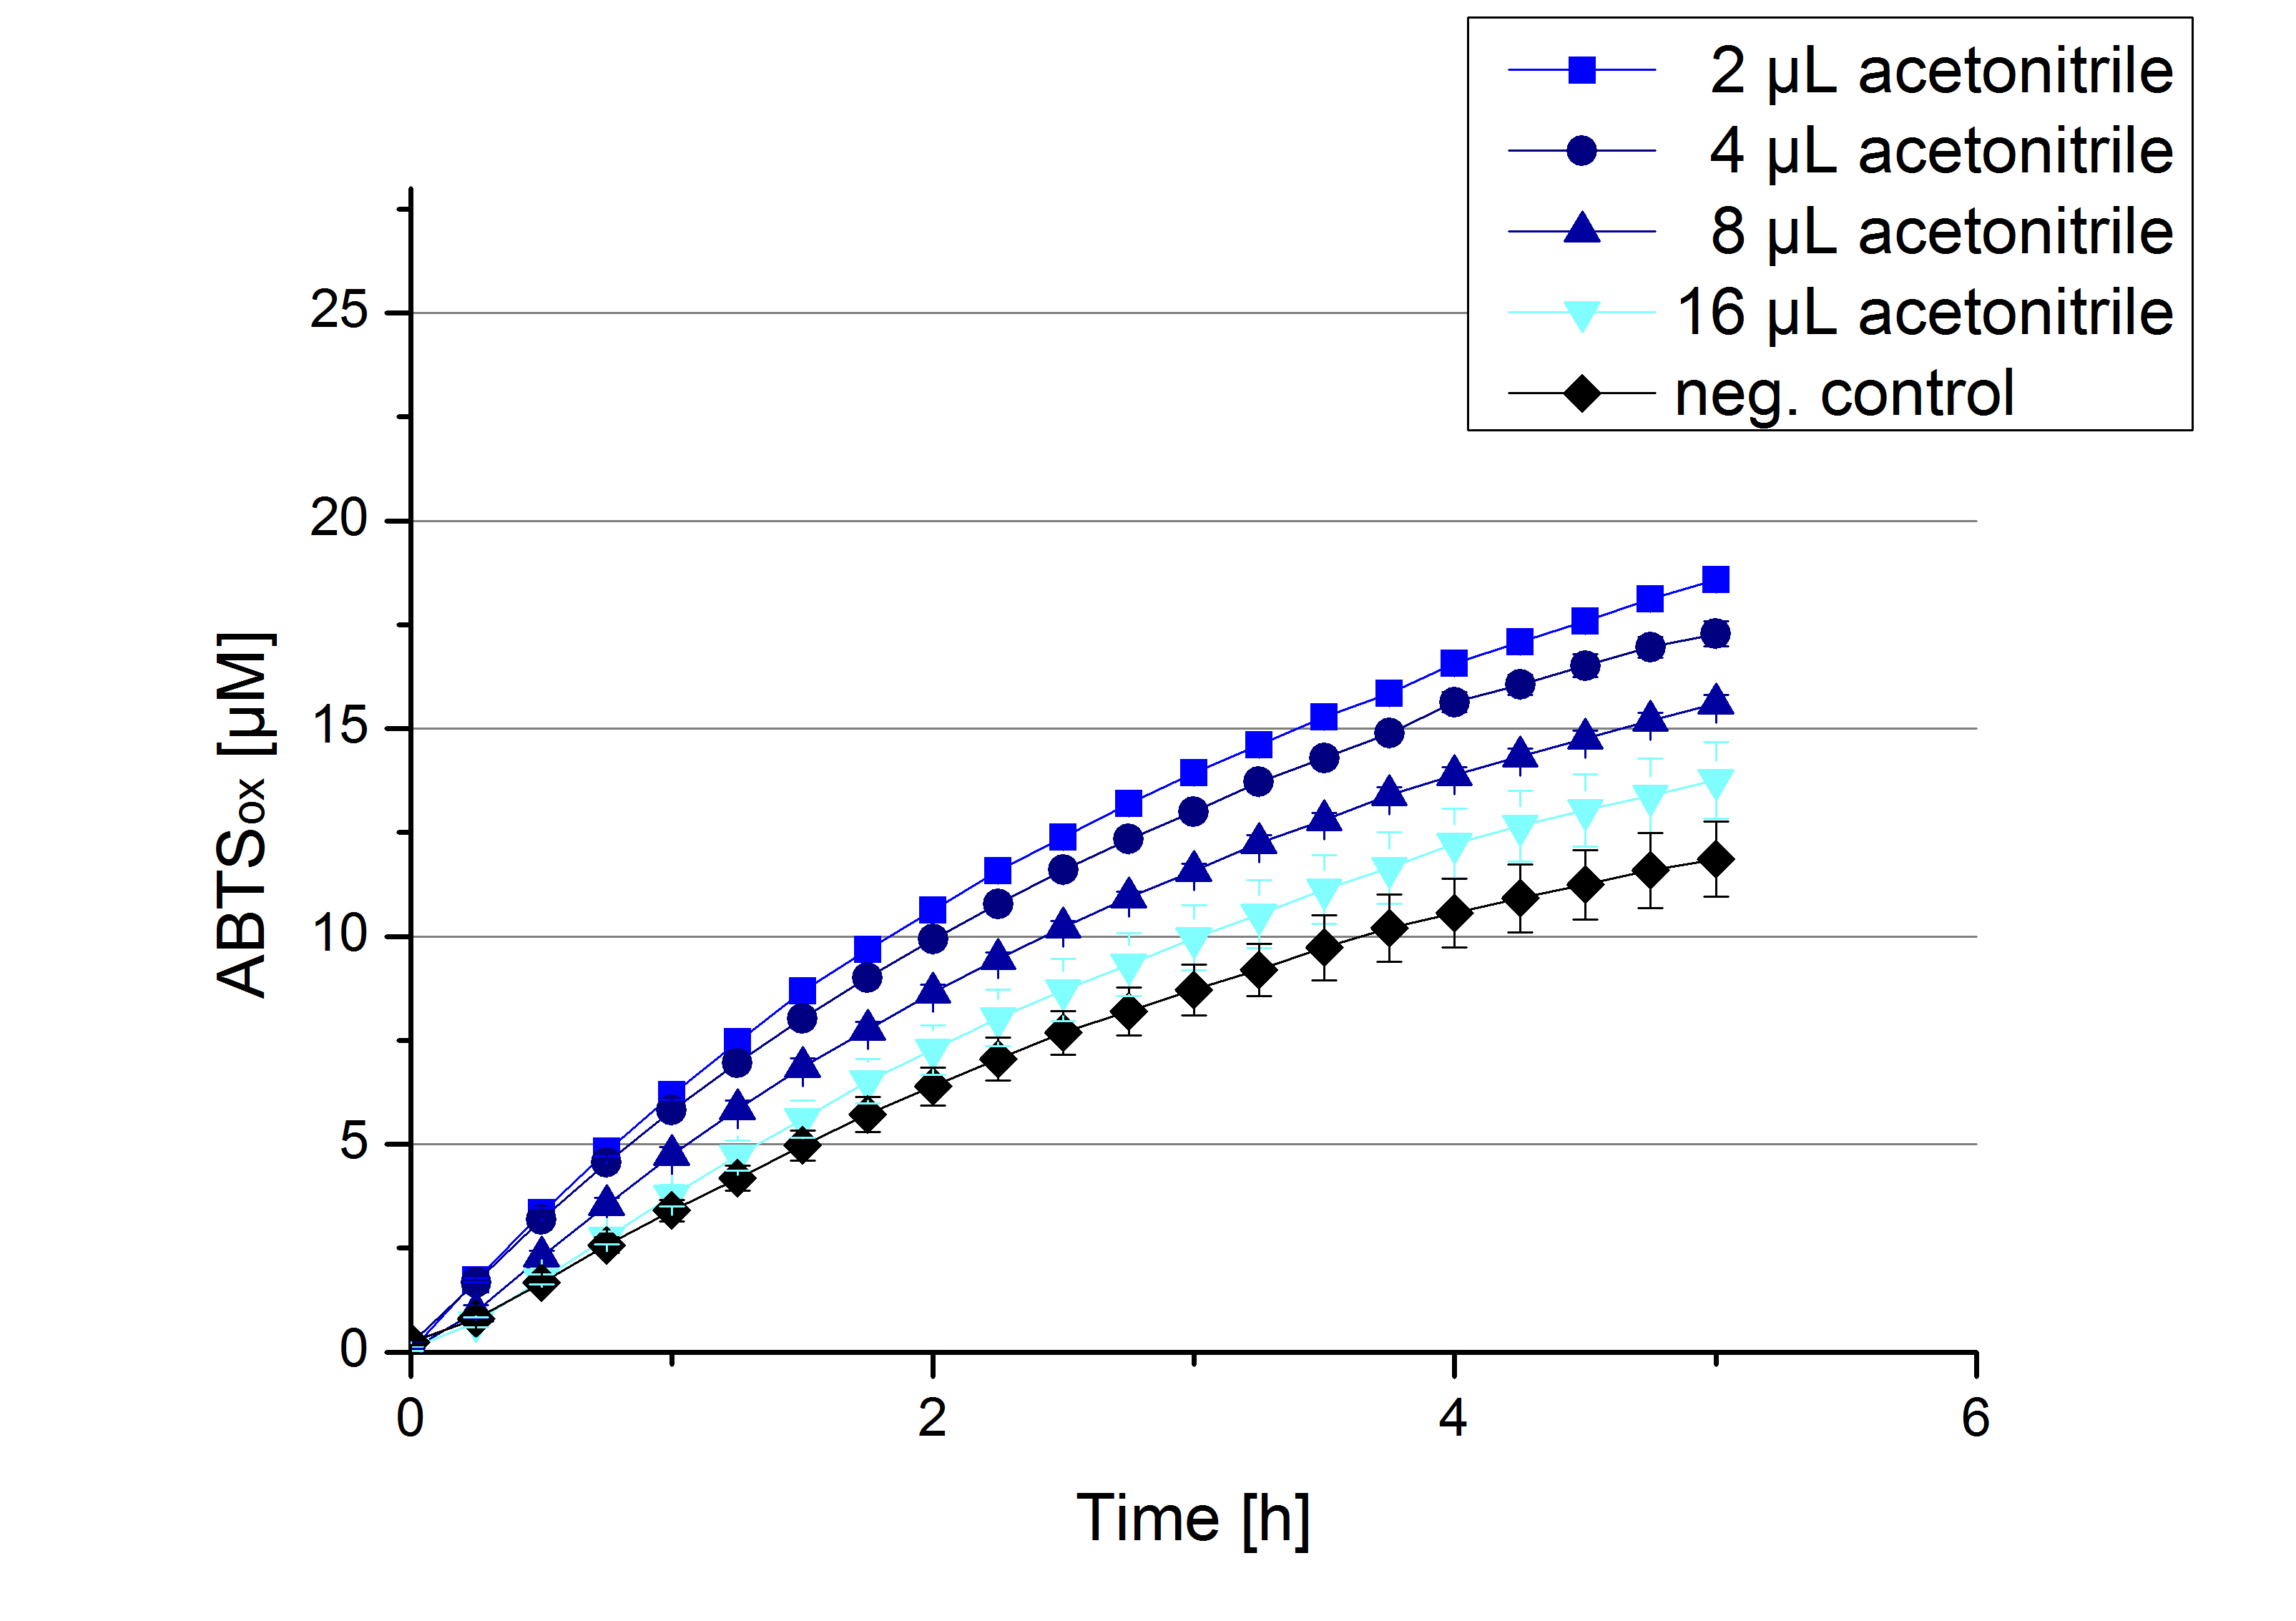
For substrate analytic tests the influence of MeOH and acetonitrile on [http://partsregistry.org/Part:BBa_K863005 ECOL] laccase had to be determined, because substrates have to be dissolved in these reagents. The experiment setup included 0.03 mg mL-1 [http://partsregistry.org/Part:BBa_K863005 ECOL] laccase, 100 mM sodium acetate buffer, different amounts of MeOH (Figure 17) or acteonitrile (Figure 18), 0.1 mM ABTS, to a final volume of 200 µL. The activity of [http://partsregistry.org/Part:BBa_K863005 ECOL] was found to be increased in presence of low concentrations (1 % v/v) of either MeOH or acetonitrile resulting in an higher amount of oxidized ABTS after 5 hours. Increasing concentrations of either substance decrease this positive effect, resulting in a significantly decreased laccase activity in presence of 8 % (v/v) MeOH. These results indicate that for further measurements in substrate analytics it is recommended not to use high concentrations of MeOH or acetonitrile to ensure the functionality of [http://partsregistry.org/Part:BBa_K863005 ECOL].
/sub> or higher concentrations leads to an increase in ABTS
Since Regionals: Initial activity tests of purified fractions
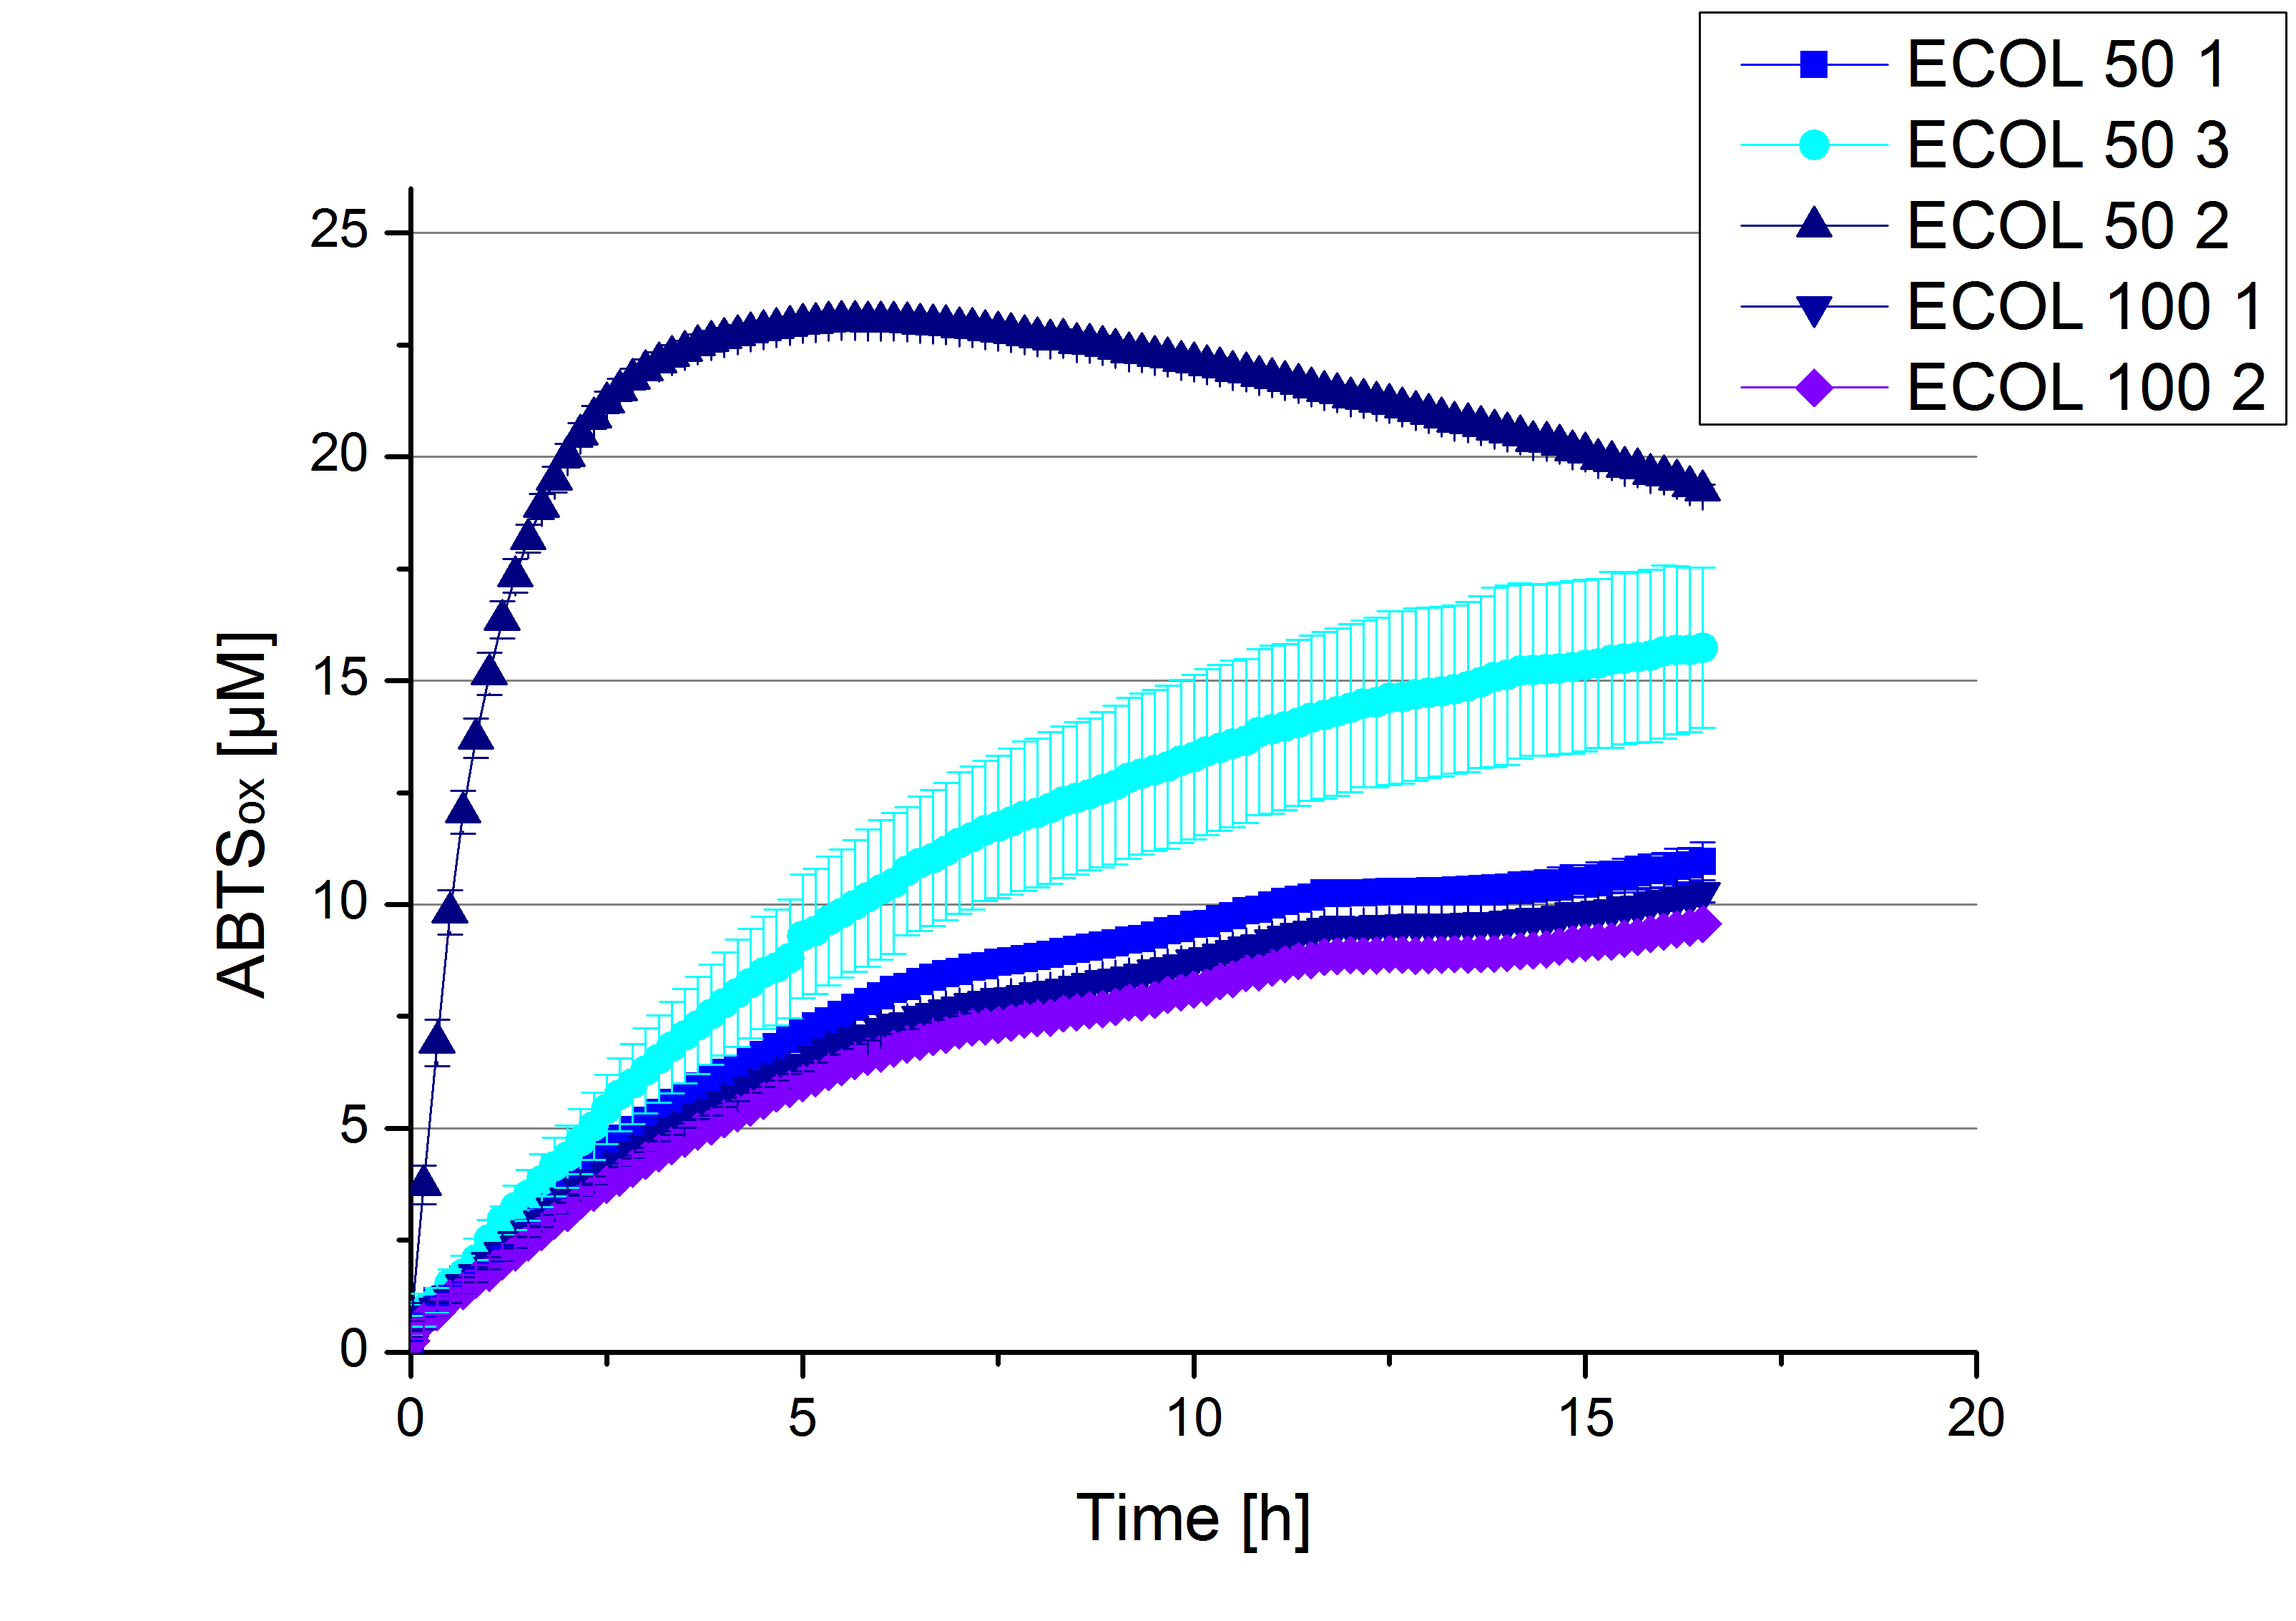
Another cultivation of ECOL has been done after the Regional Jamborees in Amsterdam. The fractions of the purifictaion were analyzed further on protein content and re-buffered subsequently into deionized H2. To determine the protein content afterwards because of loss of proteins through re-buffering, another protein concentration measurement has been done. The re-buffered fractions have been incubated with 0.4 mM CuCl2 to gain higher activity of the laccases, because they are copper-dependent. Standard activity tests were done with all ECOL fractions with adjusted protein content for comparison. The experimental setup included the ECOL fractions, Britton-Robinson buffer (pH 5) and 0.1 mM ABTS. Measurements were done at 25 °C. Resulting, one fraction showed very high activity in comparison to the other fractions (Fig. x). This fraction, fraction 50% 2, oxidized up to 23 µM ABTS after 5 hours. This fraction was set as containing 90 % ECOL laccase of its protein content. Therefore a ECOL concentration of 63,9 µg mL-1 was gained. This fraction was analyzed further on pH optimum, temperature dependency and ABTS saturation.
Since Regionals: [http://partsregistry.org/Part:BBa_K863005 ECOL] pH optimum
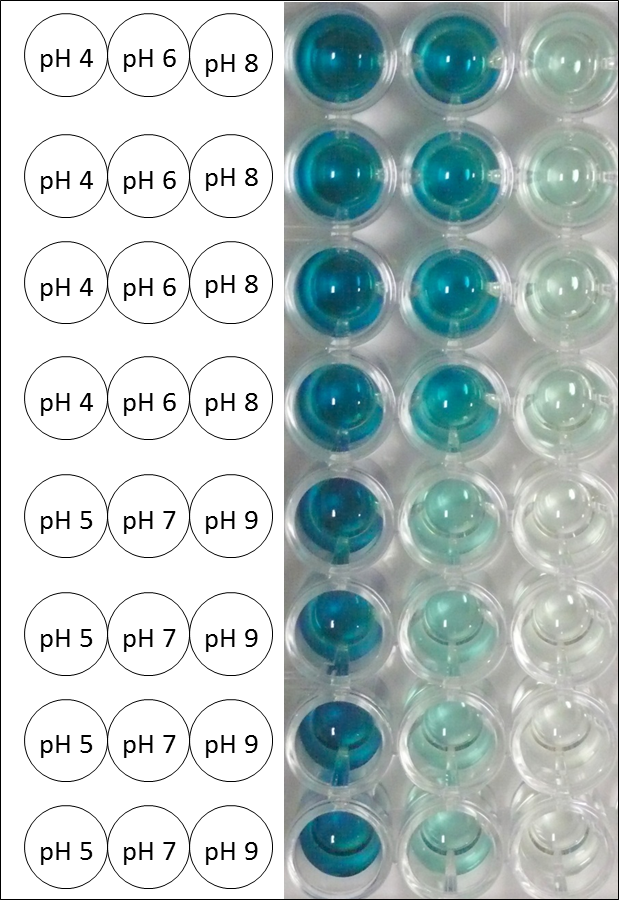
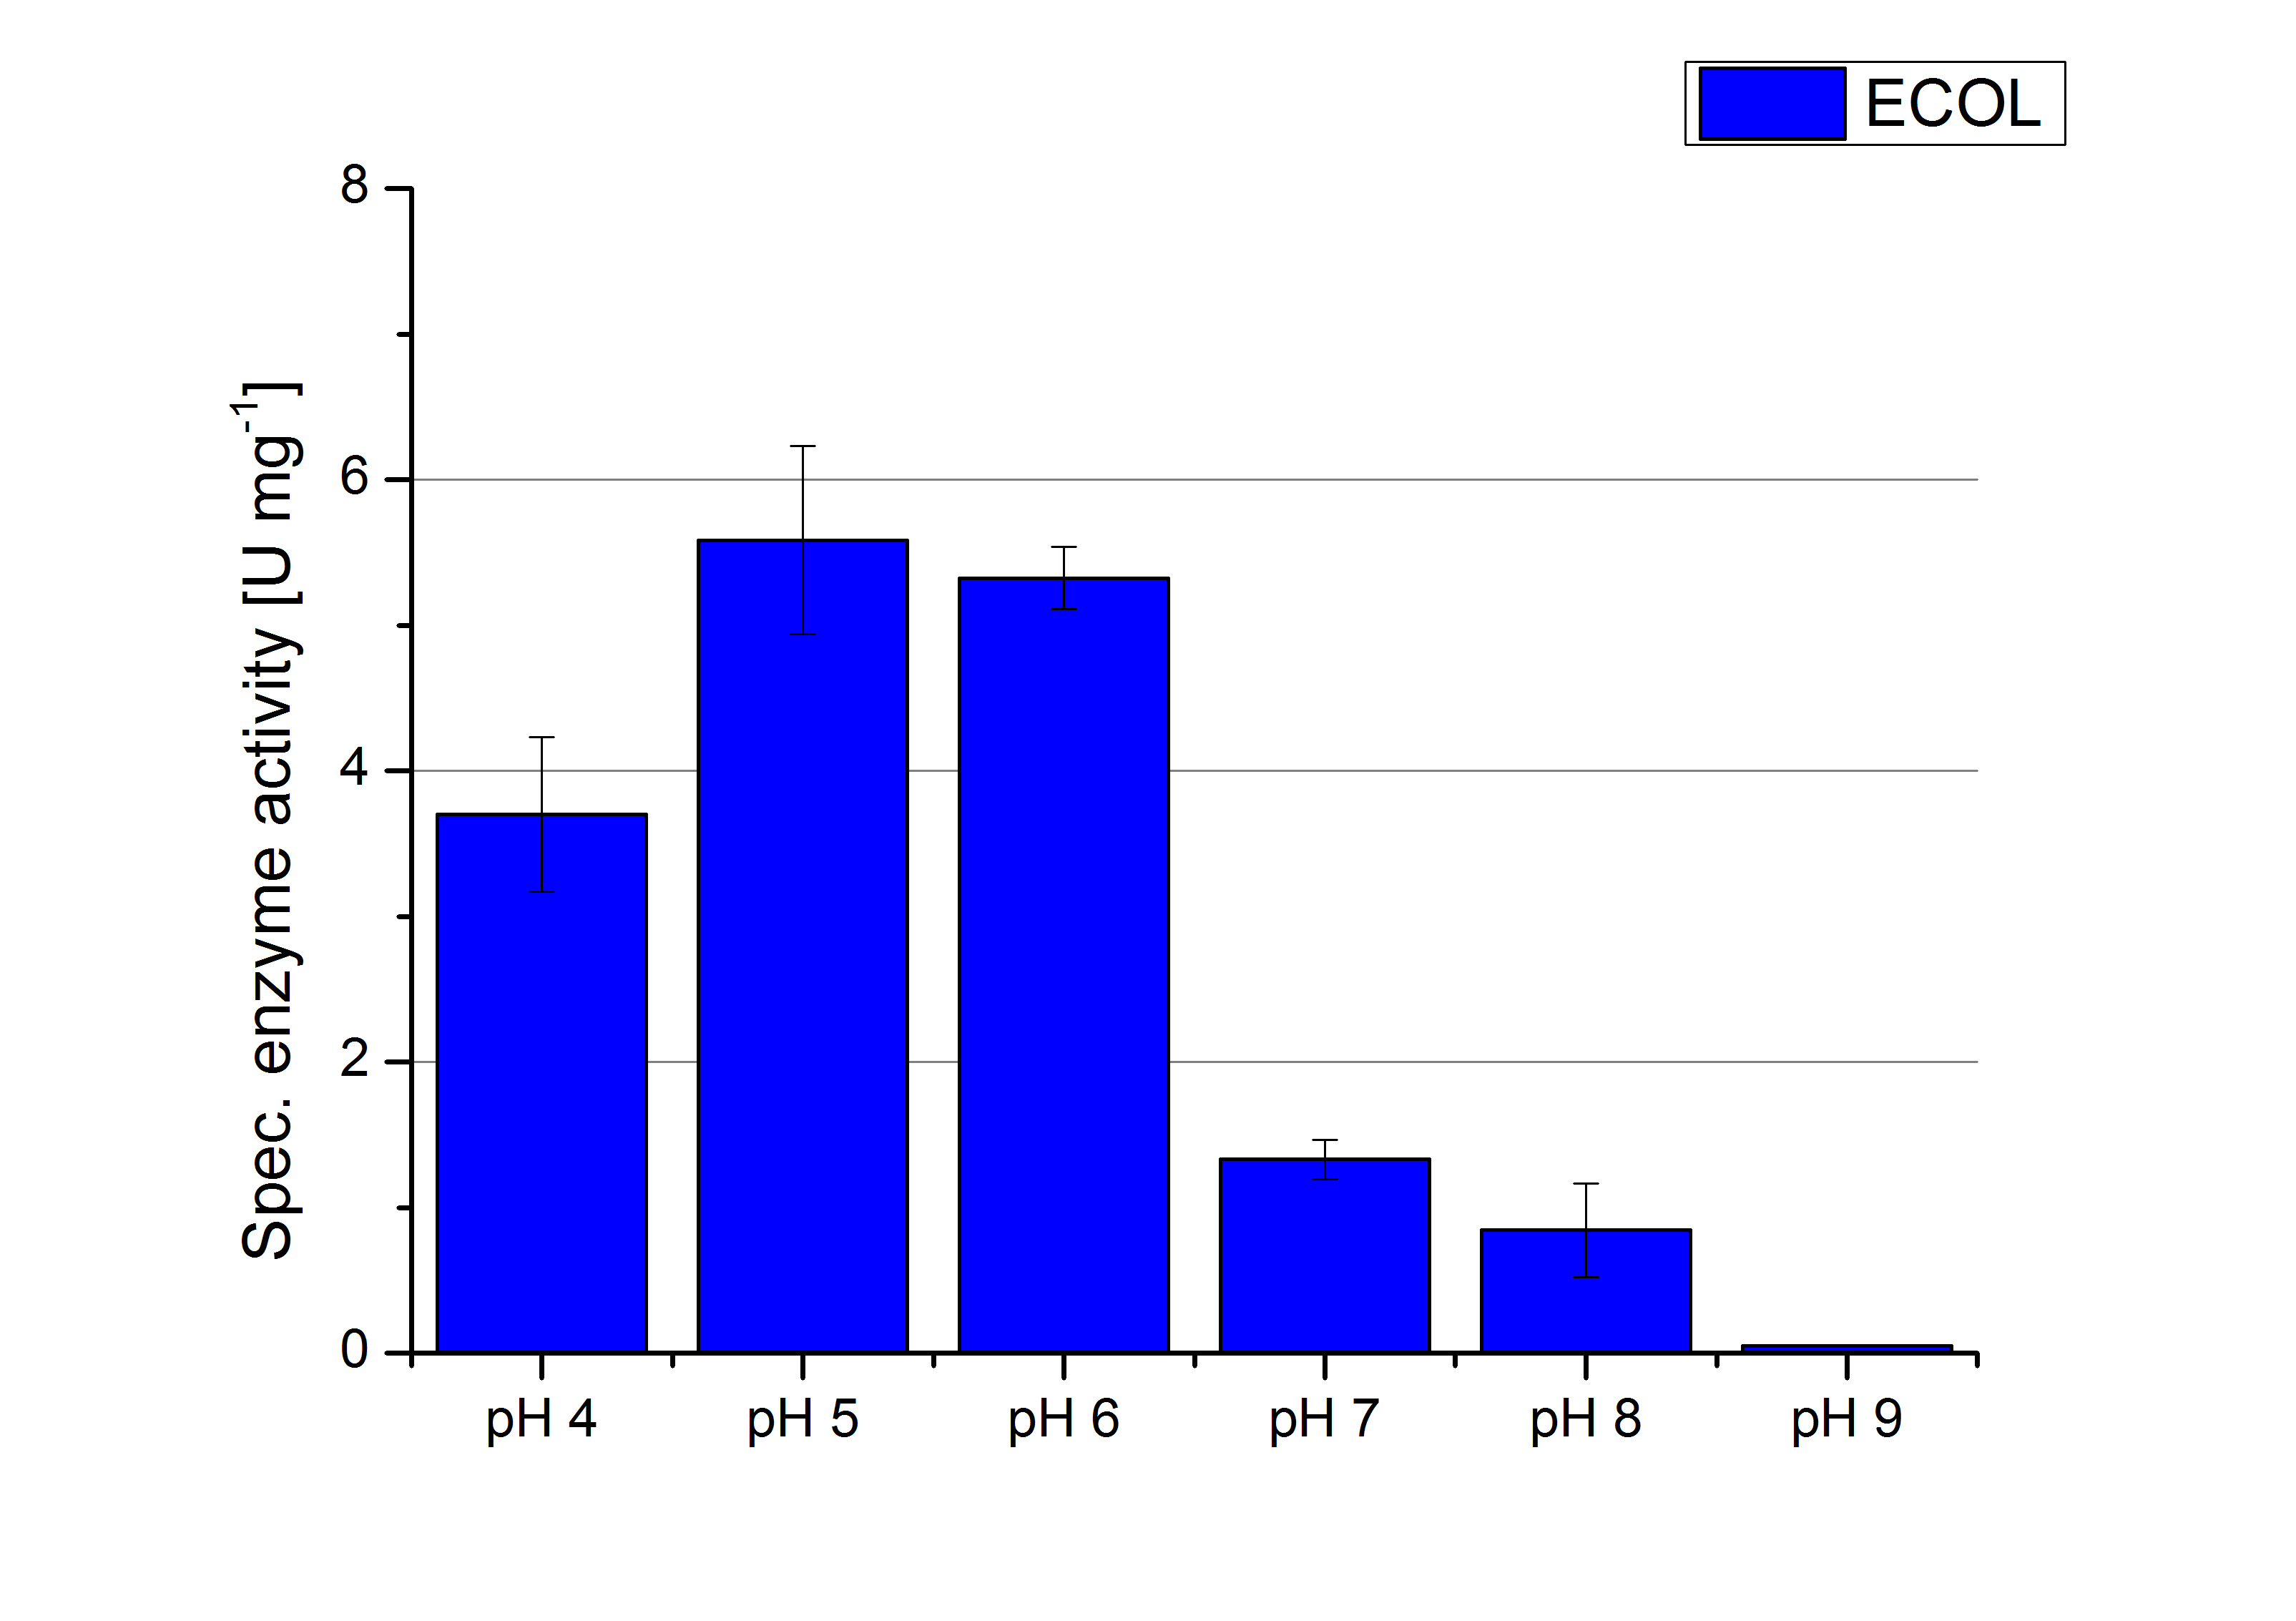
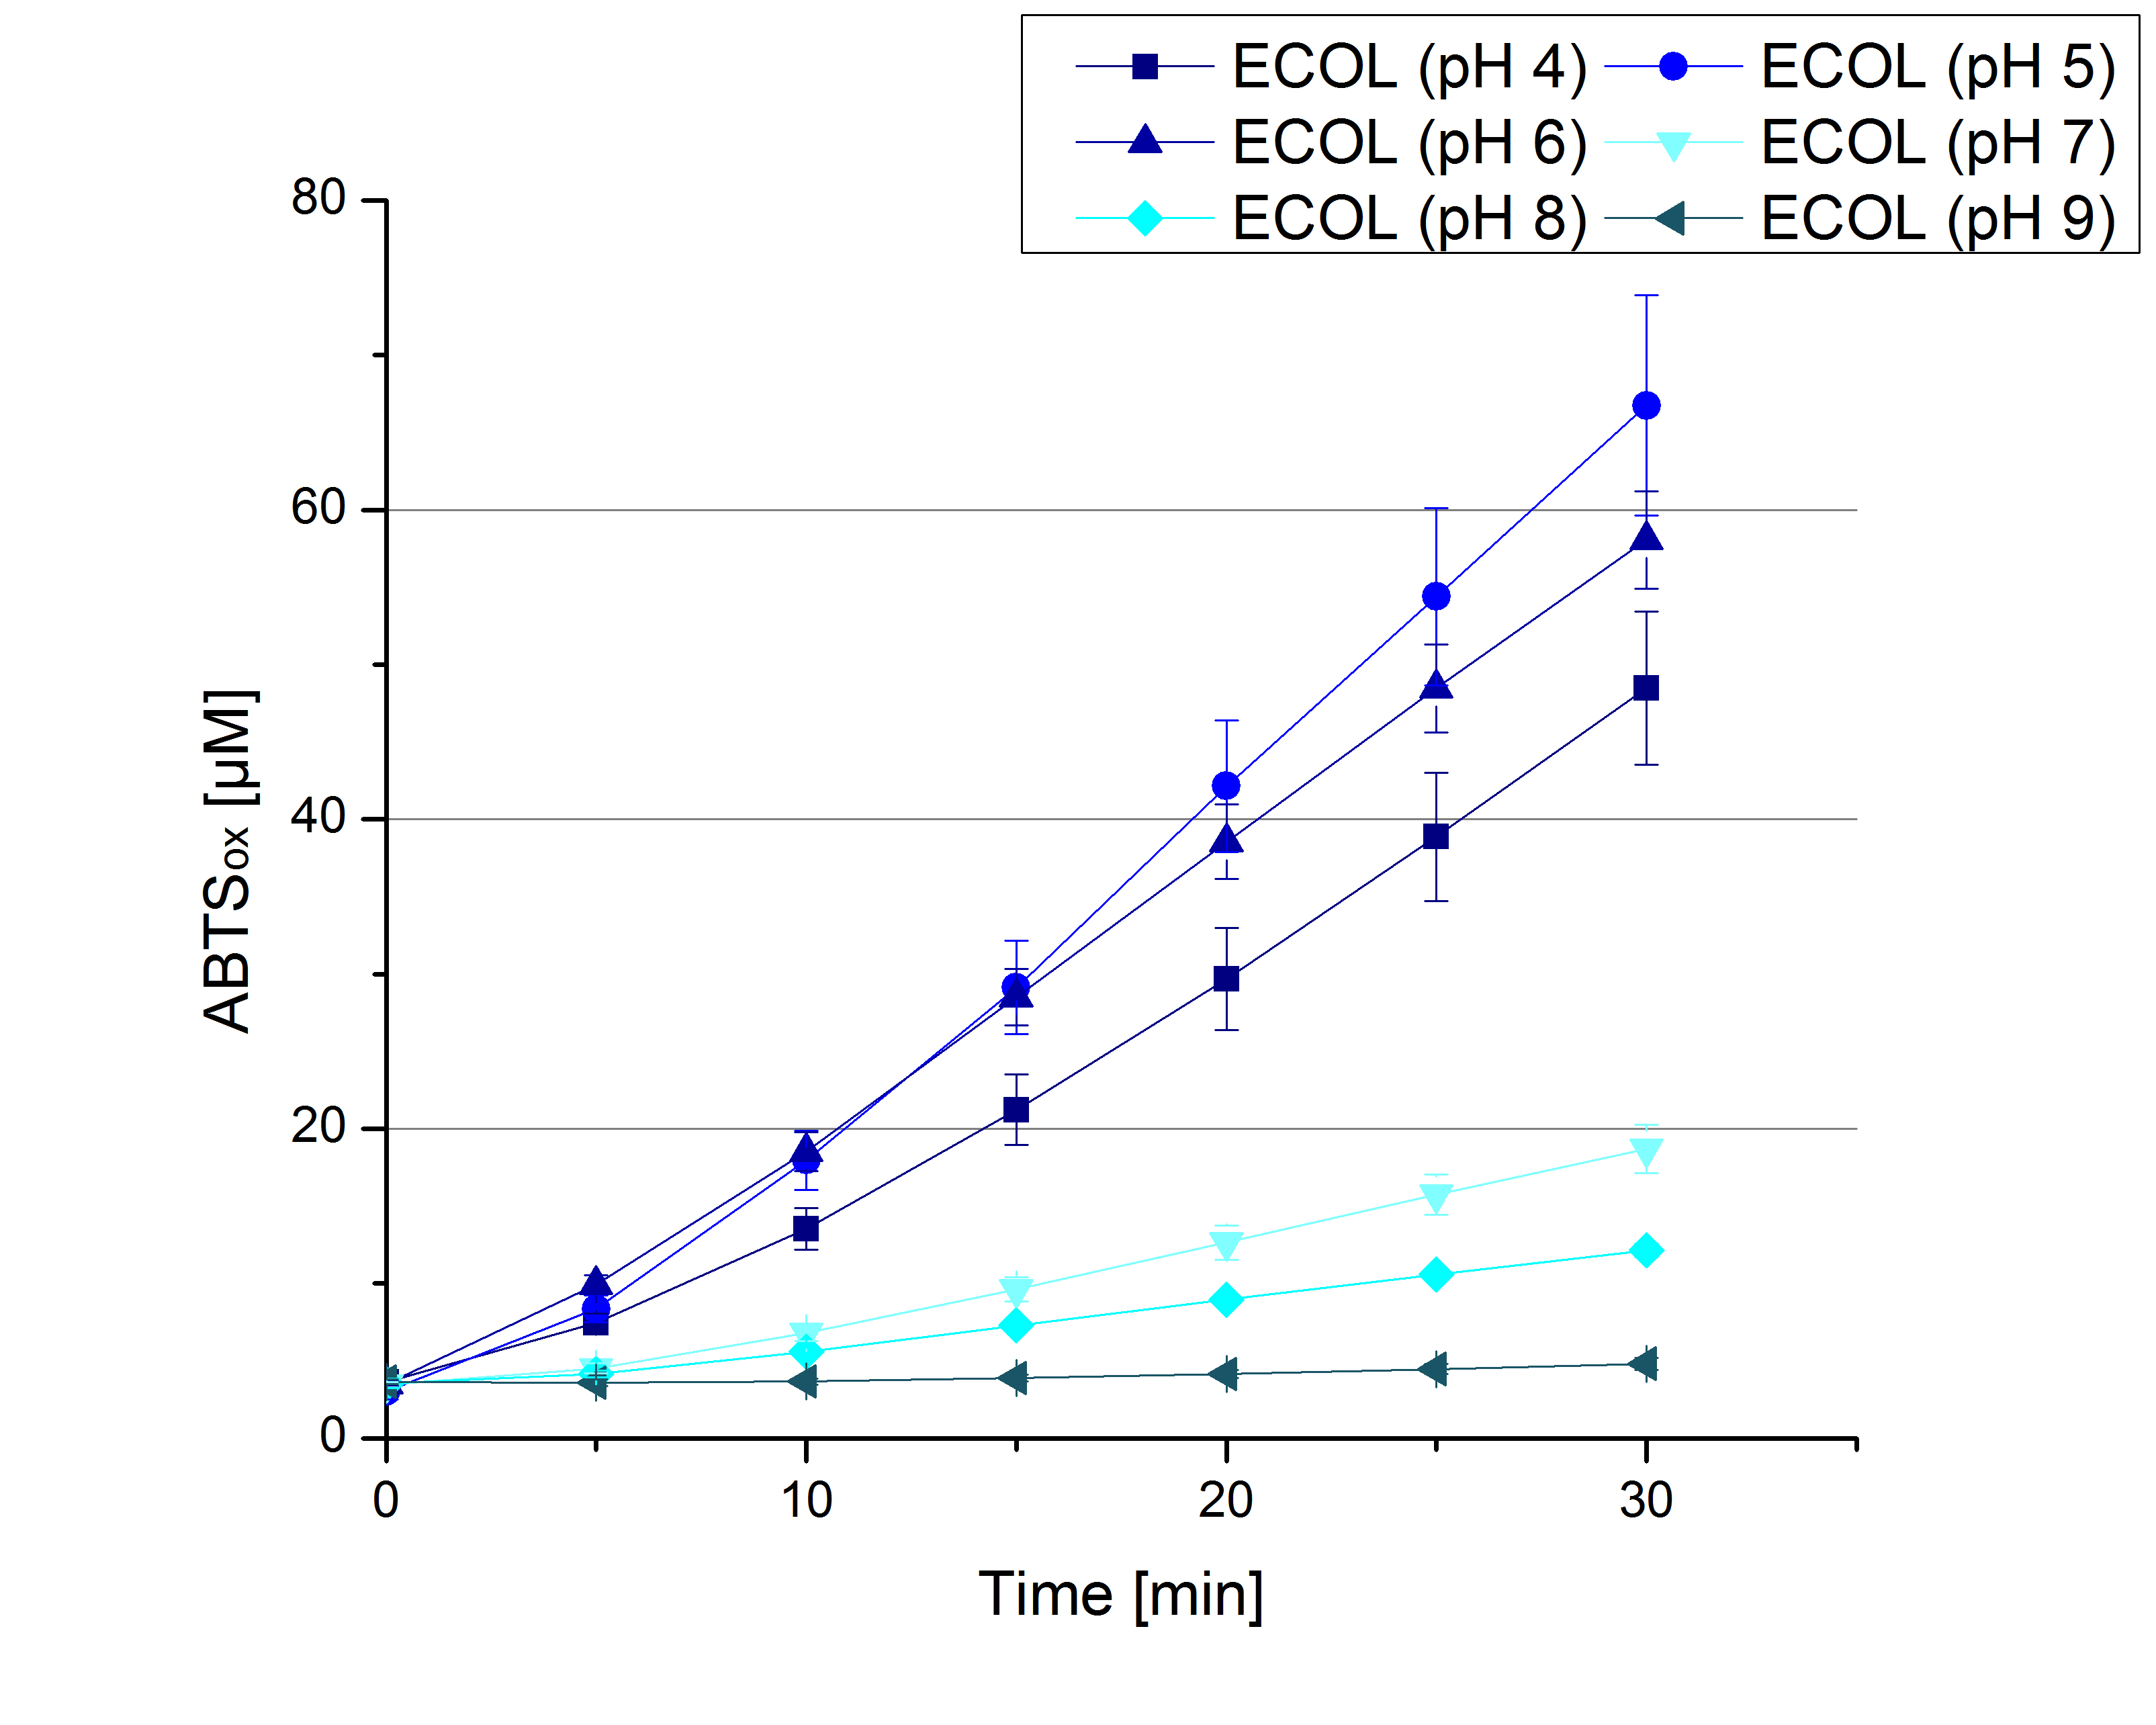
Activity assay measurements for ECOL laccases were done to find the optimal pH for further analysis. Britton-Robinson buffer, adjusted to pHs ranging from pH 4 to pH 9, was used with 9 mM ABTS to detect the change in OD at 420 nm. The measurements were done with 308 ng ECOL laccase for each sample. The highest activity was reached when measured in Britton-Robinson buffer at pH 4 and pH 5 (Fig. x, Fig. y, Fig. z). More than 10 U mg-1 of specific enzyme activity have calculated for these pHs (Fig. x). When testing the activity under basic conditions, the enzyme activity decreases. At pH 7 less than 1 U mg-1 was determined. This makes an application of the ECOL not feasible.
Since Regionals: [http://partsregistry.org/Part:BBa_K863005 ECOL] activity at different temperatures
To investigate the activity of ECOL at temperatures that will apply at a waste water treatment plant throughout the year, activity tests as described above were performed at 10°C and 25°C. The measurements were conducted for 30 minutes. The obtained results reveal a lower activity of ECOL at 10°C in comparison to 25°C (see Fig. X). The received values were used to calculate the specific enzyme activity which was between 1 and 12 U mg-1 , respectively (see Figure X). The negative control without ECOL but 0.4 mM CuCl2 at 10°C and 25°C show a negligible oxidation of ABTS. The activity of ECOL is decreased to about 90% at 10°C. An application of ECOL at warm temperatures is therefore possible but during the cold seasons a more cryo stable enzyme would be preferable.
Since Regionals: [http://partsregistry.org/Part:BBa_K863005 ECOL] activity depending on different ABTS concentrations
To calculate the activity in Units mg-1, measurements have to be done under substrate saturation. With this the comparison of Units mg-1 with other laccase activities and the literature is possible. To find the optimal substrate saturation ABTS concentrations ranging from 0.1 mM to 8 mM were applied in an experimental setup containing Britton-Robinson buffer (pH) and temperature conditions of 25 °C. For measurements with 0.1 mM to 5 mM ABTS, 616 ng BHAL laccase were used (Fig. x). For measurements with 5 mM to 8 mM ABTS only 308 ng BHAL laccase were applied (Fig. y). The amount of oxidized ABTS increased according to the increase of ABTS concentration. To make sure that the substrate saturation is given, 9 mM ABTS have been used in further tests.
Substrate Analysis
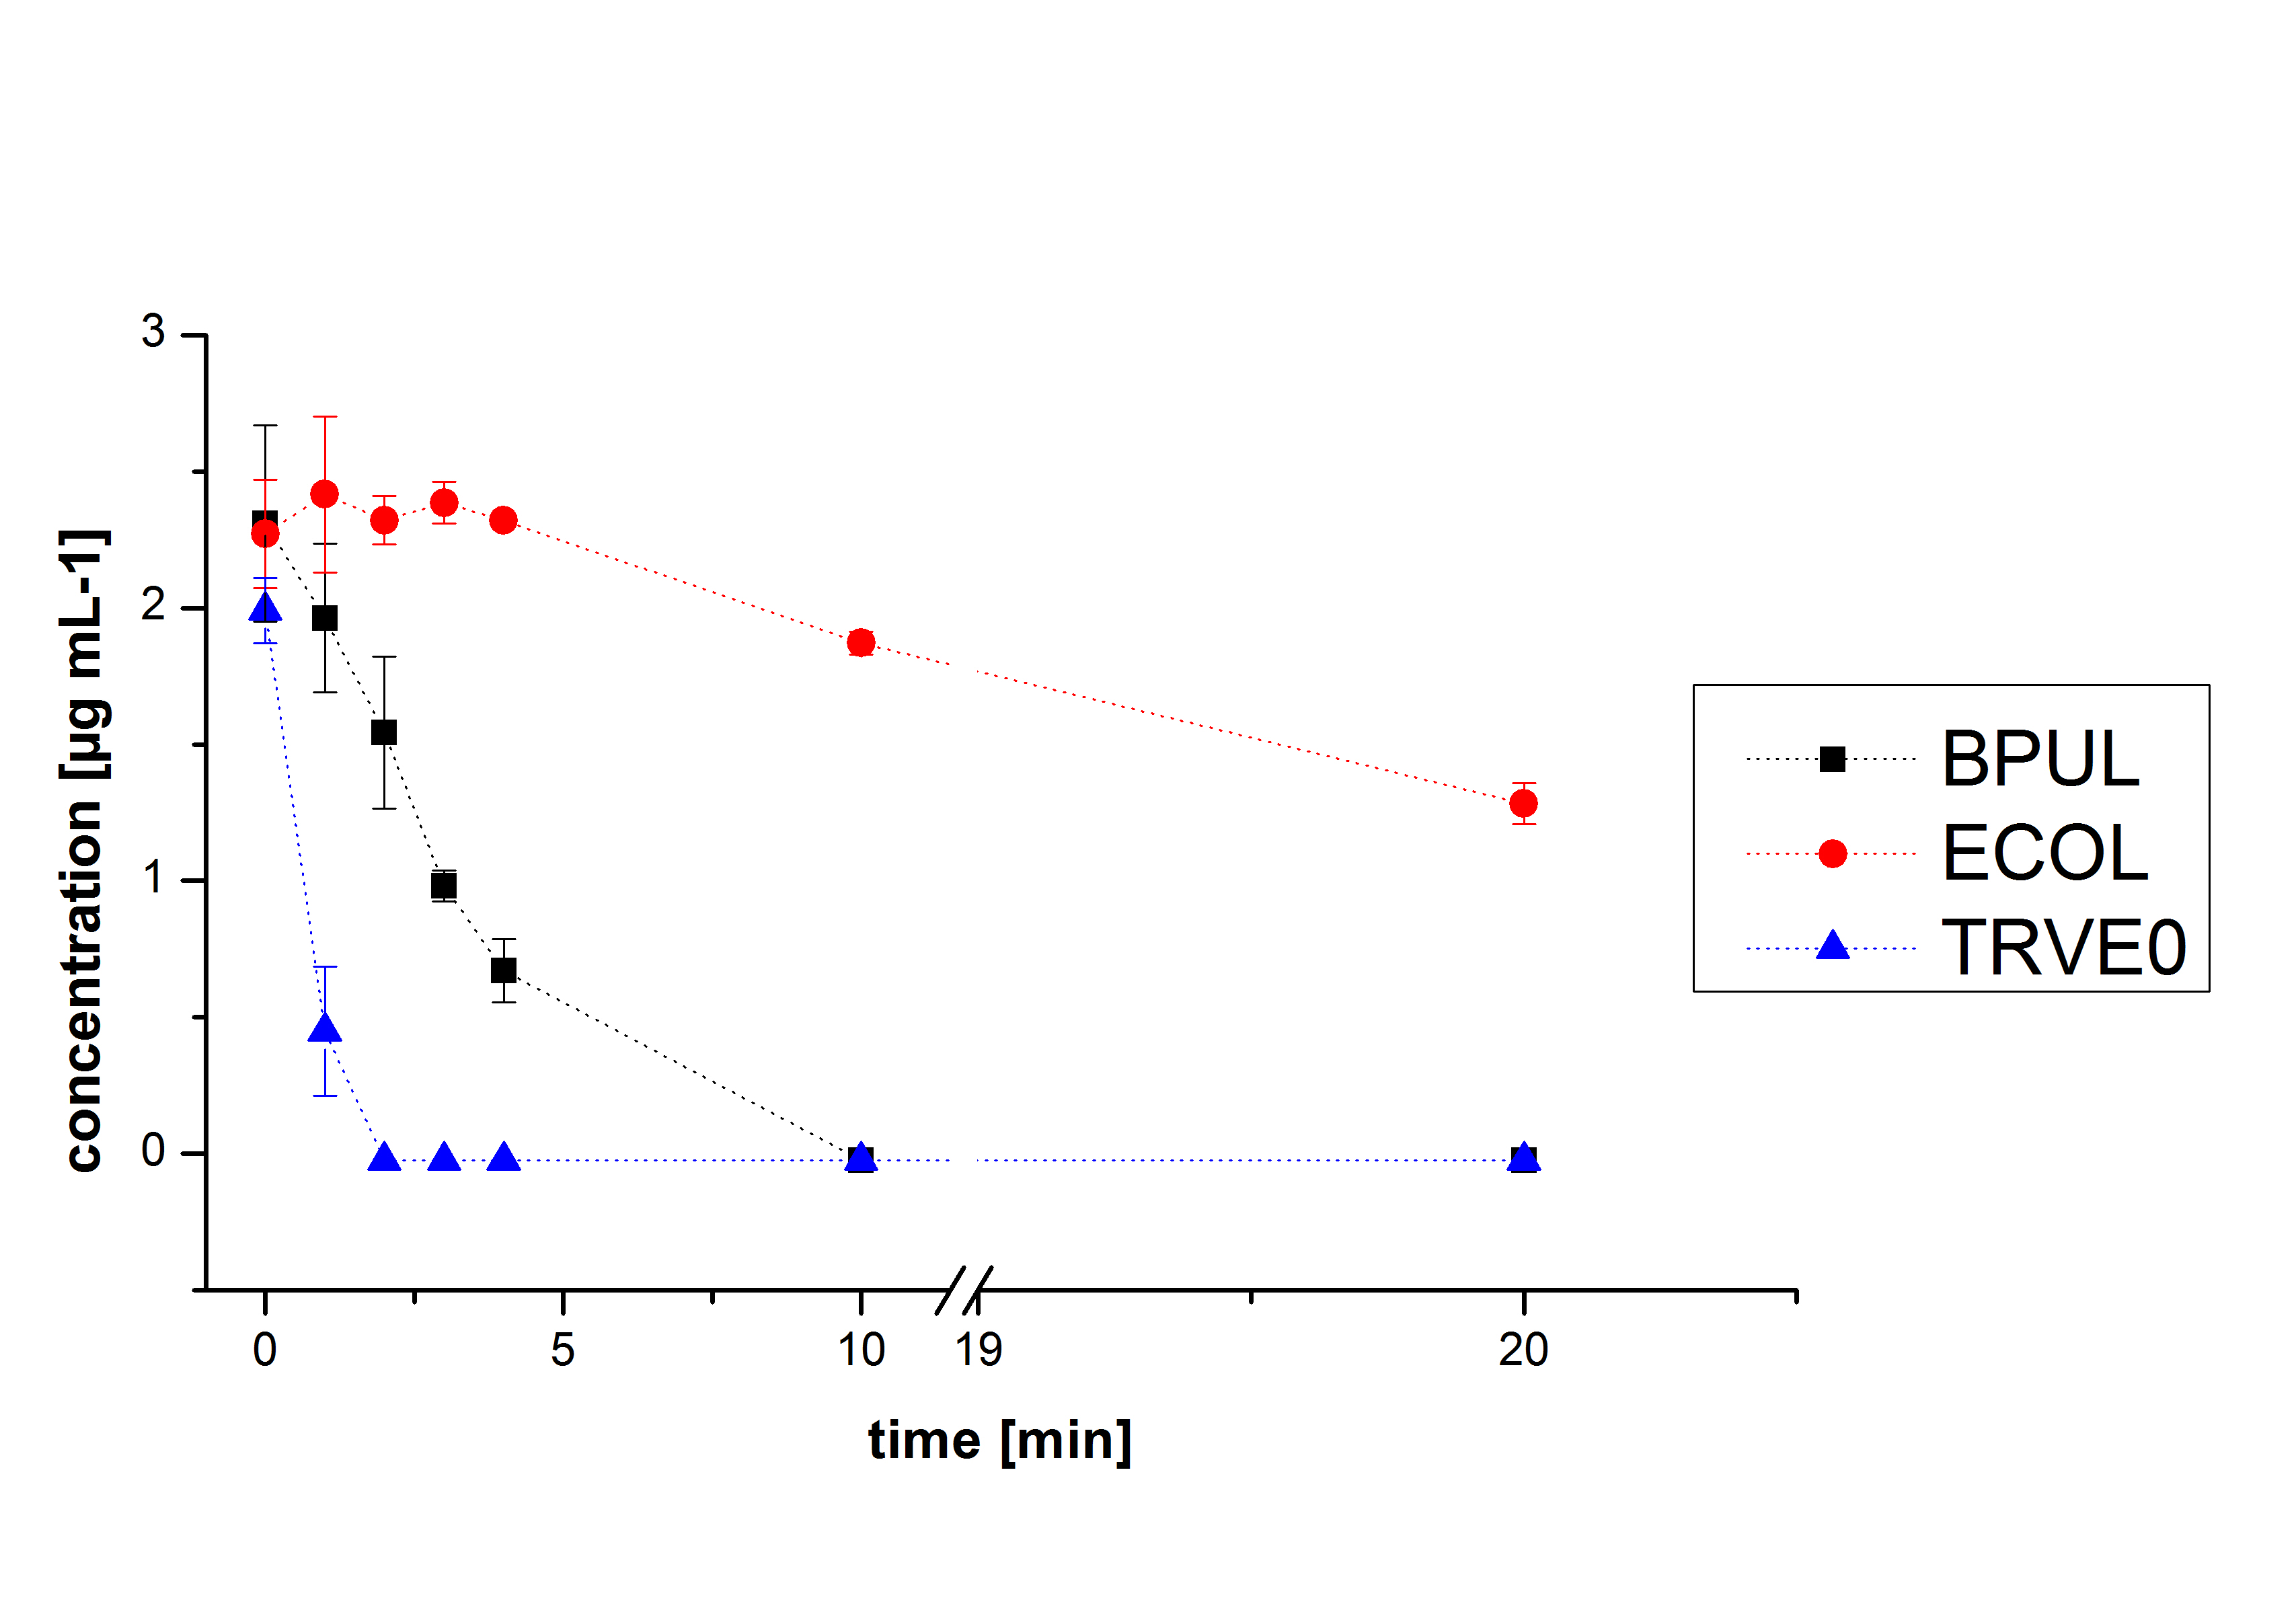
In Figure 19 the degradation reactions of ethinyl estradiole with ABTS of BPUL and ECOL are shown. The data was measured by HPLC. Since it was already determined that both are able to oxidize ABTS by the activity test, the results were as expected. ABTS works as mediator, which explains the ability to degrade ethinyl estradiol and probably other substrates. In comparison, ECOL has a lower potential for degradation of ethinyl with ABTS than TVEL0 and BPUL. Until now, no further experiments were made.
Immobilization
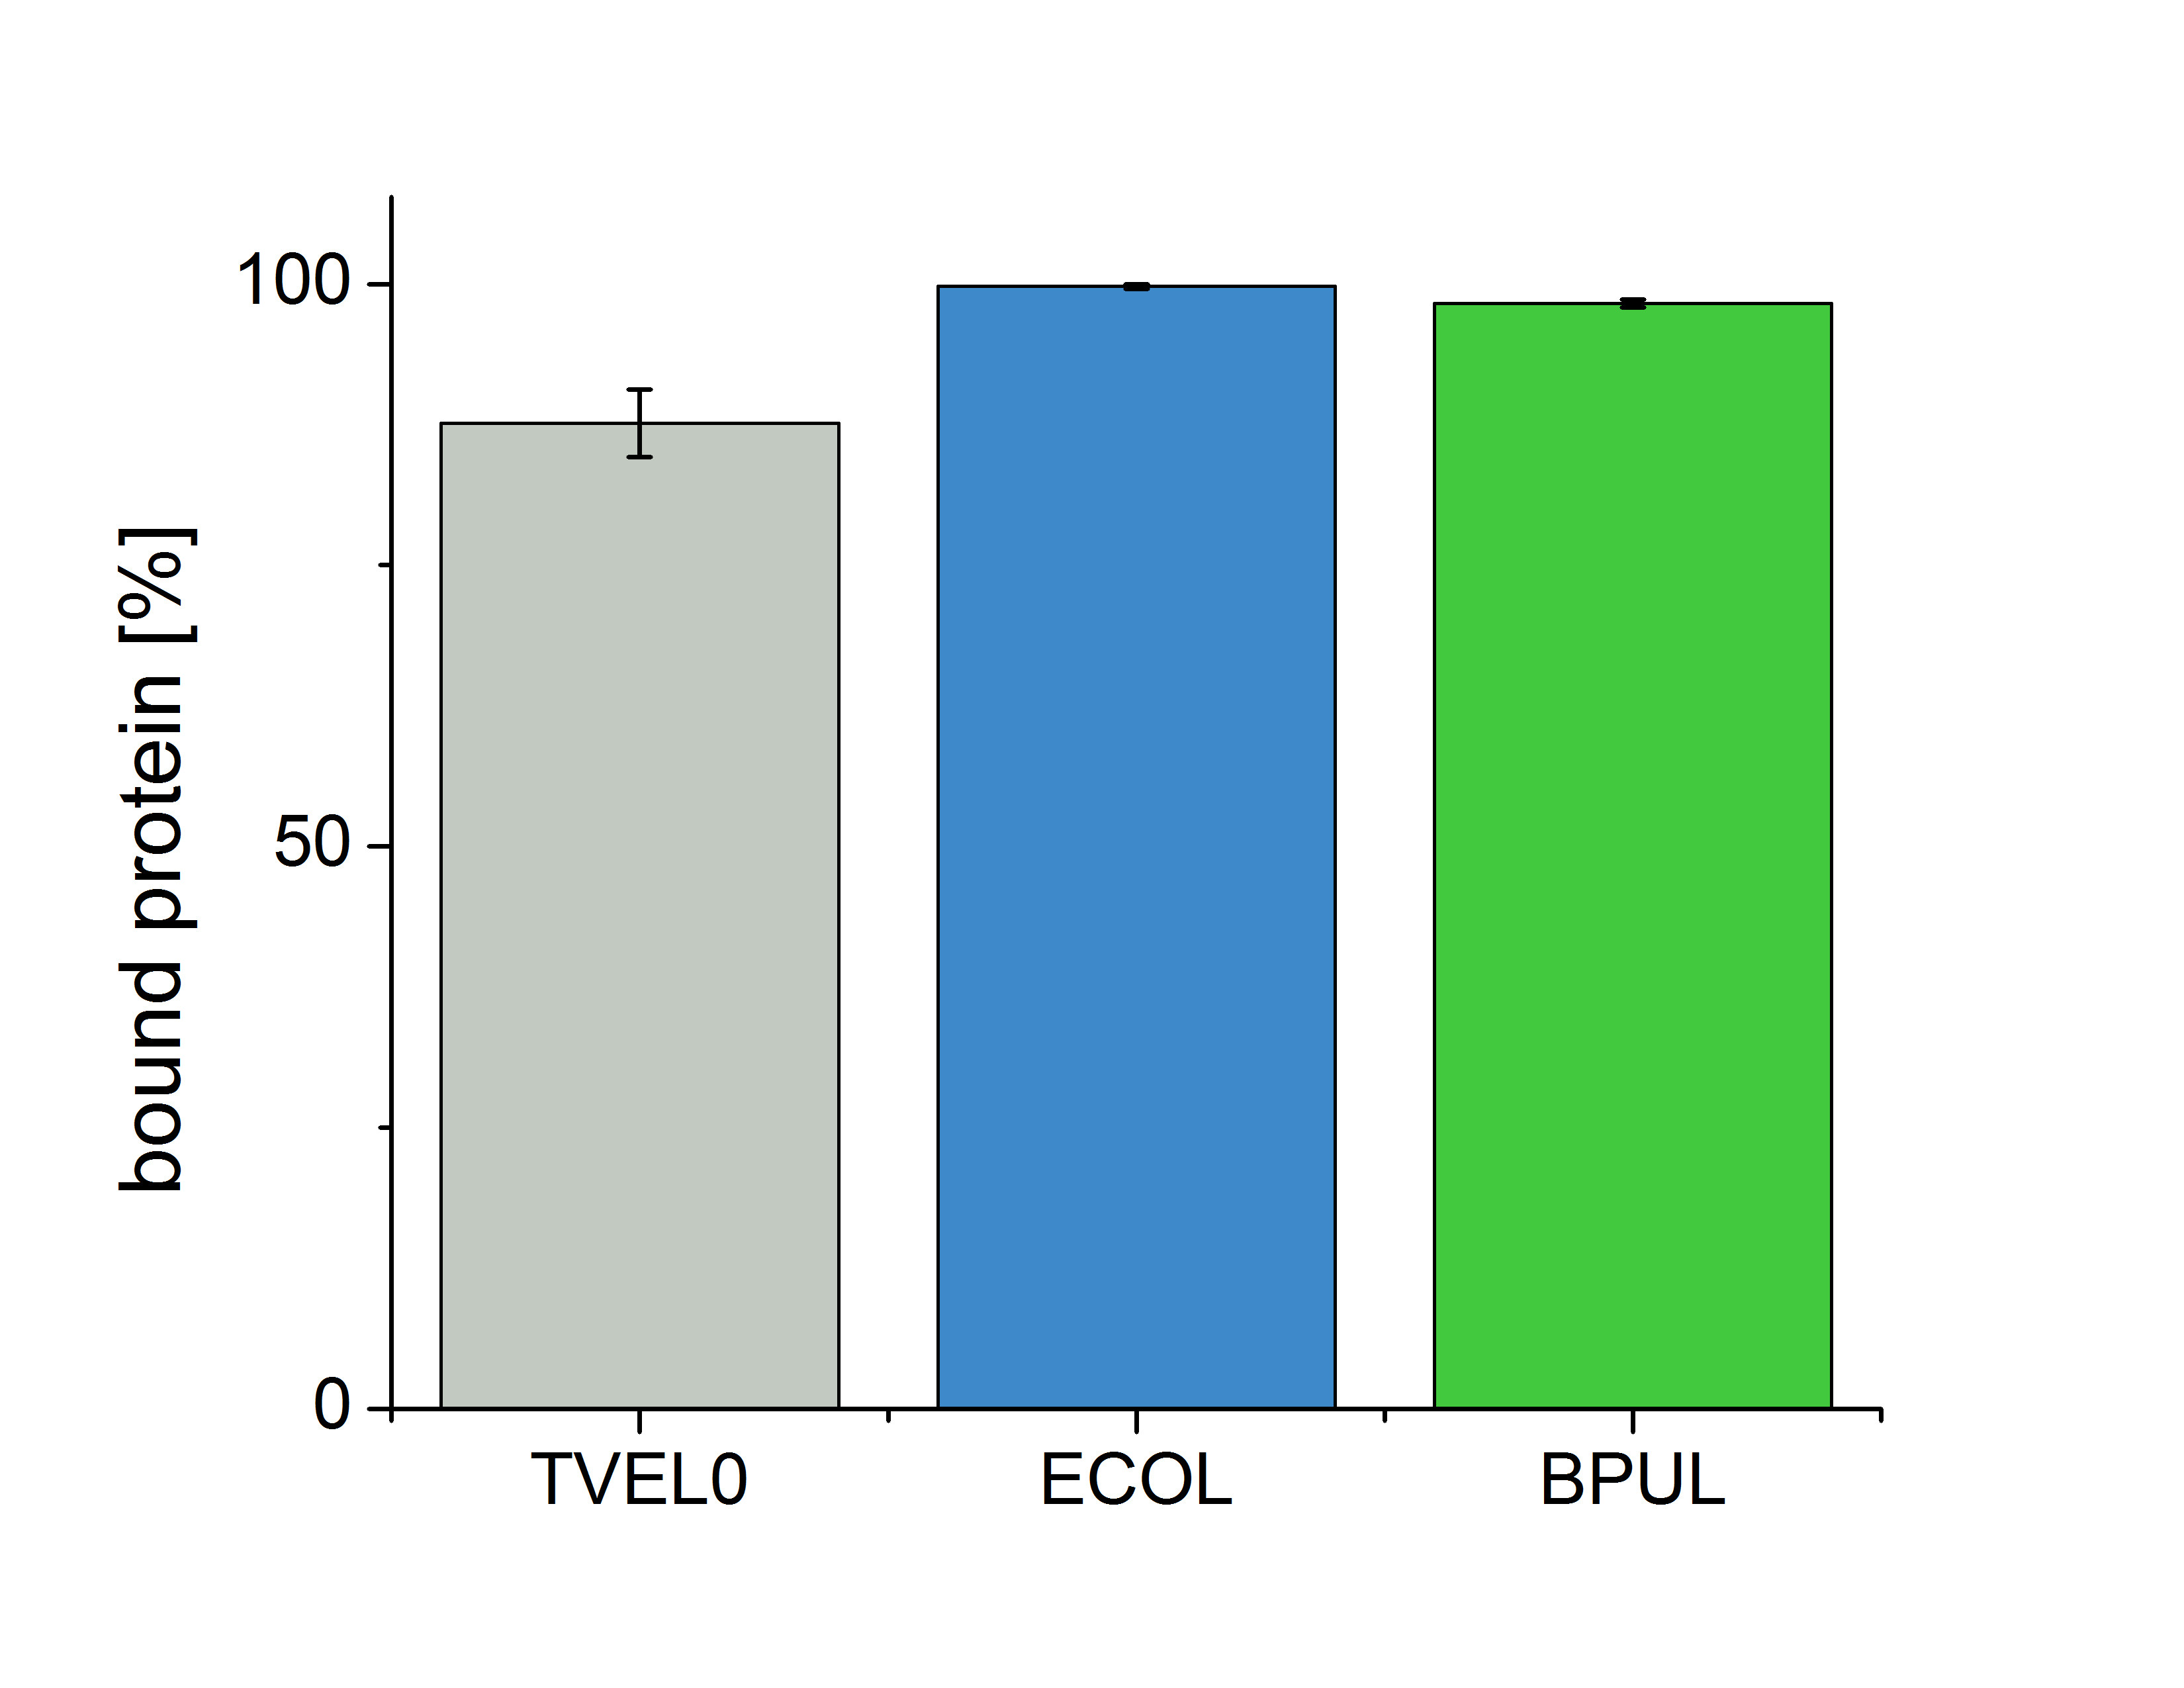
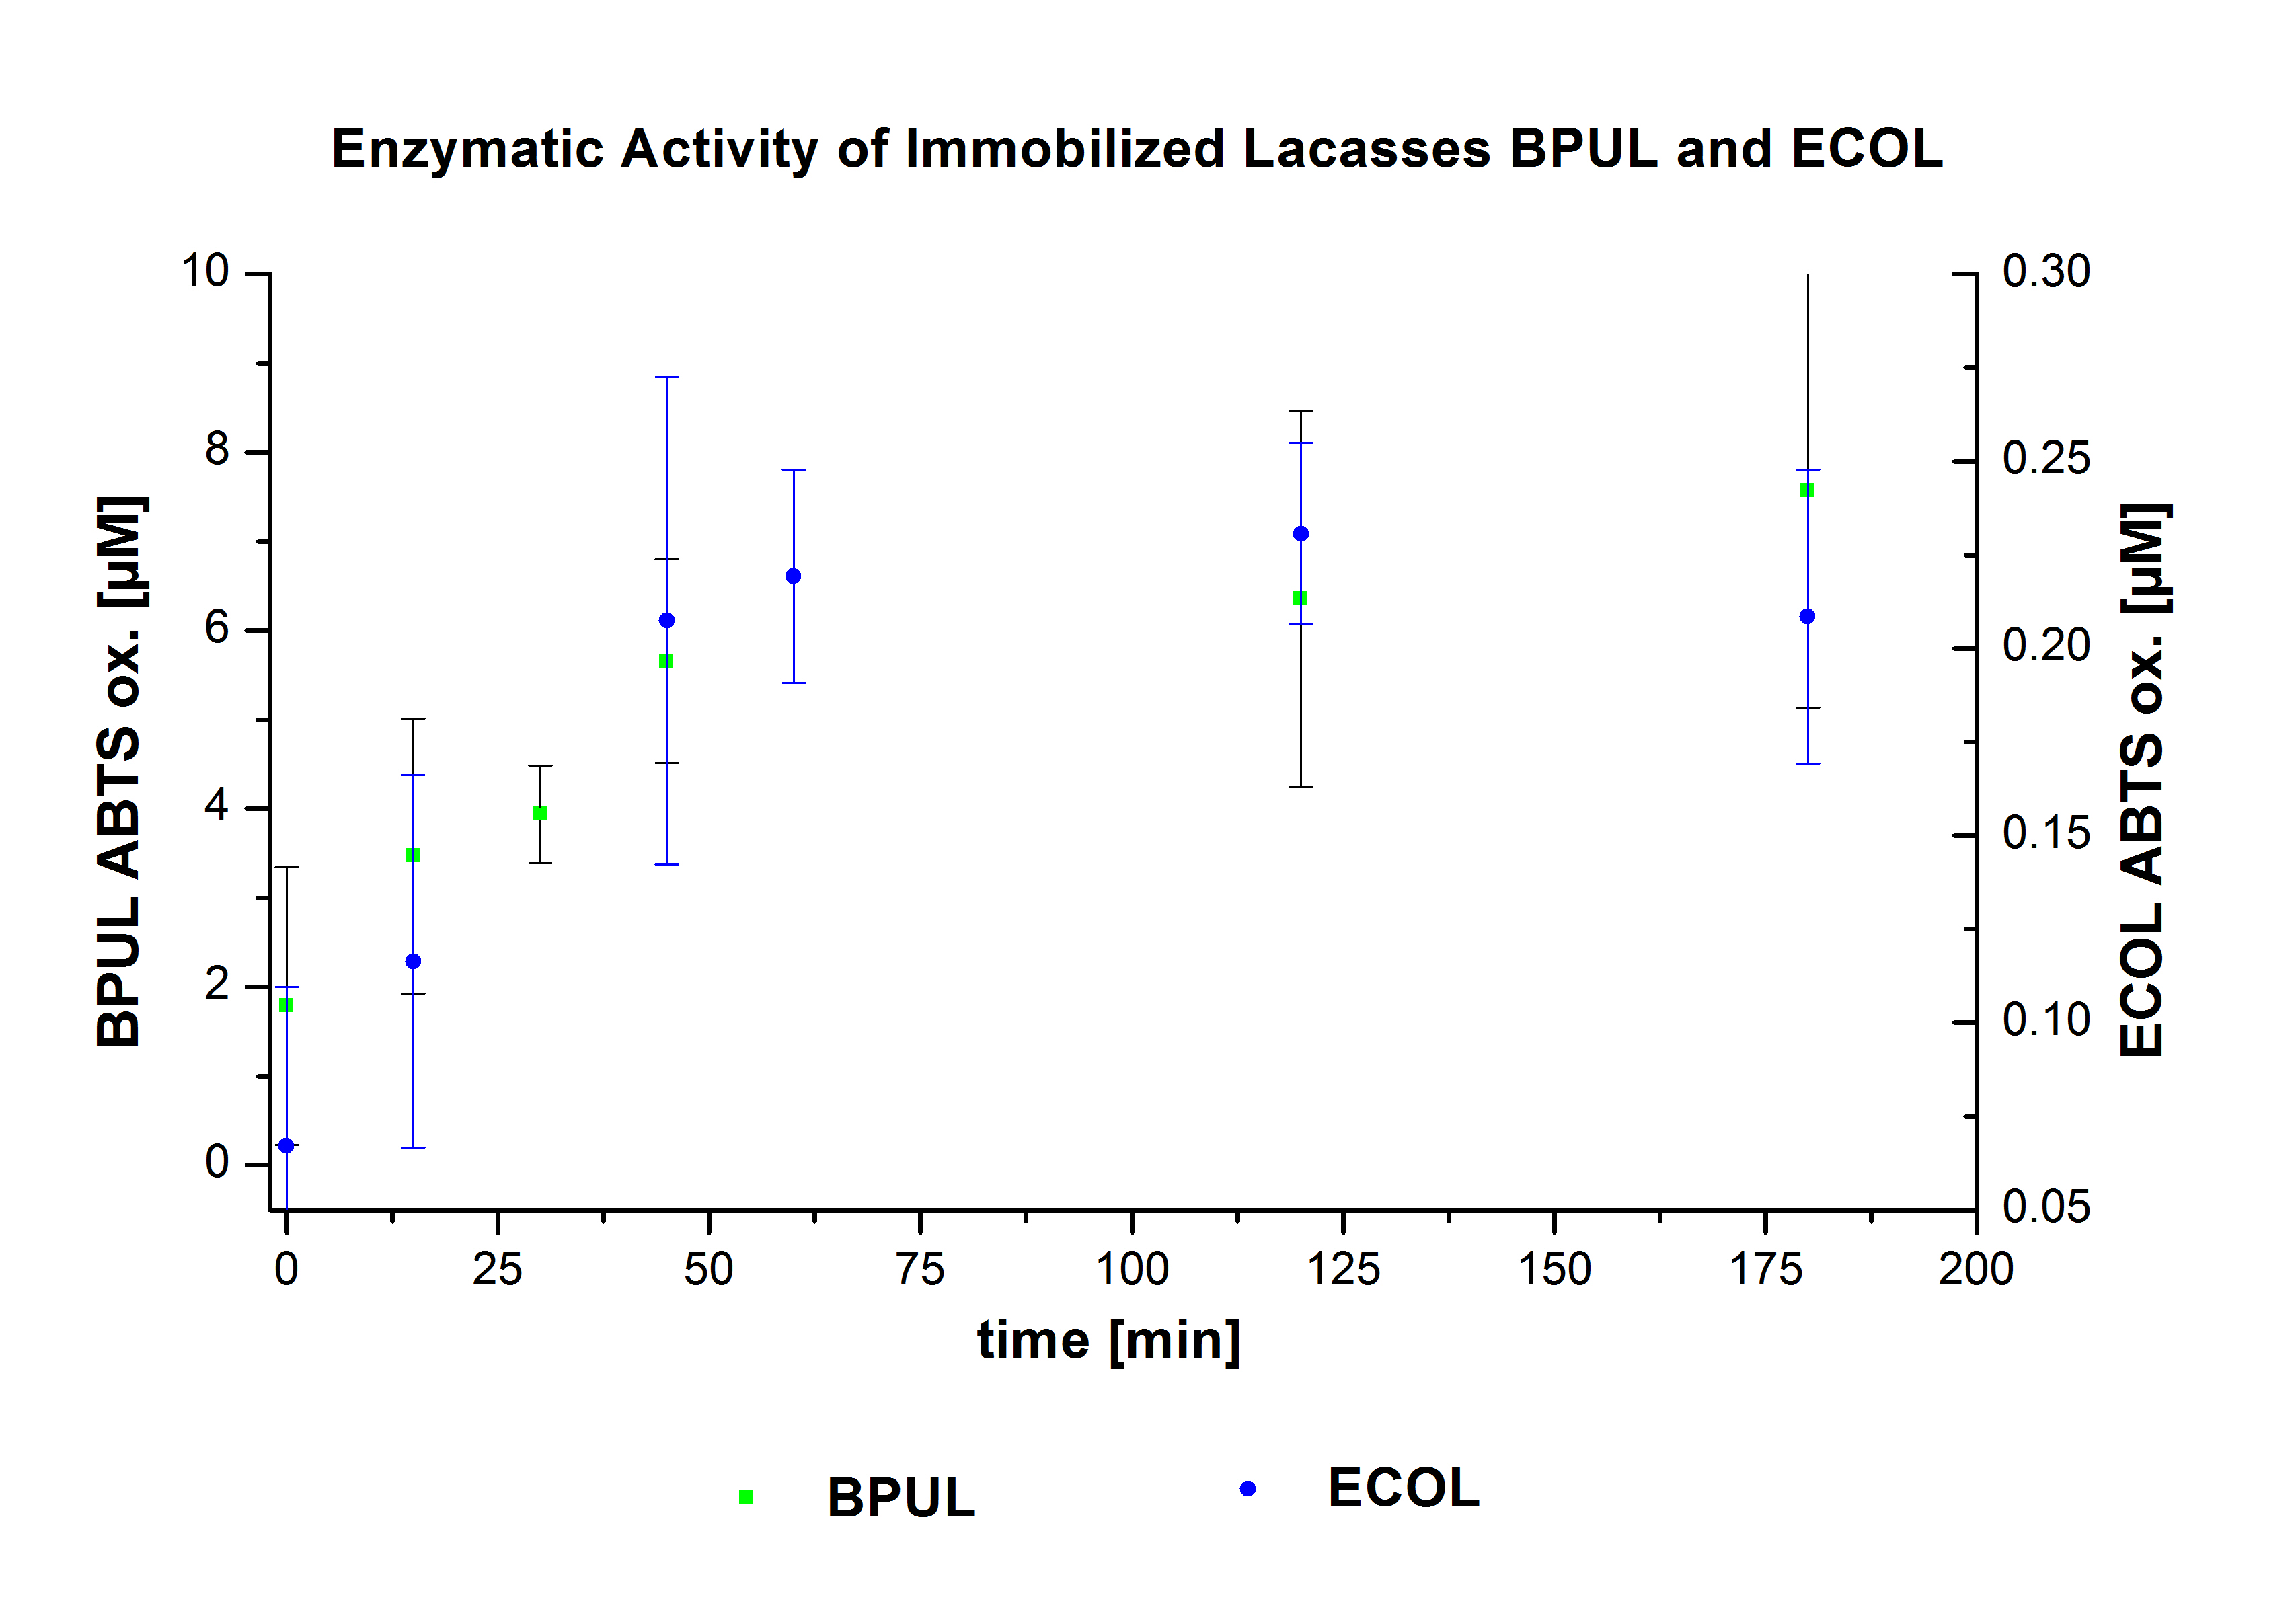
Figure 20 shows the percentage of laccases in the supernatant after incubation with CPC-beads, relative to the original concentration . The concentration of laccases in the supernatant after incubation was measured using Roti®-Nanoquant. The results show that only 0.2% of ECOL laccases are still present in the supernatant. This illustrates that ECOL was successfully immobilized on the CPC-beads.
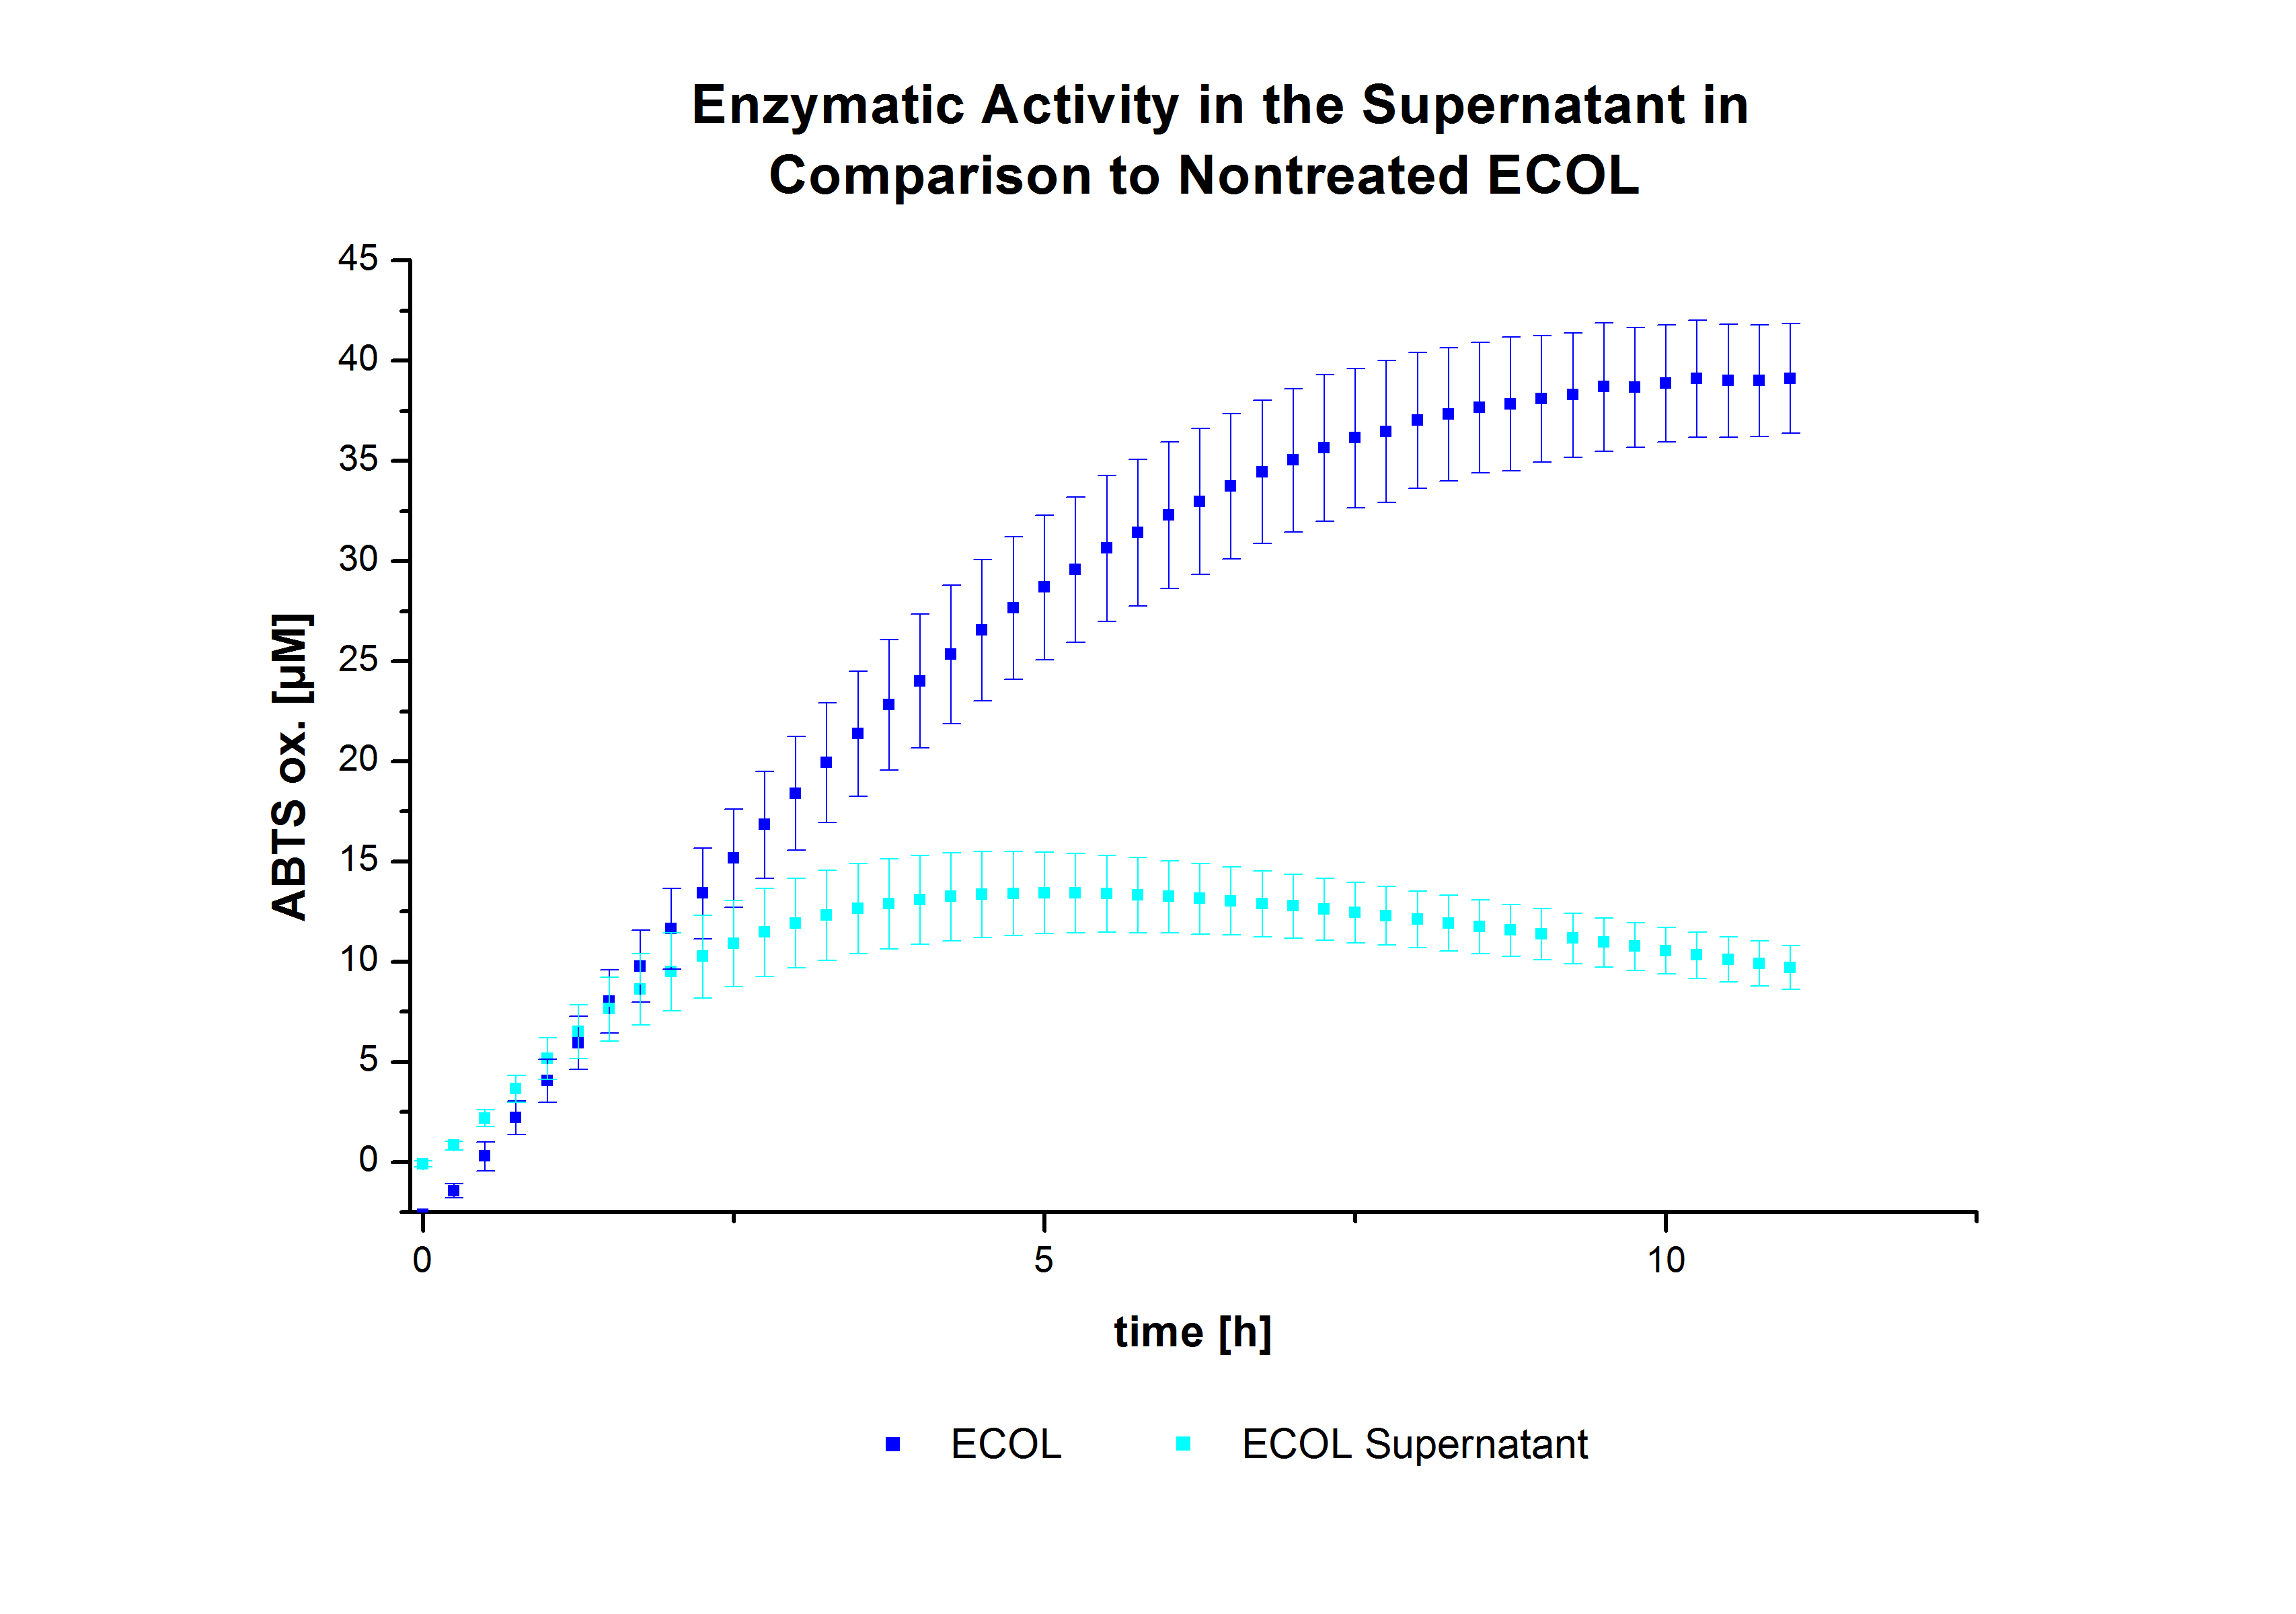
In figure 21, the enzymatic activity of ECOL in the supernatant is compared to the activity of nontreated ECOL. Although an activity can already be detected in the supernatant, this activity is low compared to the original.
Figure 22 presents the enzymatic activity of immobilized laccases compared to nontreated laccases. The activity of bound ECOL is very low, even lower than that in the supernatant.
| 55px | | | | | | | | | | |
 "
"


