Team:NTU-Taida/Modeling/Cell-Population-Response
From 2012.igem.org
(→Effect of cell density) |
(→Geometry Design) |
||
| Line 7: | Line 7: | ||
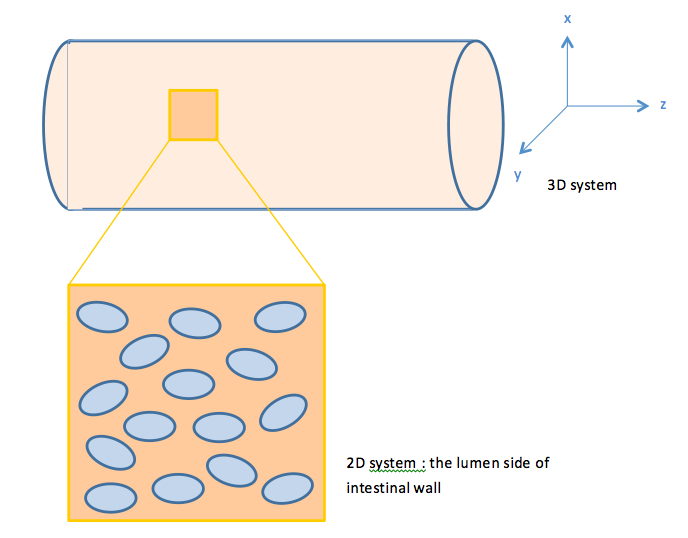
When E.coli cells colonize the intestine, they tend to attach onto the intestinal walls instead of distributing evenly throughout the intestine lumen. Therefore, we view our system as a two dimensional system. | When E.coli cells colonize the intestine, they tend to attach onto the intestinal walls instead of distributing evenly throughout the intestine lumen. Therefore, we view our system as a two dimensional system. | ||
| - | + | {{:Team:NTU-Taida/Templates/Fig|num=1|width=450px|name=NTU-Taida-Model-Cell-Population-fig1.png}} | |
With this in mind, we construct a plane in 2D geometry and couple the ODEs derived in our single cell model to simulate the presence of cells. | With this in mind, we construct a plane in 2D geometry and couple the ODEs derived in our single cell model to simulate the presence of cells. | ||
Revision as of 11:42, 26 October 2012
Cell Population Response Model
With the single cell model, we see the prolonging effect on the output response mediated by our quorum sensing module. The other important role our quorum sensing module plays is enabling cells to communicate with each other, as the uneven distribution of fatty acid in the intestines may cause gaps in individual detection. Cells with the quorum sensing module can respond to food intake event as long as their neighboring cells have detected fatty acid, enhancing the overall response to the food intake. However, the communication between cells via AHL can’t be seen when only viewing a single cell. Therefore, we construct a two-dimensional spatial temporal model with COMSOL Multiphysics in order to gain insights into the influence of cell-cell communication mediated via the quorum sensing module on the overall GLP1 expression.
Contents |
Geometry Design
When E.coli cells colonize the intestine, they tend to attach onto the intestinal walls instead of distributing evenly throughout the intestine lumen. Therefore, we view our system as a two dimensional system.
With this in mind, we construct a plane in 2D geometry and couple the ODEs derived in our single cell model to simulate the presence of cells.
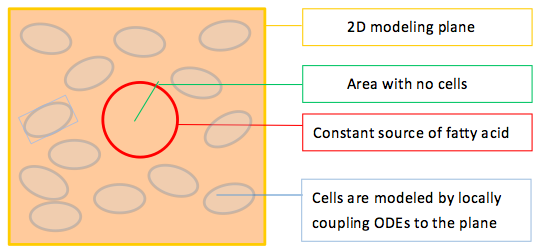
To model the effect of quorum sensing, we establish an uneven distribution of fatty acid by giving a constant concentration source of fatty acid in the middle of our modeled plane, as shown in Figure 2. There are no cells within the circular fatty acid source. As time goes by, fatty acids diffuse from the source and establish a concentric gradient. To see the effect of quorum sensing mechanism on overall GLP1 expression in a cell population with uneven distributed fatty acid input, we model cells with and without quorum sensing and compare their spatial–temporal GLP1 expression.
Spatial-temporal Model Equations
The first equation used in our model describes the free diffusion of fatty acids from the central source.
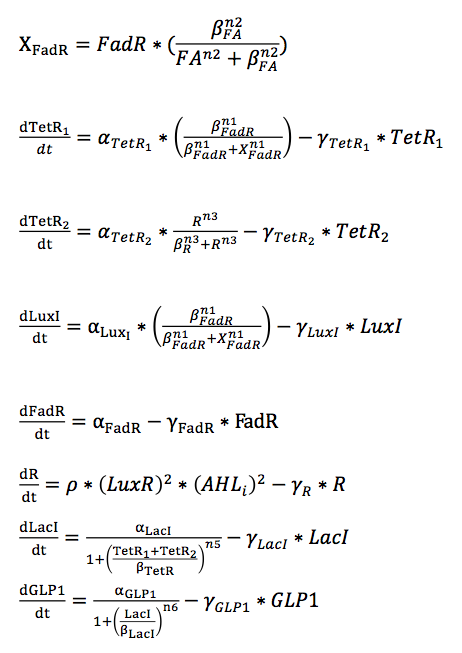
Other equations in the model are almost the same as those derived in our single cell model, except for the ones for AHL. For AHL, we have to set up a partial differential equation describing both the diffusion and the reaction event of AHL. We assume that AHL diffusion into and out of cells is fast and do not model this diffusion process explicitly. Therefore, in contrast to the single-cell model, we only use one species called AHL instead of an internal AHL concentration AHLi and an external AHL concentration AHLe.
he intestine is a cylindrical lumen, with fluids and a wide array of molecules attached or distributed along the intestinal wall. We assume that AHL has greater solubility to the environment near the intestinal wall in which viscous fluid attach than to the lumen. We would like to assume that AHL is constricted to the intestinal wall, and simulate AHL diffusion dimension along the plane (along the intestinal wall), and neglect its diffusion toward the intestinal lumen.
The diffusion of AHL is modeled by a free diffusion equation.
For the reaction term of AHL, we first discard the terms describing the diffusion into and out of the cell membrane in the ODEs of AHLi and AHLe in the single cell model. As previously mentioned, we assume that the diffusion AHL diffusion into and out of cells is fast. Therefore, we simply account for the diffusion of AHL across cell membrane by multiplying the intracellular AHLi terms by the relative cell density, which is described in the next section. With these considerations, we combine the two equations of AHLi and AHLe into one reaction equation.
With the help of COMSOL Multiphysics, we can consider both the diffusion and reaction terms of AHL by giving the diffusion (Eq. 2) and reaction (Eq. 5) equations above, without the need to solve the explicit PDE of AHL.
The remaining equations are the same as those in the single cell model.
For the control group without the quorum sensing module, we simply discard the terms related to quorum sensing system in the ODE set.
Relative Cell density
The relative cell density is defined as the ratio of the total area E.coli cells occupy to the area of the intestinal wall. By multiplying the intracellular AHL synthesis and degradation terms by the relative cell density, we assume that as a cell synthesizes or degrades AHL, the addition or reduction of AHL molecules is dispersed evenly through the neighboring area. (Mind that the diffusion of these AHL molecules on global scale is still governed by the free diffusion equation.)
We calculated the relative cell density by assuming there are 1014 bacteria cells residing in the intestine, which has a total surface area of 200 m2. Thus, the average cell density is 5*1011 cells/m2. We can measure the surface area of each individual cell by multiplying their length by their width, giving a surface area of 10-12 m2 per cell. Multiplying the surface area per cell and the average cell density gives the area density of total cells as 0.5.
Since 99% of the gut flora consists of 30-40 species of bacteria, we can assume that each of the common types contribute to approximately 1% of the total surface area of the intestine. Considering the clustering effect of cells, we assume that some regions would have much higher cell densities than others, such that the uneven distribution may result in a tenfold fluctuation in cell density. We hypothesize that the relative cell density in our model could be as high as 0.1.
Cell density has dramatic effect on the overall effect of quorum sensing system, as supported by a recent study investigating the synchronization of repressilators by quorum sensing mechanisms [1]. Therefore, we also model our system with different cell densities, as can be seen in the results.
Results
To see the effect of quorum sensing mechanism on overall GLP1 expression in a cell population with uneven distributed fatty acid input, we model cells with and without quorum sensing and compare their spatial - temporal GLP1 expression, with relative cell density of 0.1
The results show that species which are not regulated by the quorum sensing module, such as FA, X_FadR, and TetR1, show no difference in the spatial temporal expression pattern between system with and without the quorum sensing system.
However, species affected by the quorum sensing module, such as LacI and GLP1, show striking difference in their spatial temporal concentration pattern. Within the given time span, systems with a quorum sensing module produces GLP1 over a broader spatial region, resulting in more total GLP1.
Species unregulated by the quorum sensing module
| Systems without quorum sensing module | Systems with quorum sensing module |
|---|---|
| FA | |
| X_fadR | |
| TetR1 | |
Species regulated by the quorum sensing module
| Systems without quorum sensing module | Systems with quorum sensing module |
|---|---|
| LacI | |
The expression of LacI is inhibited by TetR proteins, and therefore is regulated by the quorum sensing module. Although the concentration of TetR1 is the same in systems with and without quorum sensing, cells with quorum sensing produce TetR2 as the output of the quorum sensing module and therefore result in overall more total TetR proteins. Thus, the repression of LacI is more significant in systems with the quorum sensing module.
| Systems without quorum sensing module | Systems with quorum sensing module |
|---|---|
| GLP1 | |
As the expression of GLP1 is repressed by LacI proteins, GLP1 also displays different spatial-temporal concentration pattern between the two systems. With quorum sensing module, the system produces more GLP1 overall.
Effect of cell density
Relative cell density plays a critical role in determining whether we can see a significant difference between systems with and without quorum sensing. We simulated the spatial-temporal response of GLP1 of four systems, all of them with the quorum sensing module but with relative cell densities of 0.2, 0.1, 0.05 and 0.01, respectively.
Then we compare their response to that of system without quorum sensing to determine if there exists a threshold of cell density, below which the effect of quorum sensing module is unperceivable.
We can see from the animations that the system with a relative cell density of 0.2 differs most with the system without the quorum sensing module. The system with a relative cell density of 0.1 shows moderate difference. The system with a relative cell density of 0.05 displays very subtle difference. There is no difference between the system with a relative cell density of 0.01 and the system with no quorum sensing module. Therefore, the threshold of relative cell density may lie between 0.05 and 0.01.
Reference
- Jordi Garcia-Ojalvo , Michael B. Elowitz, and Steven H. Strogatz , Modeling a synthetic multicellular clock: Repressilators coupled by quorum sensing, pnas,2004
 "
"


