Team:TU-Delft/Modeling/Diffusion
From 2012.igem.org
(→Boundary conditions) |
(→PDE) |
||
| Line 72: | Line 72: | ||
| - | In this graph we can see the result with | + | In this graph we can see the result with distance dimension of the 0 – 0.01 meter and the time dimension 0 - 100 seconds. this graph shows that after Approximately 100 seconds we can expect steady state at the x=0.01 boundary. |
| - | + | ||
| - | Approximately 100 seconds we can expect steady state at the x=0.01 boundary. | + | |
</div> | </div> | ||
<div id="contentbox" style="text-align:justify;"> | <div id="contentbox" style="text-align:justify;"> | ||
Revision as of 19:29, 26 September 2012


Contents |
Diffusion Model
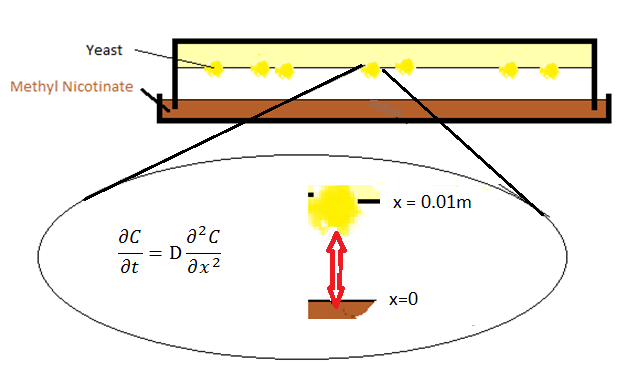
Imitating the way of how people smell the banana, a diffusion system is designed. In figure 1 the setup is shown.
For the initial experiments a model of the diffusion in the Petridish could be useful to evaluate the effectiveness of the experimental setup.
Modeling of this setup was especially done to evaluate the speed of diffusion from the ligand phase to the yeast cells themselves and see if this behavior is slow or quick with respect to the biochemical behavior of the yeast.
Partial Differential Equations (PDE) are used to solve this problem.
Boundary conditions
Two boundary conditions are set for these two surfaces of petridish-gas and gas-agar.
- At x=0, the Dirichlet boundary condition was placed:

with Psat being the saturation pressure of the specific compound being IsoAmylAcetate as an example in our model. For IsoAmylAcetate this value is 533.3 Pa at room temperature.
- One can take Neumann boundary condition at x=l, where l is the distant between petridish and agar and assumed to be 0.01 meter.

In this part of the system the molecules bounce against the agar surface back into the gasphase. A van Neumann boundary is the way to give a mathematical workable structure to that. For the problem definition to be complete and be able to start programming in MATLAB we only need one more value, being the diffusion coefficient. For this an empirical relation from the [1] was used.
PDE
Now we have a complete problem that we will solve using a numerical approach. Put this in the pressure domain.


And you probably guessed but my value for h is ok in the model and in my code this translates to the line:
dcdt(i,1)= a*x(i-1,1)+a*x(i+1,1) -2*a*x(i,1);
and YES a=h here and YES that IS confusing considering the other above statements. What I basically did is grab a bunch of Ordinary differential equations and couples them So that it becomes a PDE ( partial differential equation ). H*time step should also not be bigger than 0.5 and that does not happen, so the solution is stable.
For the boundaries I did the following:
dcdt(n+1,1)= a*x(n,1)+a*x(n-1,1) -2*a*x(n+1,1) ;
Looping the two last boxes to eachother in that way creating the von Neumann boundary. For the Dirichlet boundary I Just kept on setting the C value at x=0 to Psat.
Analytical solutions for this problem appeared a little more troublesome than expected. There are solutions ( in Sum row form ), but I was anticipating a nice function. I will get a book at the library to see if there are any better ones, but for now this works out fine. I can also use a Cranck-Nicolson approach to the problem to have another numerical solution for verification. And last but not least. The results:
In this graph we can see the result with distance dimension of the 0 – 0.01 meter and the time dimension 0 - 100 seconds. this graph shows that after Approximately 100 seconds we can expect steady state at the x=0.01 boundary.
Snifferometer
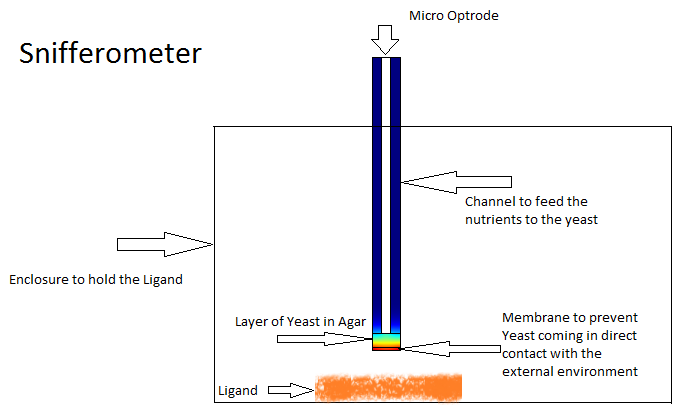
One of the other goals of the diffusion modeling was to model the device which we intended to build for the project. We made use of the finite element analysis simulator Comsol Multiphysics[3]
for developing this model.Different models were analyzed for their suitability before coming to the final design in Figure. The device at the bottom has a membrance preventing the yeast coming in direct contact with external substances, above which is a layer of agar in which yeast is placed, the nutrients for it's growth is fed in through a channel along the sides of the tube using which the yeast cells can also be replaced as and when needed. A micro-optrode is then used to sense the photons emitted by the fluoroscent proteins.
Saliva Model
References
Chen, N. H. (1962). New Generalized Equation for Gas Diffusion Coefficient. J. Chem. Eng. Data, 37–41.
 "
"


