Team:Bielefeld-Germany/Results/Summary
From 2012.igem.org
(→Degradation results) |
(→Degradation results) |
||
| Line 532: | Line 532: | ||
We have detected our limit of detection by making some calibration curves. The limit were for the hormonal subtrates 10µg/L and we used this information for the other substrates. | We have detected our limit of detection by making some calibration curves. The limit were for the hormonal subtrates 10µg/L and we used this information for the other substrates. | ||
=== Degradation results === | === Degradation results === | ||
| - | The TVEL0 was able to degradate the synthetic estradiol (fig. 1) and we cannot say it for sure but also Anthracen (fig 3.). Anthracen distingrates itself in the Britton Puffer but with Laccases there is less Anthracen measured in the LC-MS indicating our Laccase is able to degradate it(fig. 4). Esteron (fig. 5) and Estradiol (fig. 6) were degrade as well. On Esteron we could not identify any degradation products. The reason for this could be that the products are not detectable with LC-MS. We could identify peaks in the degradation of Estradiol but were not able to identify them. On the following figures you can see the results of our LC-MS measurments. | + | The TVEL0 was able to degradate the synthetic estradiol (fig. 1) and we cannot say it for sure but also Anthracen (fig 3.). Our Ethinylestradiol calibration curve showed that it is stable in the media we used (fig 2.). Anthracen distingrates itself in the Britton Puffer but with Laccases there is less Anthracen measured in the LC-MS indicating our Laccase is able to degradate it (fig. 4). Esteron (fig. 5) and Estradiol (fig. 6) were degrade as well. On Esteron we could not identify any degradation products. The reason for this could be that the products are not detectable with LC-MS. We could identify peaks in the degradation of Estradiol but were not able to identify them. On the following figures you can see the results of our LC-MS measurments. |
==High performance liquid chromatography== | ==High performance liquid chromatography== | ||
Revision as of 11:03, 26 September 2012
Summary
Cultivation and Purification of the different laccases
During our research we cultivated the following BioBricks and produced several laccase. To simplify the presentation of our results we named the produced laccase like the following system
| Produced and generated BioBricks with the source strain of the DNA-sequence, promoter, protein name and the names given by the iGEM Team Bielefeld | ||||
|---|---|---|---|---|
| BioBrick code | strain | promoter | name of protein | name given by the iGEM Team |
| <partinfo>K863000</partinfo> | Bacillus pumilus DSM 27 | T7 promoter | CotA | BPUL |
| <partinfo>K863005</partinfo> | E. coli BL21(DE3) | T7 promoter | CueO | ECOL |
| <partinfo>K863010</partinfo> | Thermus thermophilus HB27 | T7 promoter | tthL | TTHL |
| <partinfo>K863012</partinfo> | Thermus thermophilus | constitutive promoter (<partinfo>BBa_J23100</partinfo>) | tthL | TTHL |
| <partinfo>K863015</partinfo> | Xanthomonas campestris pv. campestris B100' | T7 | CopA | XCCL |
| <partinfo>K863020</partinfo> | Bacillus halodurans C-125 | T7 | Lbh1 | BHAL |
| <partinfo>K863022</partinfo> | Bacillus halodurans C-125 | constitutive promoter (<partinfo>BBa_J23100</partinfo>) | Lbh1 | BHAL |
All BioBricks of the iGEM Team Bielefeld were screened to identify the best conditions for protein expression. The first trials were made by shaking flask cultivations with different parameters. These parameters were various shaking flask designs , different temperatures, different concentrations of chloramphenicol, various induction strategies , several cultivation times and some cultivations in absence or presence of CuCl2. To detect the produced laccases different analysis methods were performed like SDS-PAGE analysis as well as MALDI-TOF.
Datapage
How our system works
Data for our favorite new parts
- <partinfo>K863000</partinfo> - bpul (laccase from Bacillus pumilus) with T7 promoter, RBS and HIS tag:
- <partinfo>K863005</partinfo> - ecol (laccase from E. coli) with T7 promoter, RBS and HIS tag:
Data for pre-existing parts
We have also characterized the following parts
- <partinfo>BBa_K863012</partinfo> - tthl laccase (from T. thermophilus) with constitutive promoter J23100, RBS and HIS tag:
- <partinfo>BBa_K863022</partinfo> - bhal laccase (from Bacillus halodurans) with constitutive promoter J23100, RBS and HIS tag:
Laccase CotA from [http://www.dsmz.de/catalogues/details/culture/DSM-27.html Bacillus pumilus DSM 27 ( ATCC7061])
First some trials of shaking flask cultivations were made with different parameters to define the best conditions for the production of the His-tagged CotA aus [http://www.dsmz.de/catalogues/details/culture/DSM-27.html Bacillus pumilus DSM 27 ( ATCC7061)] named BPUL. Because of no measured activity in the cell lysate a purification method was established (using Ni-NTA-Histag resin). The purified BPUL could be detected by SDS-PAGE (molecular weight of 58.6 kDa) as well as MALDI-TOF. To improve the purification strategies the length of the elution gradient was increased. The fractionated samples were also tested concerning their activity. A maximal activity of X was reached. After measuring activity of BPUL a scale up was made up to 3 L and also up to 6 L.
Shaking Flask Cultivation
The first trials to produce the CotA-laccase from [[http://www.dsmz.de/catalogues/details/culture/DSM-27.html Bacillus pumilus DSM 27 ( ATCC7061, named BPUL) were performed in shaking flasks with various designs (from 100 mL-1 to 1 L flasks, with and without baffles) and under different conditions. The parameters we have changed during our screening experiments were temperature (27 °C,30 °C and 37 °C), different concentrations of chloramphenicol (20 to 170 µg mL-1), induction strategies (autoinduction and manual induction with 0,1 % rhamnose) and cultivation time (6 - 24 h). Further we cultivated with and without 0,25 mM CuCl2, to provide a sufficient amount of copper, which is needed for the active center of the laccase. Due to the screening experiments we identified the best conditions for expression of BPUL (see below). The addition of CuCl2 did not lead to better results, so it was omitted.
- flask design: shaking flask without baffles
- medium: autoinduction medium
- antibiotics: 60 µg mL-1 chloramphenicol
- temperature: 37 °C
- cultivation time: 12 h
The reproducibility and repeatability of the measured data and results were investigated for the shaking flask and bioreactor cultivation.
3 L Fermentation E. coli KRX with <partinfo>BBa_K863000</partinfo>
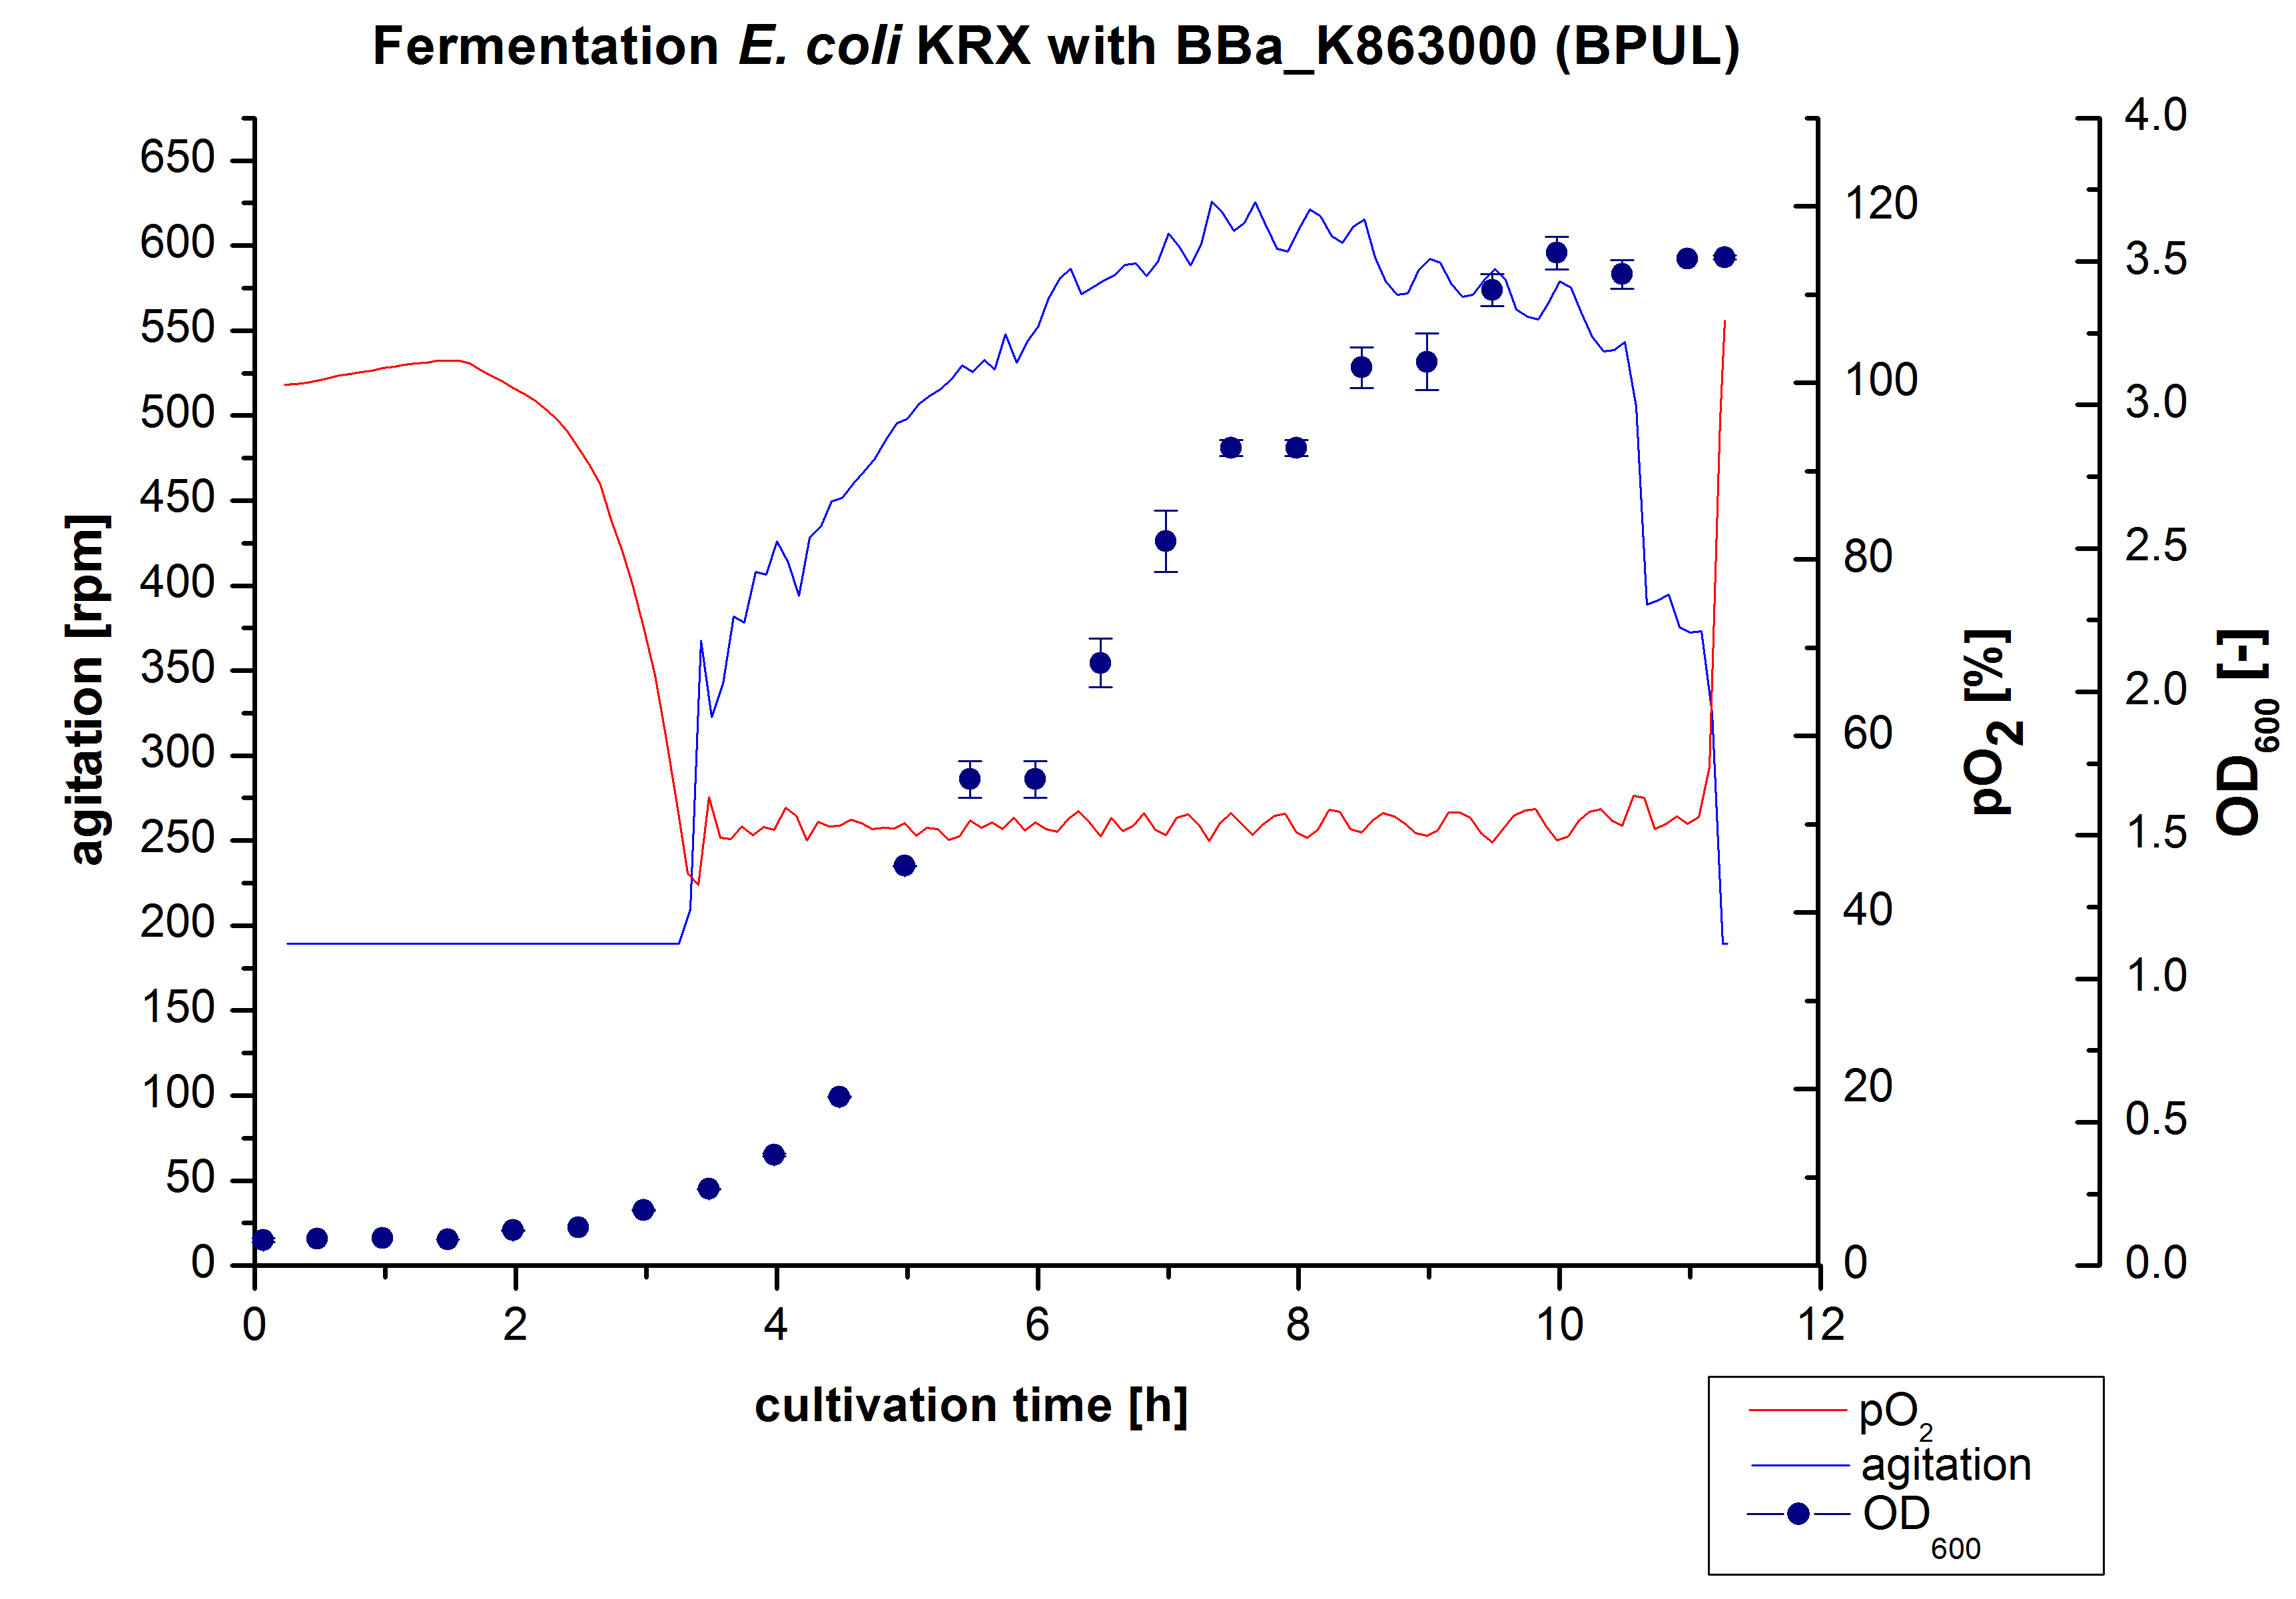
After the measurement of BPUL activity we made a scale-up and fermented E. coli KRX with <partinfo>BBa_K863000</partinfo> in Braun Biostat B with a total volume of 3 L. Agitation speed, pO2 and OD600 were determined and illustrated in Figure 1. We got a long lag phase of 2 hours due to a relatively old preculture. The cell growth caused a decrease in pO2 and after 3 hours the value fell below 50 %, so that the agitation speed increased automatically. After 8.5 hours the deceleration phase started and therefore the agitation speed was decreased. The maximal OD600 of 3.53 was reached after 10 hours, which means a decrease in comparison to the fermentation of E. coli KRX under the same conditions (OD600,max =4.86 after 8.5 hours, time shift due to long lag phase). The cells were harvested after 11 hours.
Purification of BPUL
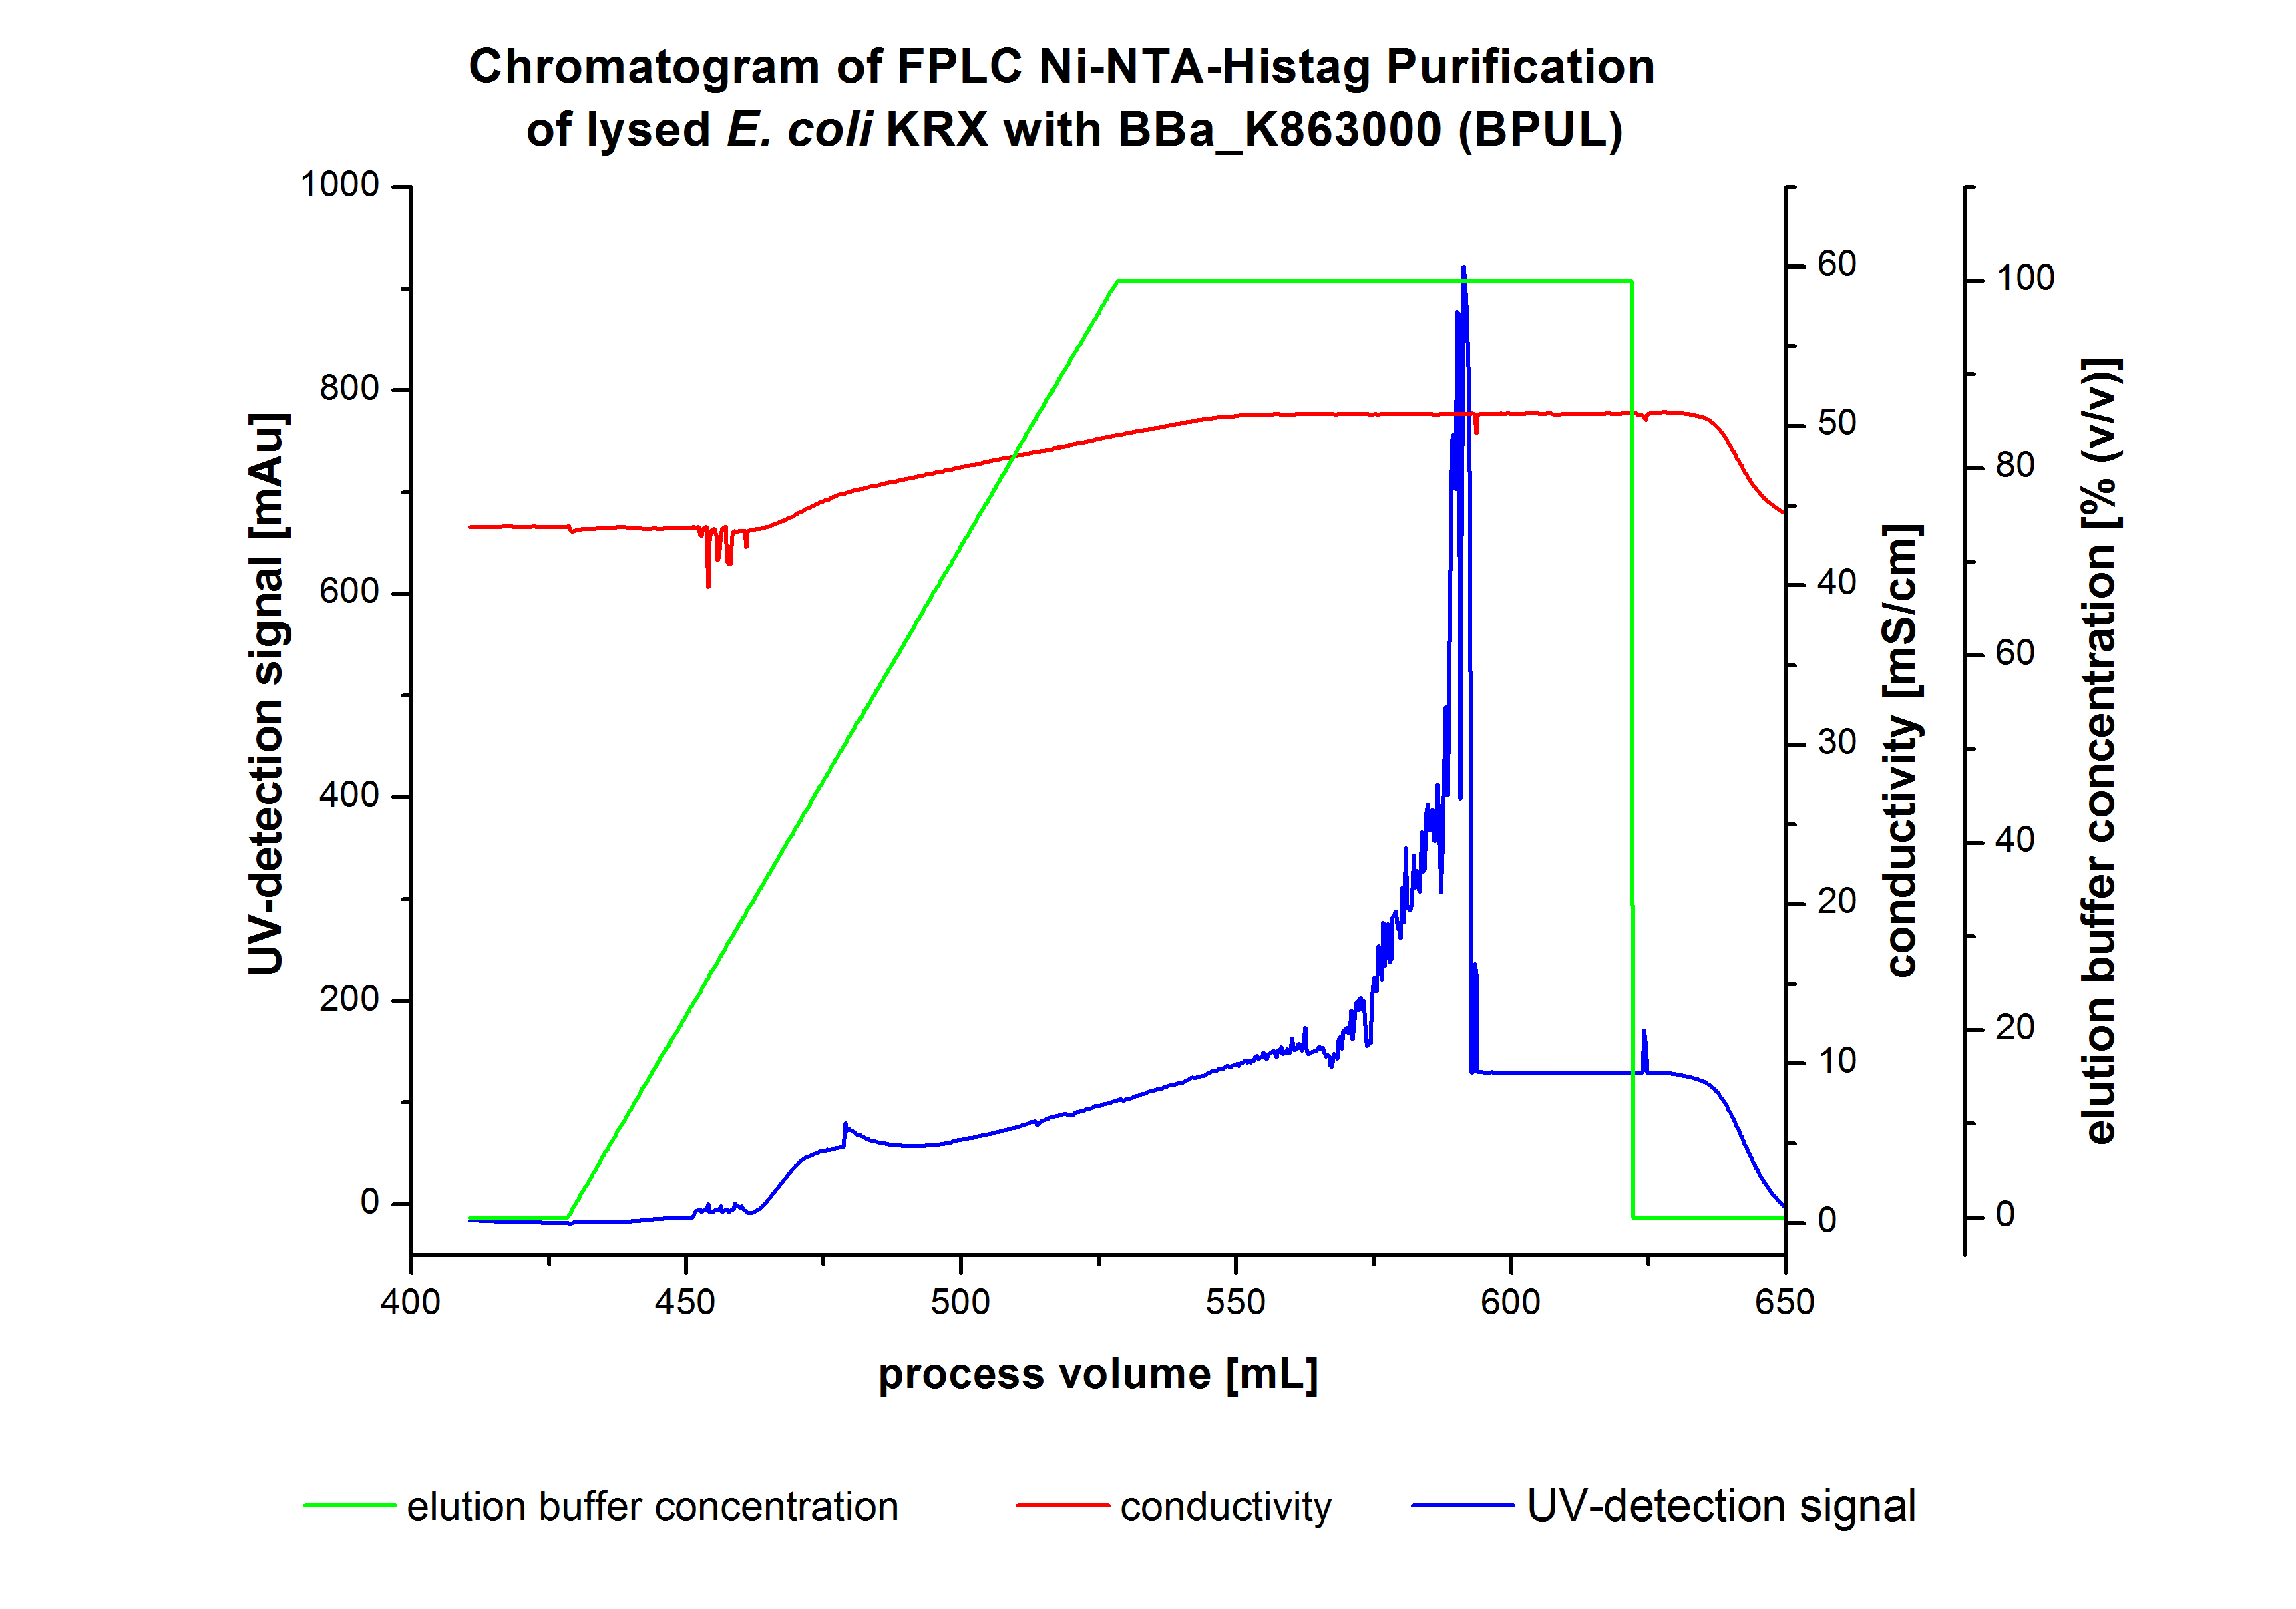
The harvested cells were resuspended in Ni-NTA-equilibrationbuffer, mechanically lysed by homogenization and centrifuged. The supernatant of the lysed cell paste was loaded on the Ni-NTA-column (15 mL Ni-NTA resin) with a flowrate of 1 mL min-1 cm-2. The column was washed with 10 column volumes (CV) Ni-NTA-equilibrationbuffer. The bound proteins were eluted by an increasing Ni-NTA-elutionbuffer gradient from 0 % to 100 % with a total volume of 100 mL and the elution was collected in 10 mL fractions. Due to the high UV-detection signal of the loaded samples and to simplify the illustration of the detected product peak only the UV-detection signal of the wash step and the elution are shown. A typical chromatogram of purified laccases is illustrated here. The chromatogram of the BPUL-elution is shown in figure 2:
The chromatogram shows a remarkable widespread peak between the process volume of 460 mL to 480 mL with the highest UV-detection signal of 69 mAU, which can be explained by the elution of bound proteins. The corresponding fractions were analyzed by SDS-PAGE analysis. Afterwards the UV-signal increased caused by the changing imidazol concentration during the elution gradient. Between the process volume of 550 and 580 mL there are several peaks (up to a UV-detection-signal of 980 mAU) detectable. These results are caused by an accidental detachment in front of the UV-detector. Just to be on the safe side, the corresponding fractions were analyzed by SDS-PAGE analysis. The results of the SDS-PAGE are shown in the following pictures.
SDS-PAGES of purified BPUL
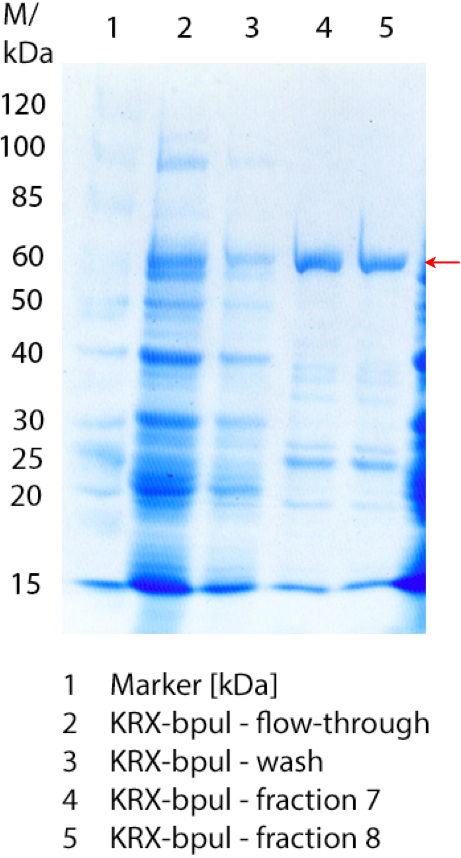
Figure 3 shows the purified E. coli KRX with <partinfo>BBa_K863000</partinfo> lysates (fermented in 3 L Braun Biostat B) including flow-through, wash and the elution fractions 7 and 8. These two fractions were chosen due to a remarkable peak in the chromatogram. BPUL has a molecular weight of 58.6 kDA and was marked with a red arrow. The band appears in both fractions. There are also some other non-specific bands, which could not be identified. To improve the purification the elution gradient length should be longer and slower the next time.
The appearing bands were analysed by MALDI-TOF and could be identified as CotA (BPUL).
6 L Fermentation of E. coli KRX with <partinfo>BBa_K863000</partinfo>
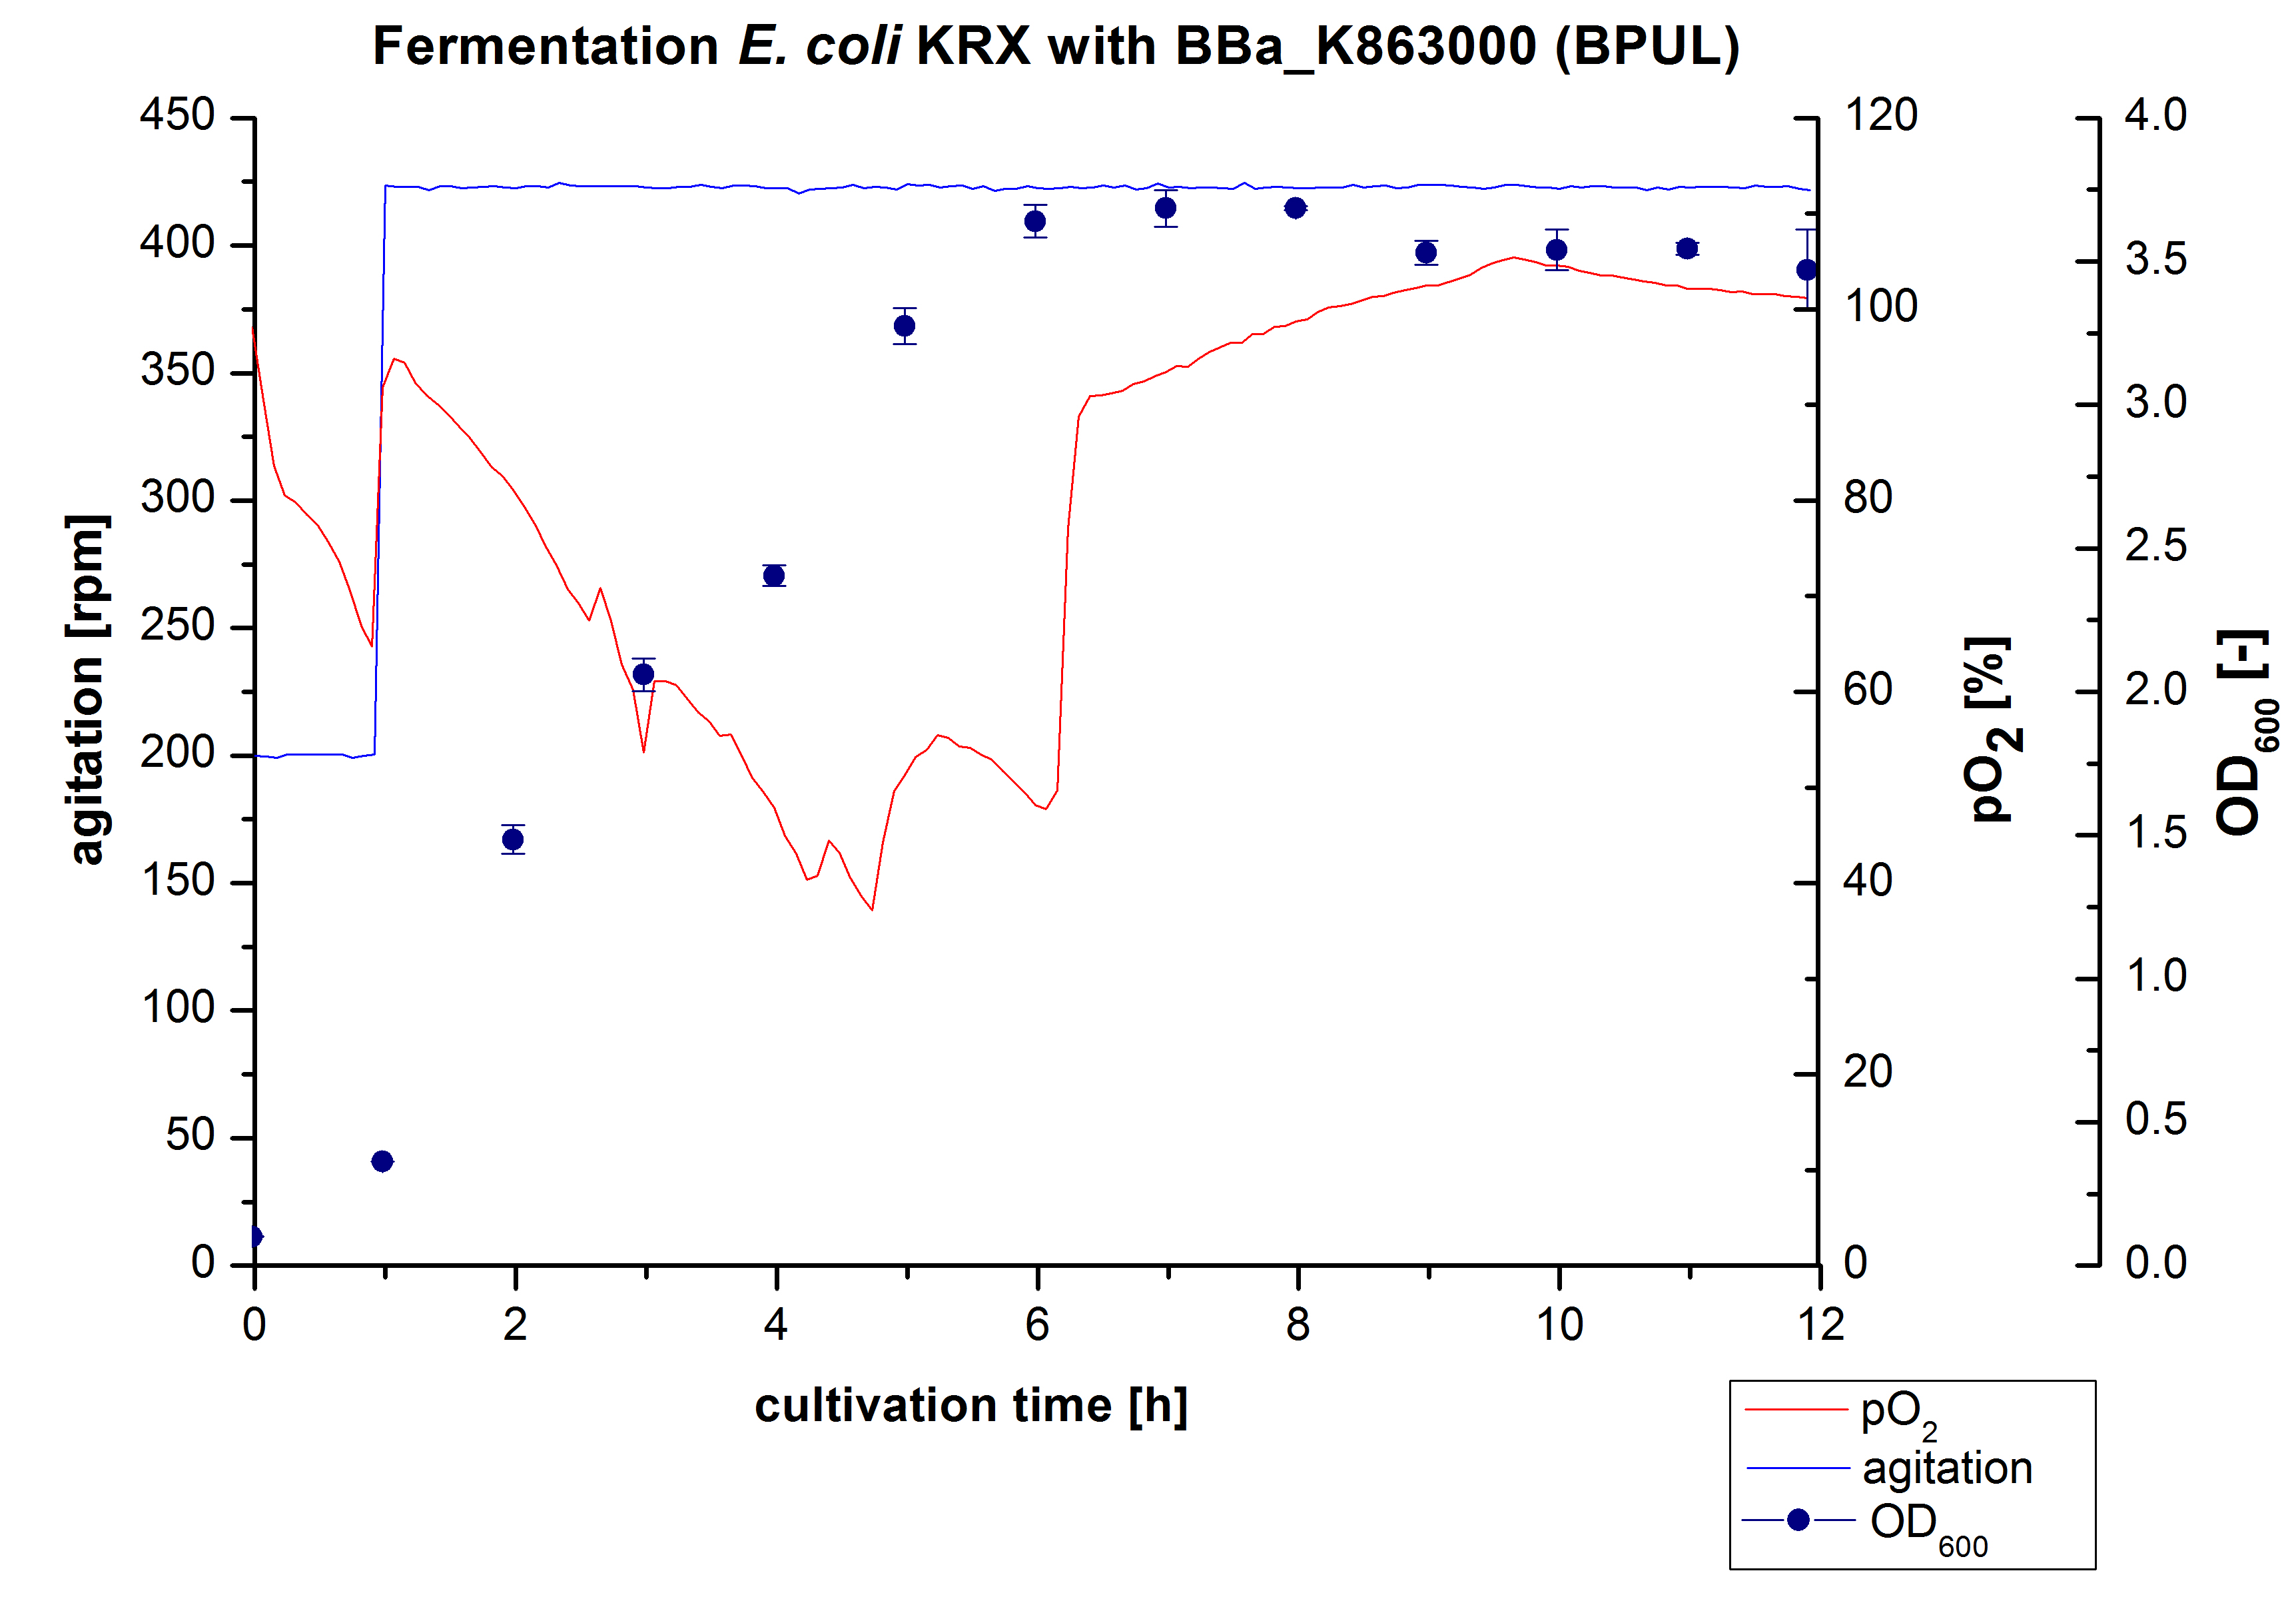
Another scale-up for E. coli KRX with <partinfo>BBa_K863000</partinfo> was made up to a final working volume of 6 L in a Bioengineering NFL22. Agitation speed, pO2 and OD600 were determined and illustrated in Figure 4. There was no noticeable lag phase. Agitation speed was increased up to 425 rpm after one hour due to problems caused by the control panel. The pO2 decreased until a cultivation time of 4.75 hours. The increasing pO2-Level indicates the beginning of the deceleration phase. There is no visible break in cell growth caused by an induction of protein expression. A maximal OD600 of 3.68 was reached after 8 hours of cultivation, which is similar to the 3 L fermentation (OD600 = 3.58 after 10 hours, time shift due to long lag phase). The cells were harvested after 12 hours.
Purification of BPUL
The harvested cells were prepared in Ni-NTA-equilibrationbuffer, mechanically lysed by homogenization and centrifuged. The supernatant of the lysed cell paste was loaded on the Ni-NTA-column (15 mL Ni-NTA resin) with a flowrate of 1 mL min-1 cm-2. The column was washed with 5 column volumes (CV) Ni-NTA-equilibrationbuffer. The bound proteins were eluted by an increasing elutionbuffer gradient from 0 % (equates to 20 mM imidazol) to 100 % (equates to 500 mM imidazol) with a length of 200 mL. This strategy was chosen to improve the purification by a slower increase of Ni-NTA-elutionbuffer concentration. The elution was collected in 10 mL fractions.Due to the high UV-detection signal of the loaded samples and to simplify the illustration of the detected product peak only the UV-detection signal of the wash step and the elution are shown. A typical chromatogram of purified laccases is illustrated here. The chromatogram of the BPUL-elution is shown in figure 5.
The chromatogram shows a peak at the beginning of the elution. This can be explained by pressure fluctuations upon starting the elution procedure. Between a process volume of 832 mL and 900 mL there is remarkable widespread peak with a UV-detection signal of 115 mAU. This peak corresponds to an elution of bound proteins at a Ni-NTA-elutionbuffer concentration between 10 % and 20 % (equates to 50-100 mM imidazol) . The corresponding fractions were analyzed by SDS-PAGE. The ensuing upwards trend of the UV-signal is caused by the increasing imidazol concentration during the elution gradient. Towards the end of the elution procedure there is a constant UV-detection signal, which shows, that most of the bound proteins was already eluted. Just to be on the safe side, all fractions were analyzed by SDS-PAGE to detect BPUL. The results of the SDS-PAGE are shown in the following pictures.
SDS-PAGES of purified BPUL
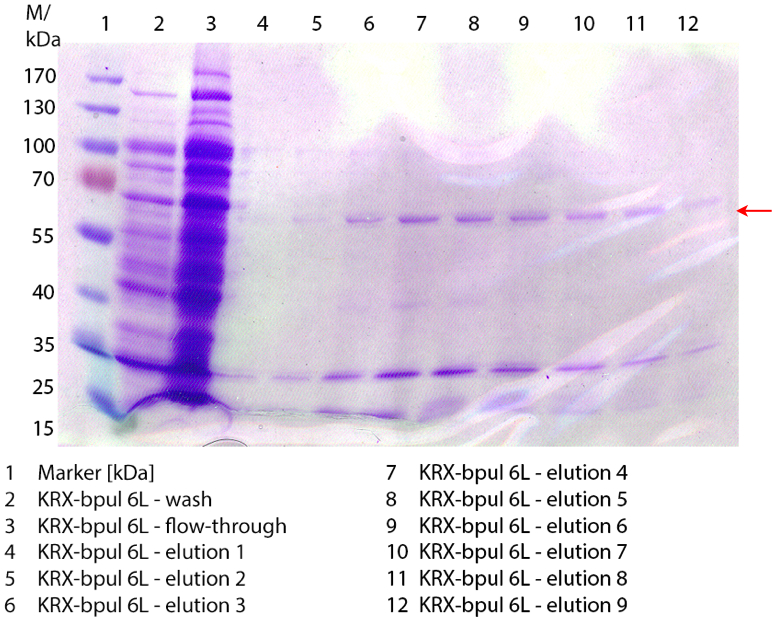
In figure 7 the SDS-PAGE of the Ni-NTA-Histag purification of the lysed culture of E. coli KRX containing <partinfo>BBa_K863000</partinfo> is illustrated. It shows the flow-through, wash and elution fractions 1 to 9. BPUL has a molecular weight of 58.6 kDA and was marked with a red arrow. The band appears in all fractions from 2 to 9 with varying strength, the strongest ones in fractions 7 to 9. There are also some other non-specific bands, which could not be identified. Therefore the purification method could moreover be improved.
Furthermore the bands were analysed by MALDI-TOF and identified as CotA (BPUL).
Activity Analysis of [http://partsregistry.org/wiki/index.php?title=Part:BBa_K863000 BPUL]
Initial activity tests of purified fractions
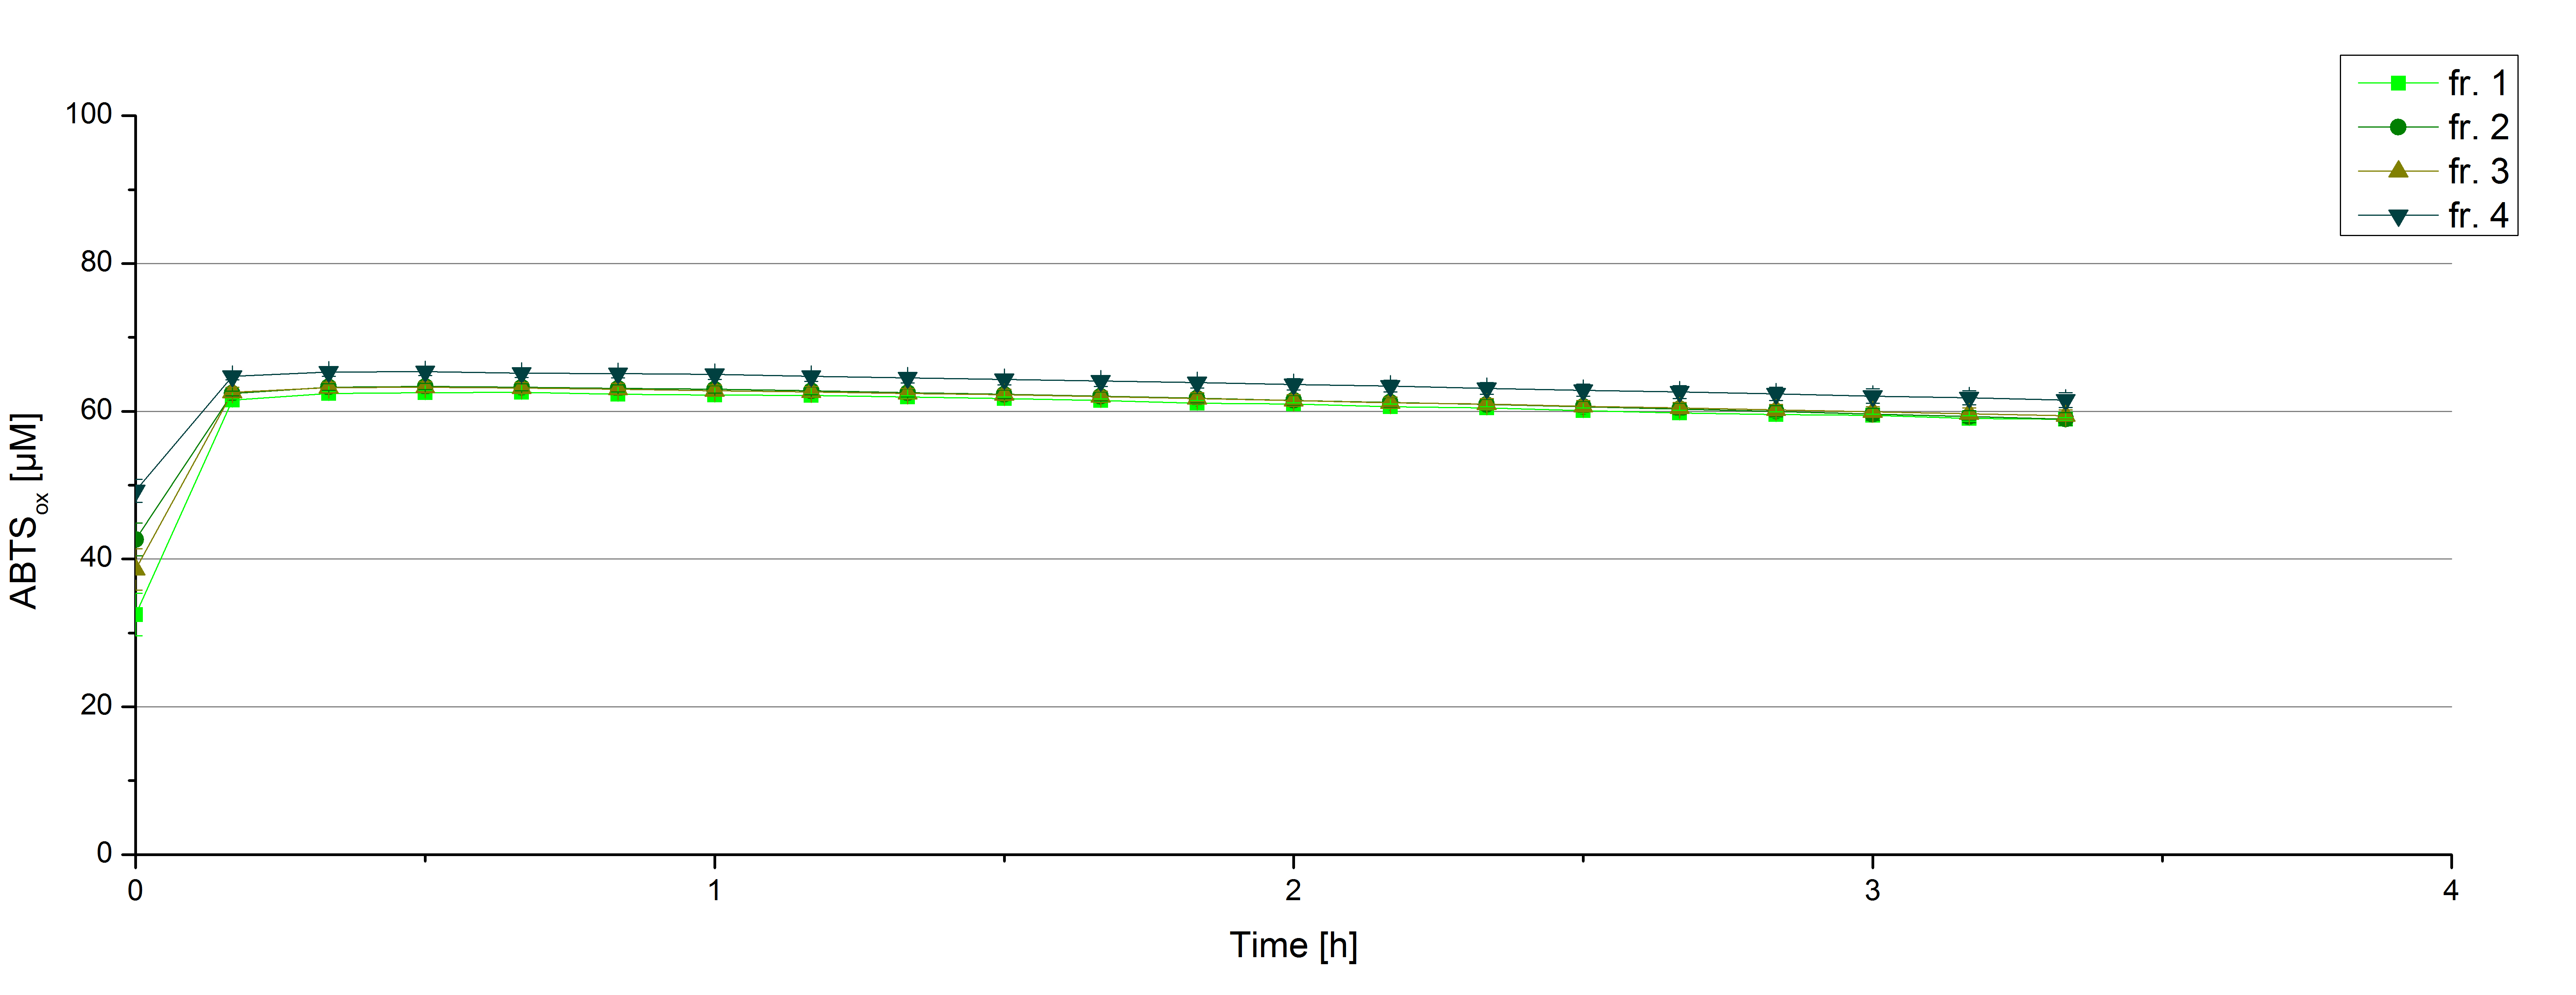
Initial tests were done with elution fractions 1 to 4 to determine the activity of the purified BPUL laccases. The fractions were rebuffered into deionized H2O using HiTrap Desalting Columns and incubated with 0.4 mM CuCl. The reaction setup included 140 µL of each elution fraction, 100 mM sodium acetate buffer (pH 5), ad 198 deionized H2O and 0.1 mM ABTS and the absorption was measured at 420 nm to detect oxidization over a time period of 5 hours at 25°C. Each fraction did show reactivity in laccases oxidizing ABTS (see figure 1). After 15 minutes the saturation took place with ~60 µM oxidized ABTS. After 5 hours ~5 µM ABTS got reduced again. This behavior has been seen in the activty plot of TVEL0 before indicating, that the laccase seems to can not hold the level of oxidized ABTS in total. Additionally protein concentrations of each fraction were identified using the Bradford protocol. The four tested fractions showed approximately the same amount of protein, namely 0.5 mg/mL. Fraction 4, having the most protein and also most of active laccase was chosen for subsequent activity tests of BPUL. The protein concentration was reduced to 0.03 mg/mL for each measured sample to allow a comparison between TVEL0 measurements and BPUL measurements.
Laccase CueO from Escherichia coli BL21 (DE3)
First some trials of shaking flask cultivations were made with changing parameters to identify the best conditions for the production of the laccase CueO from ''E. coli'' BL21 (DE3) named ECOL fused to a Histag. Because of no measured activity in the cell lysate a purification method was established (using Ni-NTA-Histag resin). The purified ECOL could be identified by SDS-PAGE (molecular weight of 53.4 kDa) as well as MALDI-TOF. The fractionated samples were also tested concerning their activity. A maximal activity of X was reached. After measuring activity of ECOL a scale up was made up to 3 L and then also up to 6 L.
Shaking Flask Cultivations
The first trials to produce ECOL were produced in shaking flask with various designs (from 100 mL-1 to 1 L flasks, with and without baffles) and under different conditions. The parameters we have changed during our screening experiments were the temperature (27 °C,30 °C and 37 °C), different concentrations of chloramphenicol (20-170 µg mL-1), various induction strategies ([autoinduction autoinduction and manual induction), several cultivation times (6 - 24 h) and in absence or presence of 0.25 mM Cu2Cl. Due to the screening experiments we identified the best conditions under which ECOL was expressed:
- flask design: shaking flask without baffles
- medium: autoinduction medium
- antibiotics: 60 µg mL-1 chloramphenicol
- temperature: 37 °C
- cultivation time: 12 h
The reproducibility and repeatability of the measured data and results were investigated for the shaking flask and bioreactor cultivation with n ≤ 3.
3 L Fermentation E. coli KRX with <partinfo>BBa_K863005</partinfo>
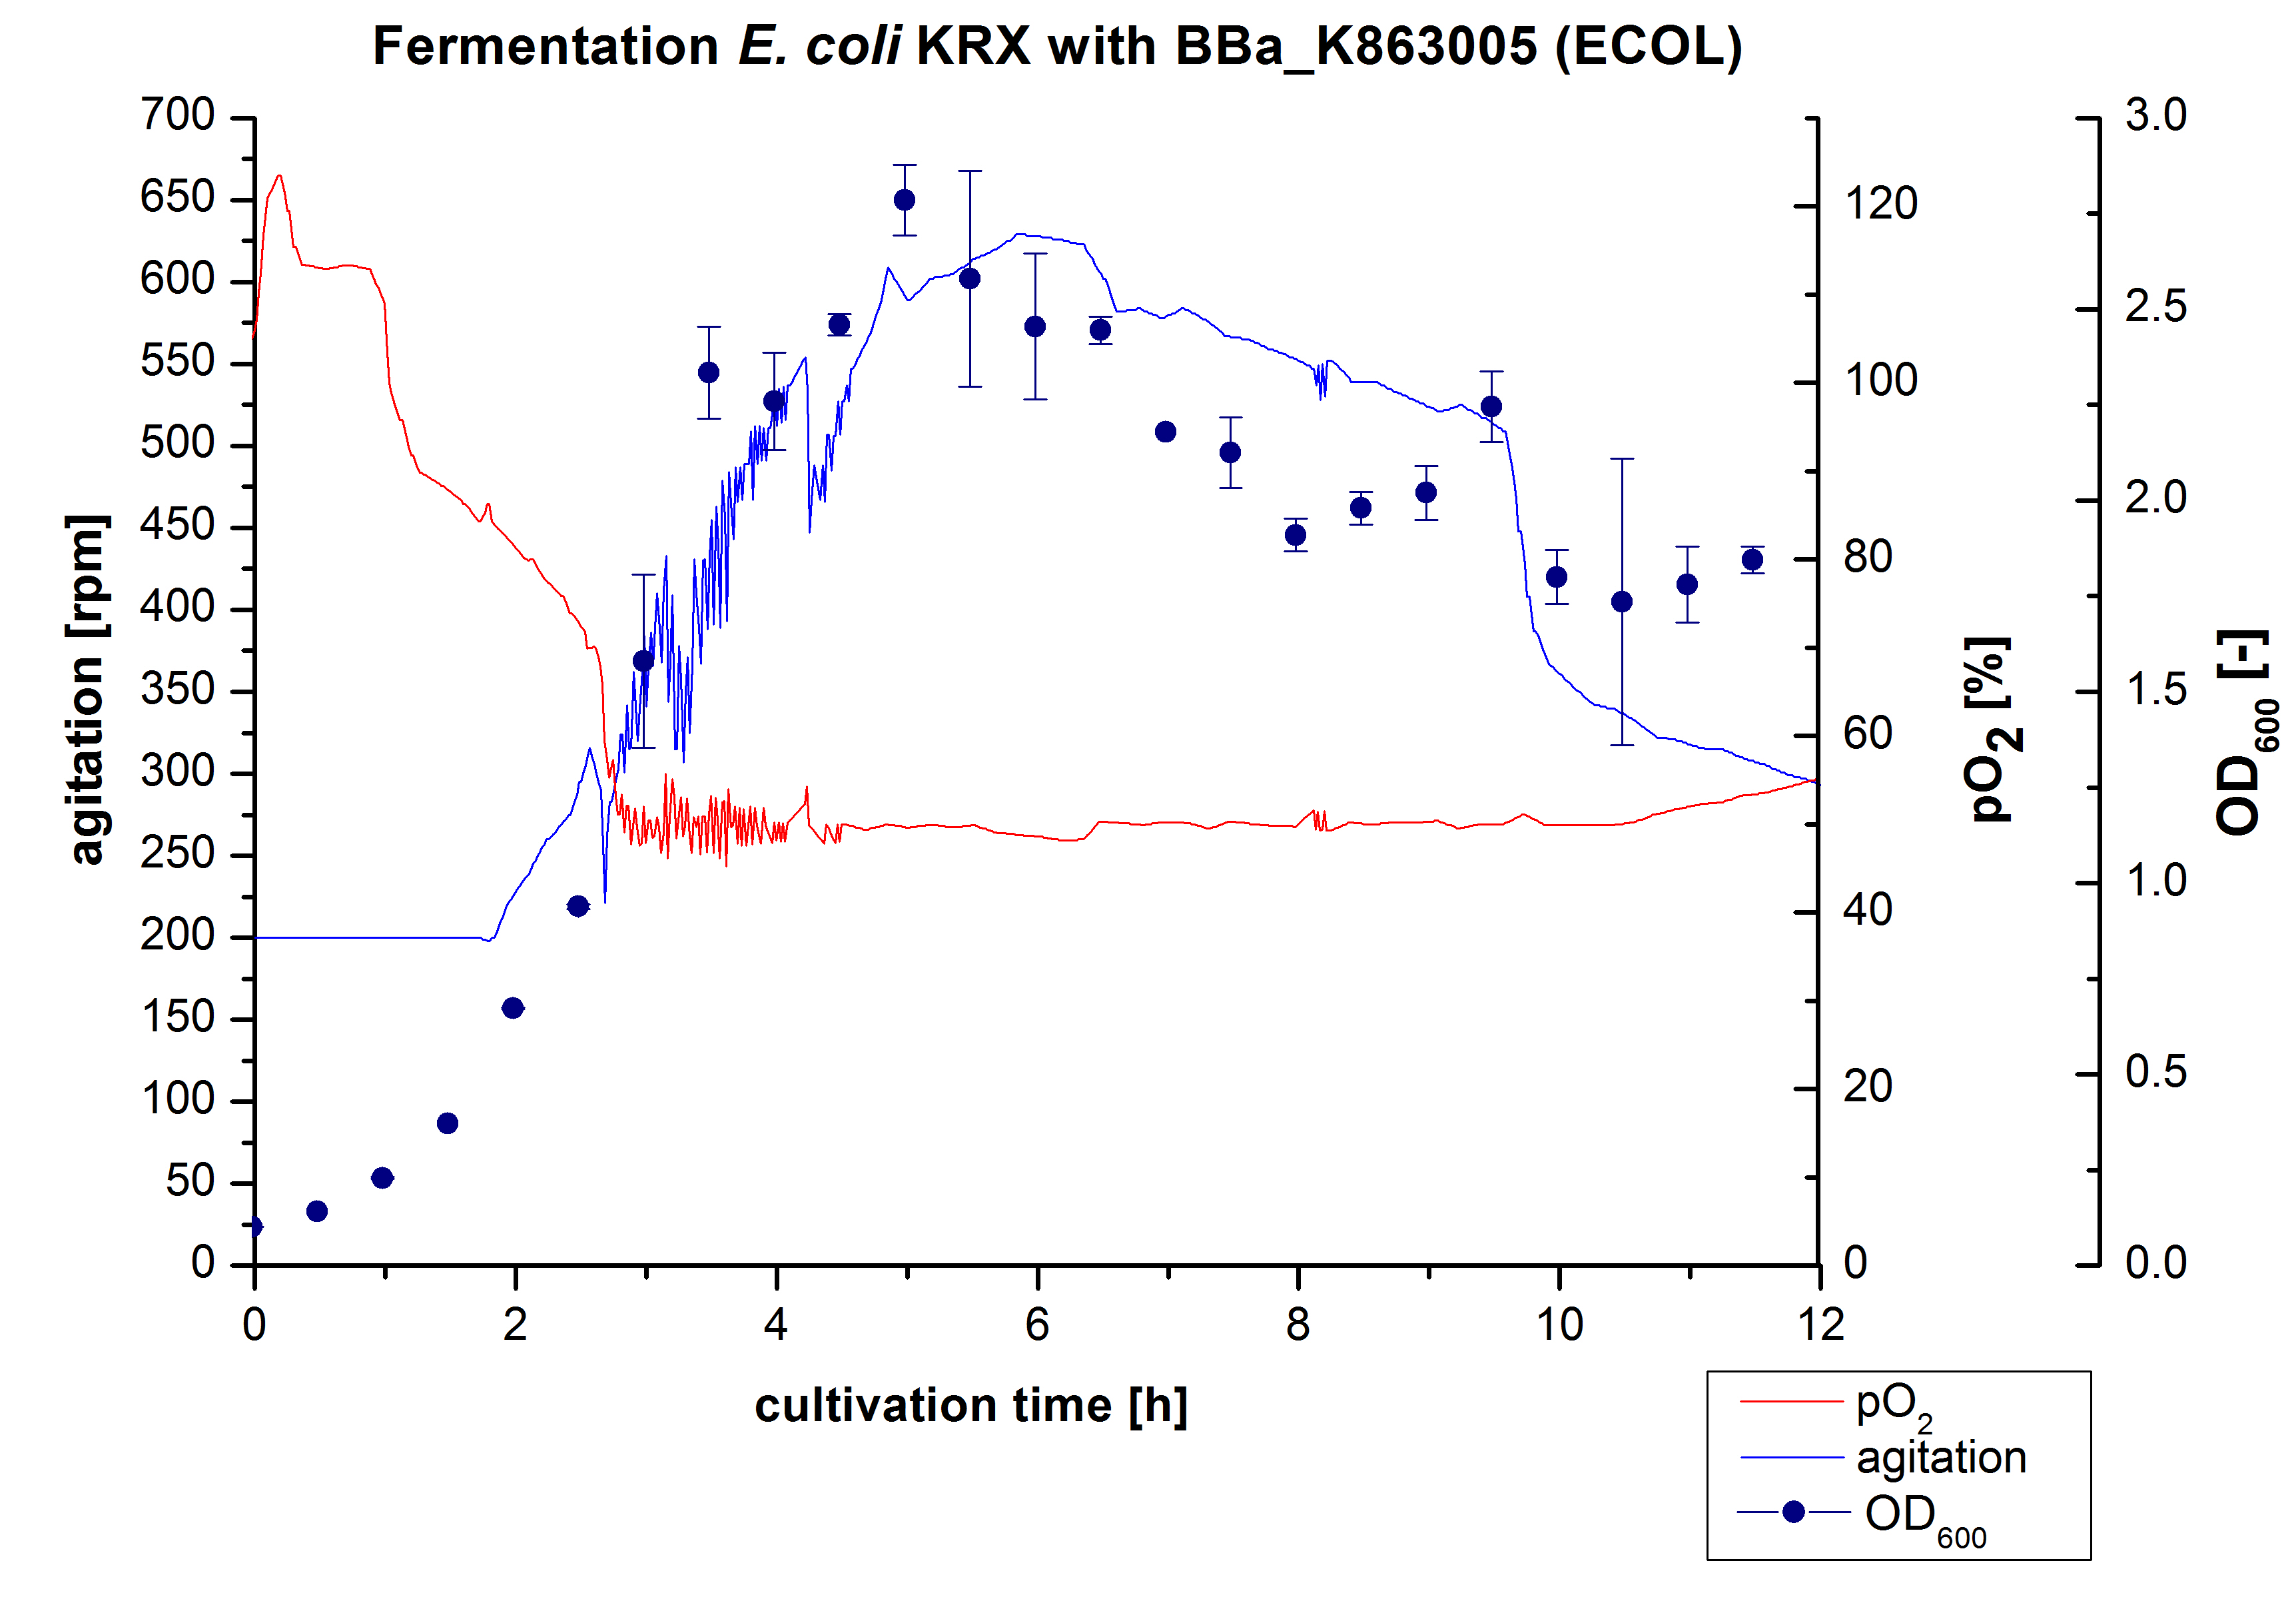
After the measurement of activity of ECOL we made a scale-up and fermented E. coli KRX with <partinfo>BBa_K863005</partinfo> in Infors Labfors with a total volume of 3 L. Agitation speed, pO2 and OD600 were determined and illustrated in Figure 1. The exponential phase started after 1.5 hours of cultivation. The cell growth caused a decrease in pO2. After 2 hours of cultivation the agitation speed increased up to 629 rmp (5.9 hours) to hold the minimal pO2 level of 50 %. Then, after 4 hours there was a break in cell growth due to induction of protein expression. The maximal OD600 of 2.78 was reached after 5 hours. In comparison to E. coli KRX (OD600,max =4.86 after 8.5 hours) and to E. coli KRX with <partinfo>BBa_K863000</partinfo> (OD600,max =3.53 after 10 hours, time shift due to long lag phase) the OD600 max is lower. In the following hours, the OD600,max and the agitation speed decreased and the pO2 increased, which indicates the death phase of the cells. This is caused by the celltoxicity of ECOL (reference: [http://www.dbu.de/OPAC/ab/DBU-Abschlussbericht-AZ-13191.pdf DBU final report]). Therefore they were harvested after 12 hours.
Purification of ECOL
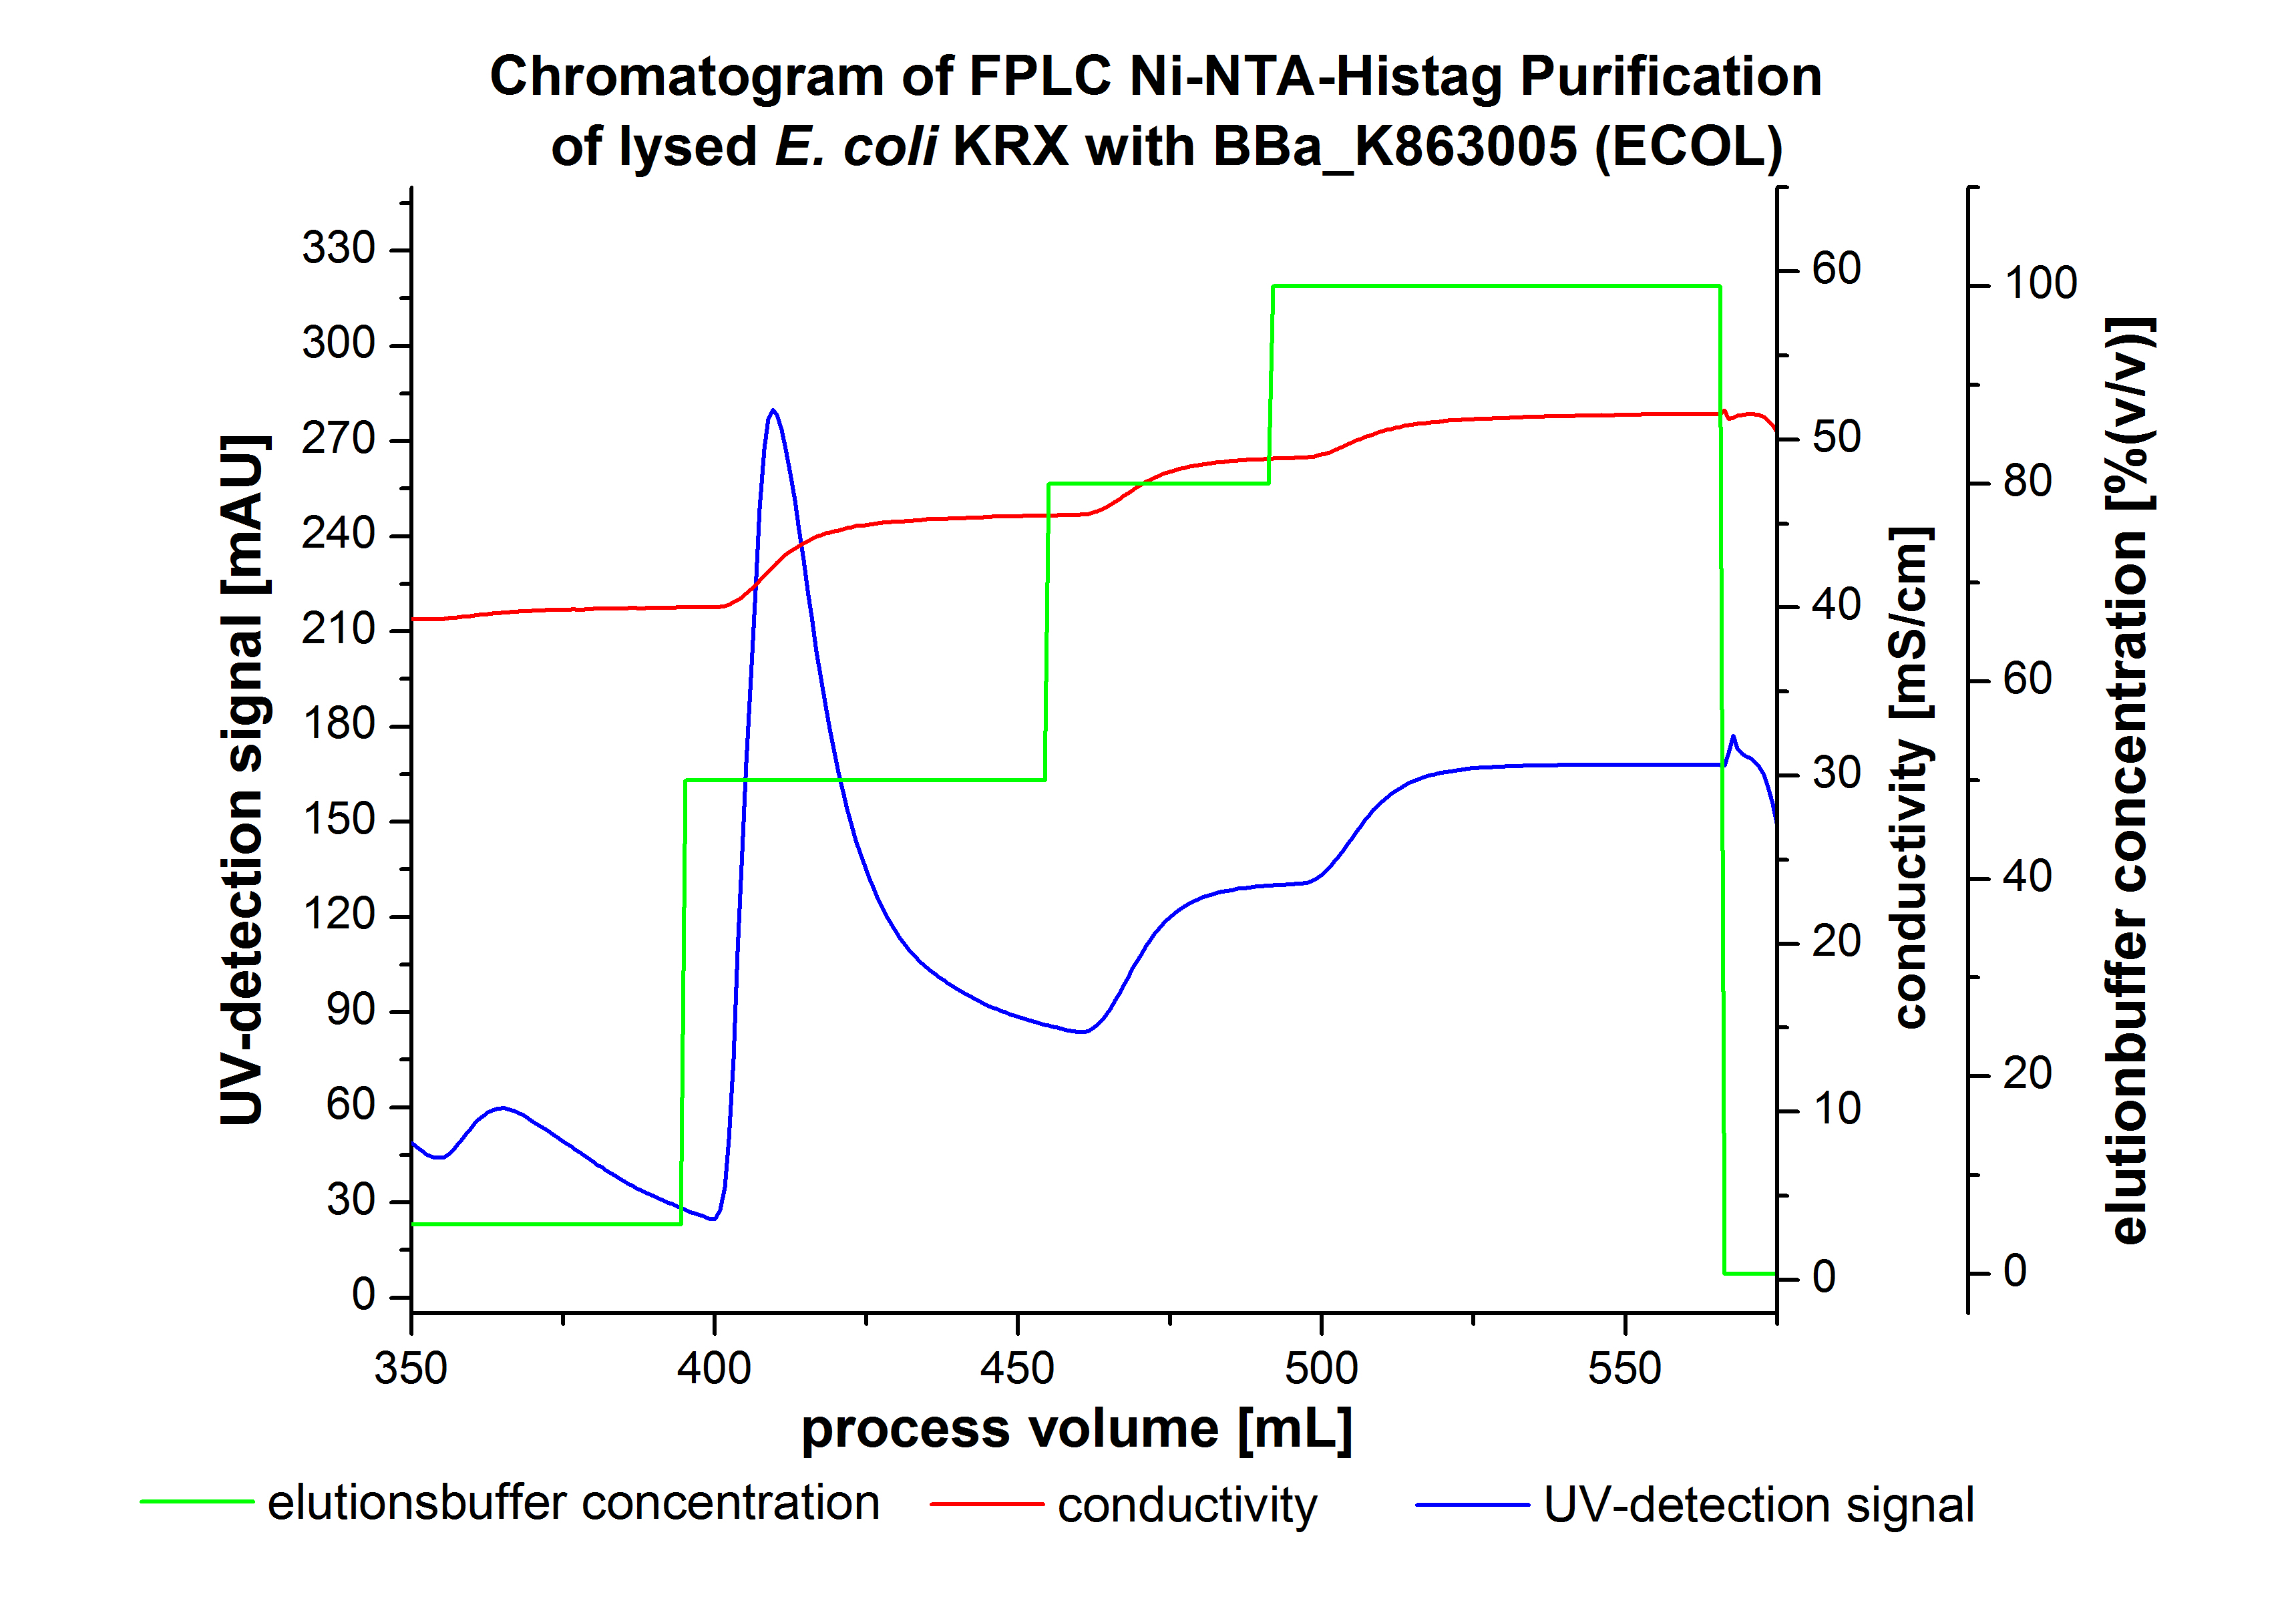
The harvested cells were resuspended in Ni-NTA-equilibrationbuffer, mechanically lysed by homogenization and centrifuged. The supernatant of the lysed cell paste was loaded on the Ni-NTA-column (15 mL Ni-NTA resin) with a flowrate of 1 mL min-1 cm-2. Then the column was washed by 10 column volumes (CV) with Ni-NTA-equilibrationbuffer. The bound proteins were eluted by an increasing Ni-NTA-elutionbuffer step elution from 5 % (equates to 25 mM imidazol) with a length of 60 mL, to 50 % (equates to 250 mM Imidazol) with a length of 60 mL, to 80 % (equates to 400 mM imidazol) with a length of 40 mL and finally to 100 % (equates to 500 mM imidazol) with a length of 80 mL. This strategies was chosen to improve the purification caused by a step by step increasing Ni-NTA-elutionbuffer concentration. The elution was collected in 10 mL fractions. Due to the high UV-detection signal of the loaded samples and to simplify the illustration of the detected product peak only the UV-detection signal of the wash step and the elution are shown. A typical chromatogram of purified laccases is illustrated here.The chromatogram of the ECOL-elution is shown in figure 2:
The chromatogram shows two remarkable peaks. The first peak was detected by a Ni-NTA-equilibrationbuffer concentration of 5 % (equates to 25 mM imidazol) and resulted from the elution of weakly bound proteins. After increasing the Ni-NTA-elutionbuffer concentration to 50 % (equates to 250 mM imidazol) a peak up to a UV-detection signal of 292 mAU was measured. The area of this peak indicates that a high amount of protein was eluted. The corresponding fractions were analysed by SDS-PAGE analysis to detect ECOL. There were no further peaks detectable. The following increasing UV-dectection-signals equates to the imidazol concentration of the Ni-NTA-elutionbuffer. The corresponding SDS-PAGES are shown in figure 3.
SDS-PAGE of ECOL purification
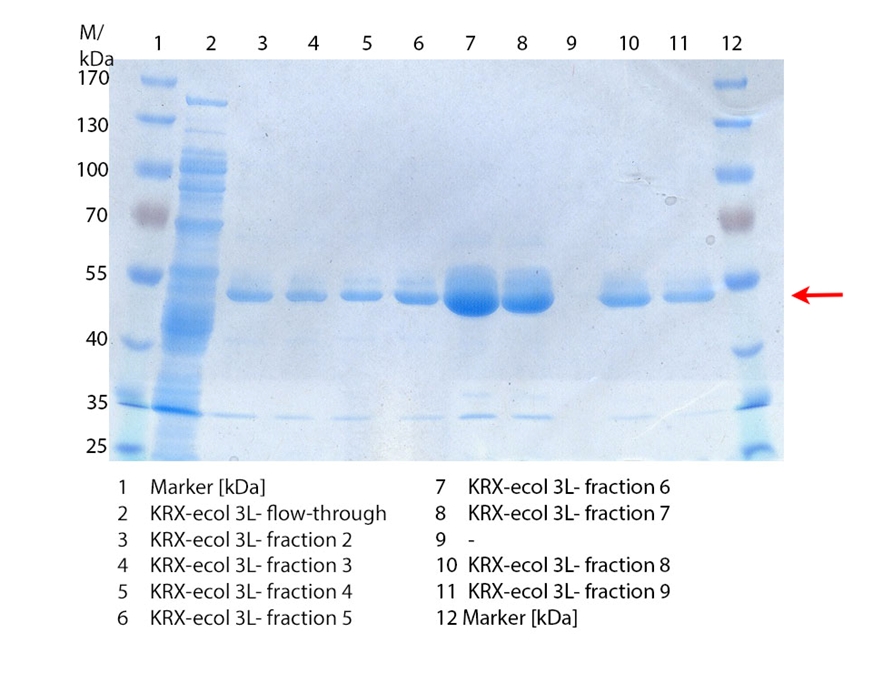
In figure 3 the SDS-PAGE of the Ni-NTA-Histag purification of the lysed culture ( E. coli KRX containing [http://partsregistry.org/wiki/index.php?title=Part:BBa_K863005 BBa_K863005]) is illustrated including the flow-through and the fractions 2 to 9. The red arrow indicates the band of ECOL with a molecular weight of 53.4 kDa, which appears in all fractions. The strongest bands appear in fractions 6 and 7. Another small band with a lower molecular weight appears, but was not identified.
Furthermore the bands were analysed by MALDI-TOF and identified as CueO (ECOL).
6 L Fermentation E. coli KRX with <partinfo>BBa_K863005</partinfo>
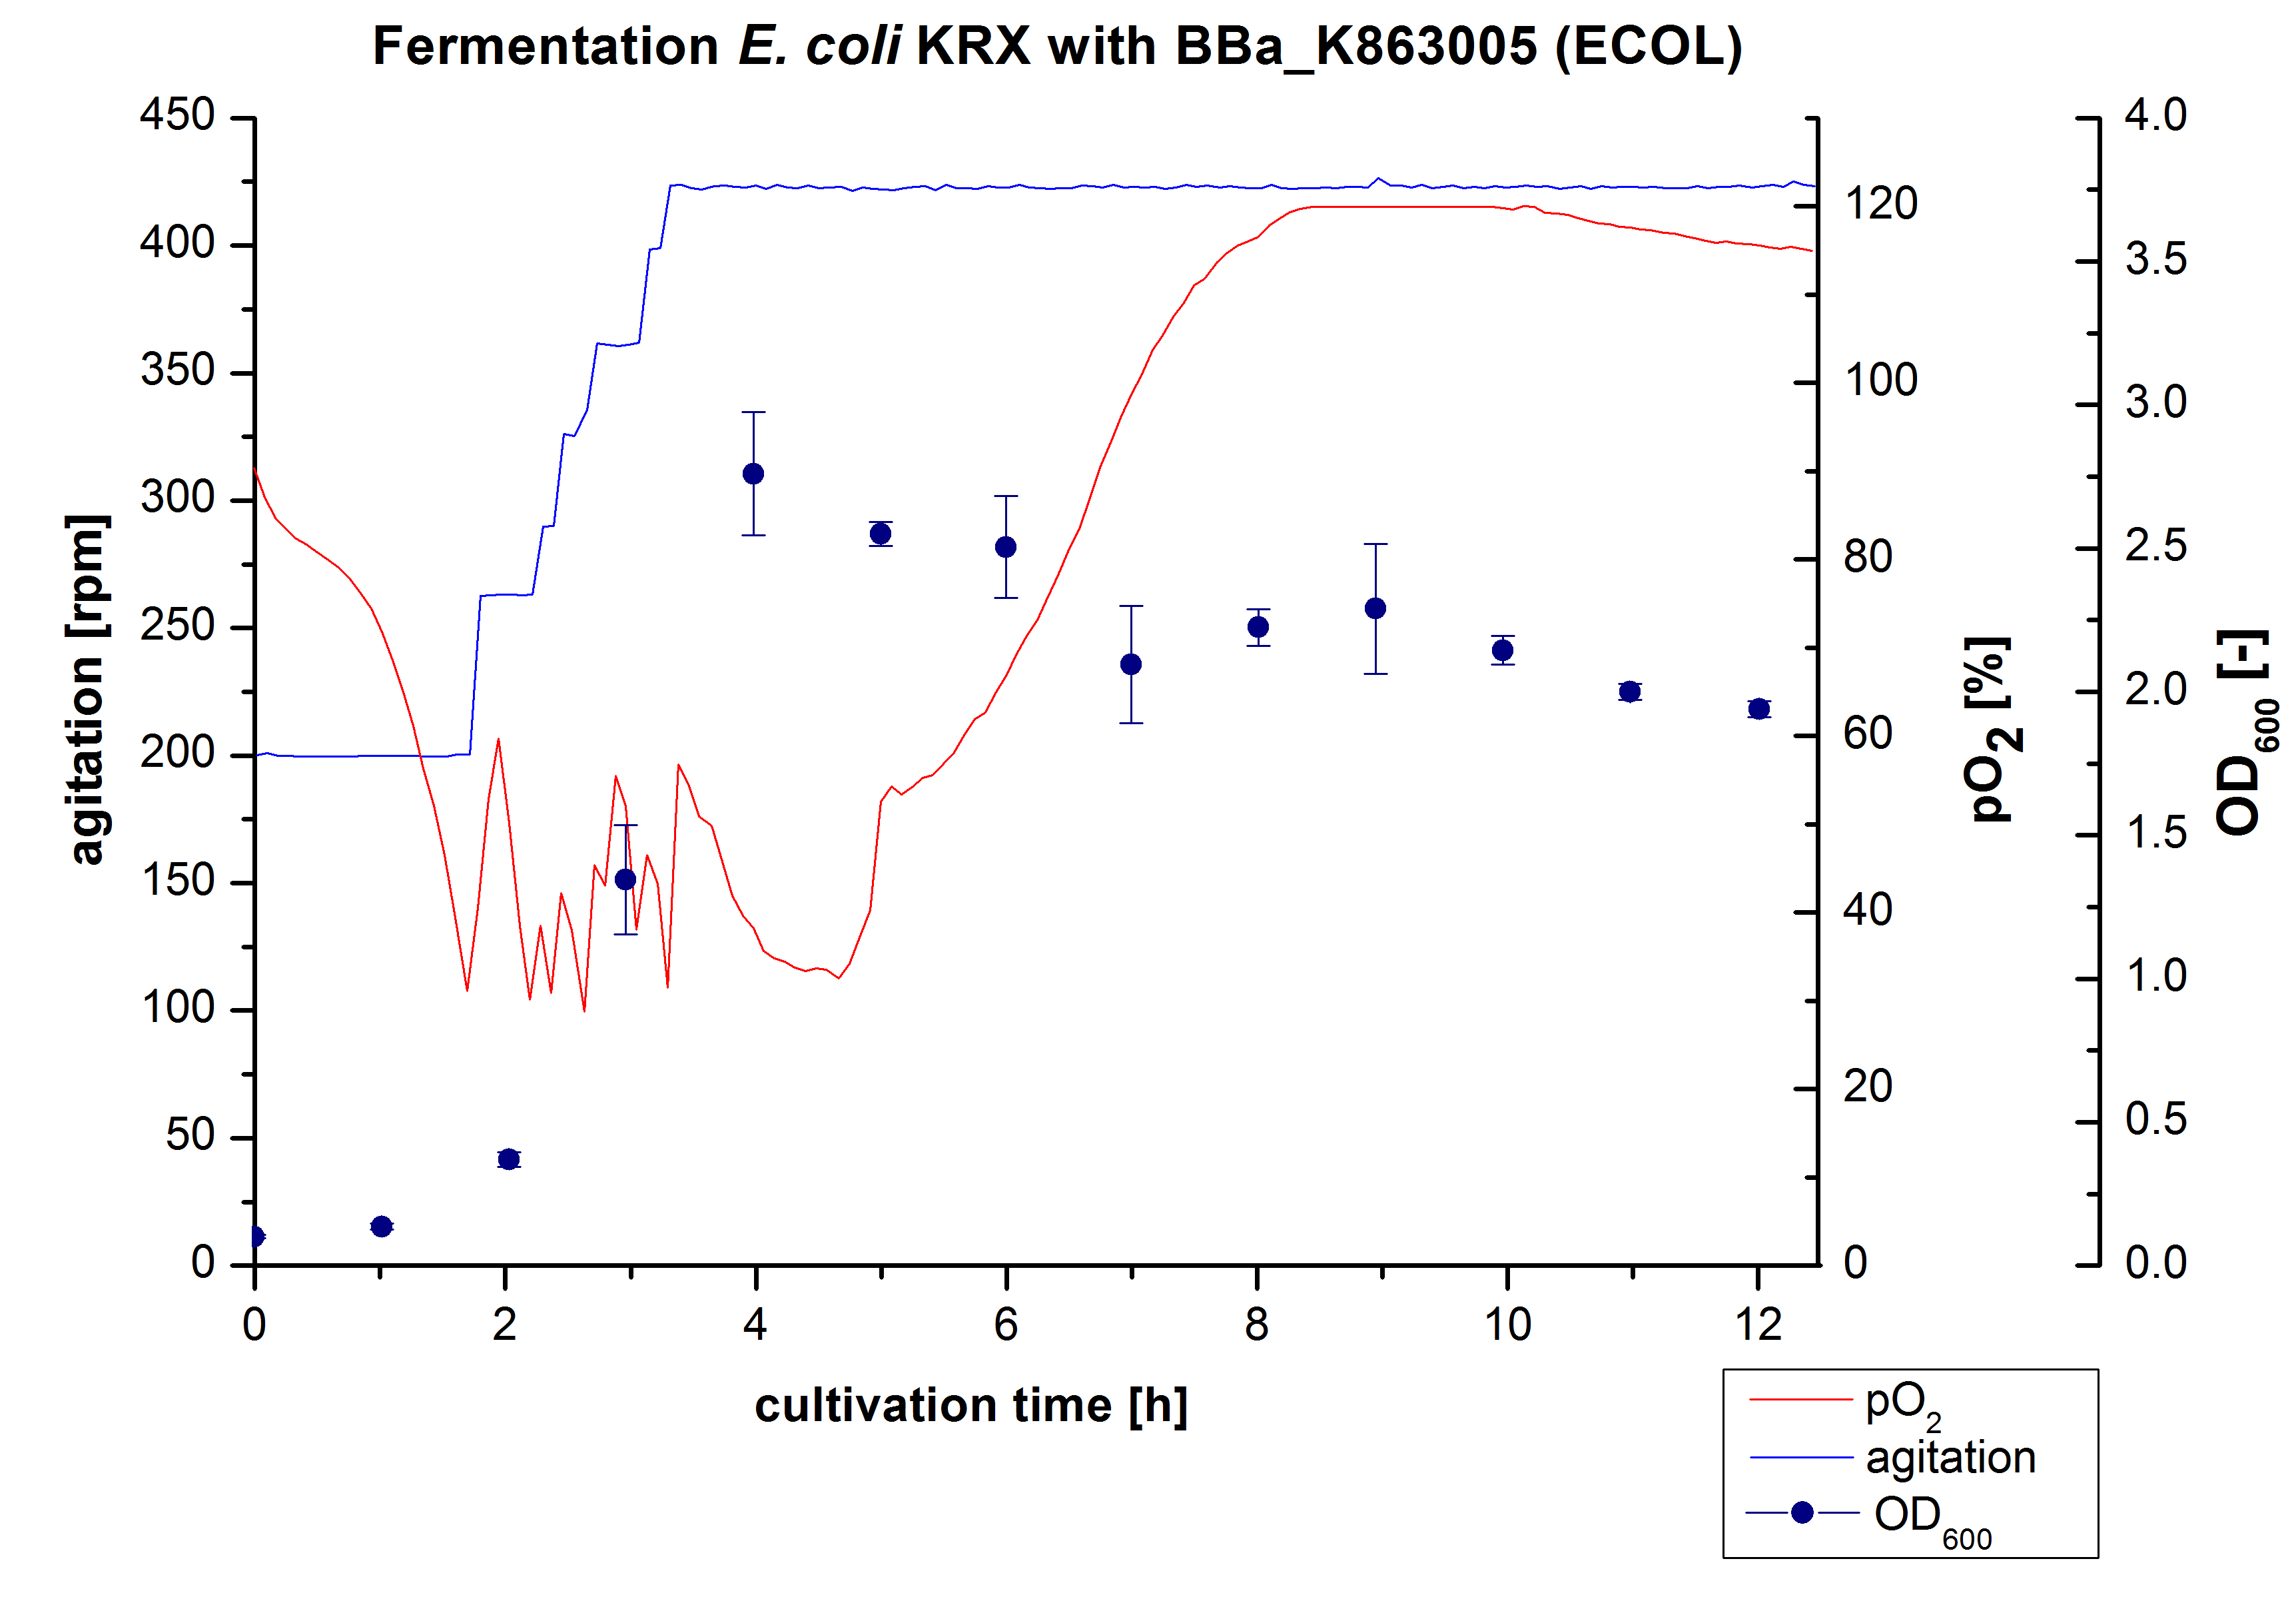
Another scale-up of the fermentation of E. coli KRX with <partinfo>BBa_K863005</partinfo> was made up to a final working volume of 6 L in Bioengineering NFL 22. Agitation speed, pO2 and OD600 were determined and illustrated in Figure 3. There was no noticeable lag phase and the cells immediatly began to grow. The cells were in an exponential phase between 2 and 4 hours of cultivation, which results in a decrease of pO2 value and therefore in an increase of agitation speed. After 4 hours of cultivation the maximal OD600 of 2.76 was reached, which is comparable to the 3 L fermentation of E. coli KRX with <partinfo>BBa_K863005</partinfo>. Due to induction of protein expression there is a break in cell growth. The death phase started, which is indicated by an increasing pO2 and a decreasing OD600. This demonstrates the cytotoxity of the laccases for E. coli, which was reported by the [http://www.dbu.de/OPAC/ab/DBU-Abschlussbericht-AZ-13191.pdf DBU]. In comparison to the fermentation of E. coli KRX with <partinfo>BBa_K863000</partinfo> under the same conditions (OD600,max= 3.53), the OD600,max was lower. Cells were harvested after 12 hours.
Purification of ECOL
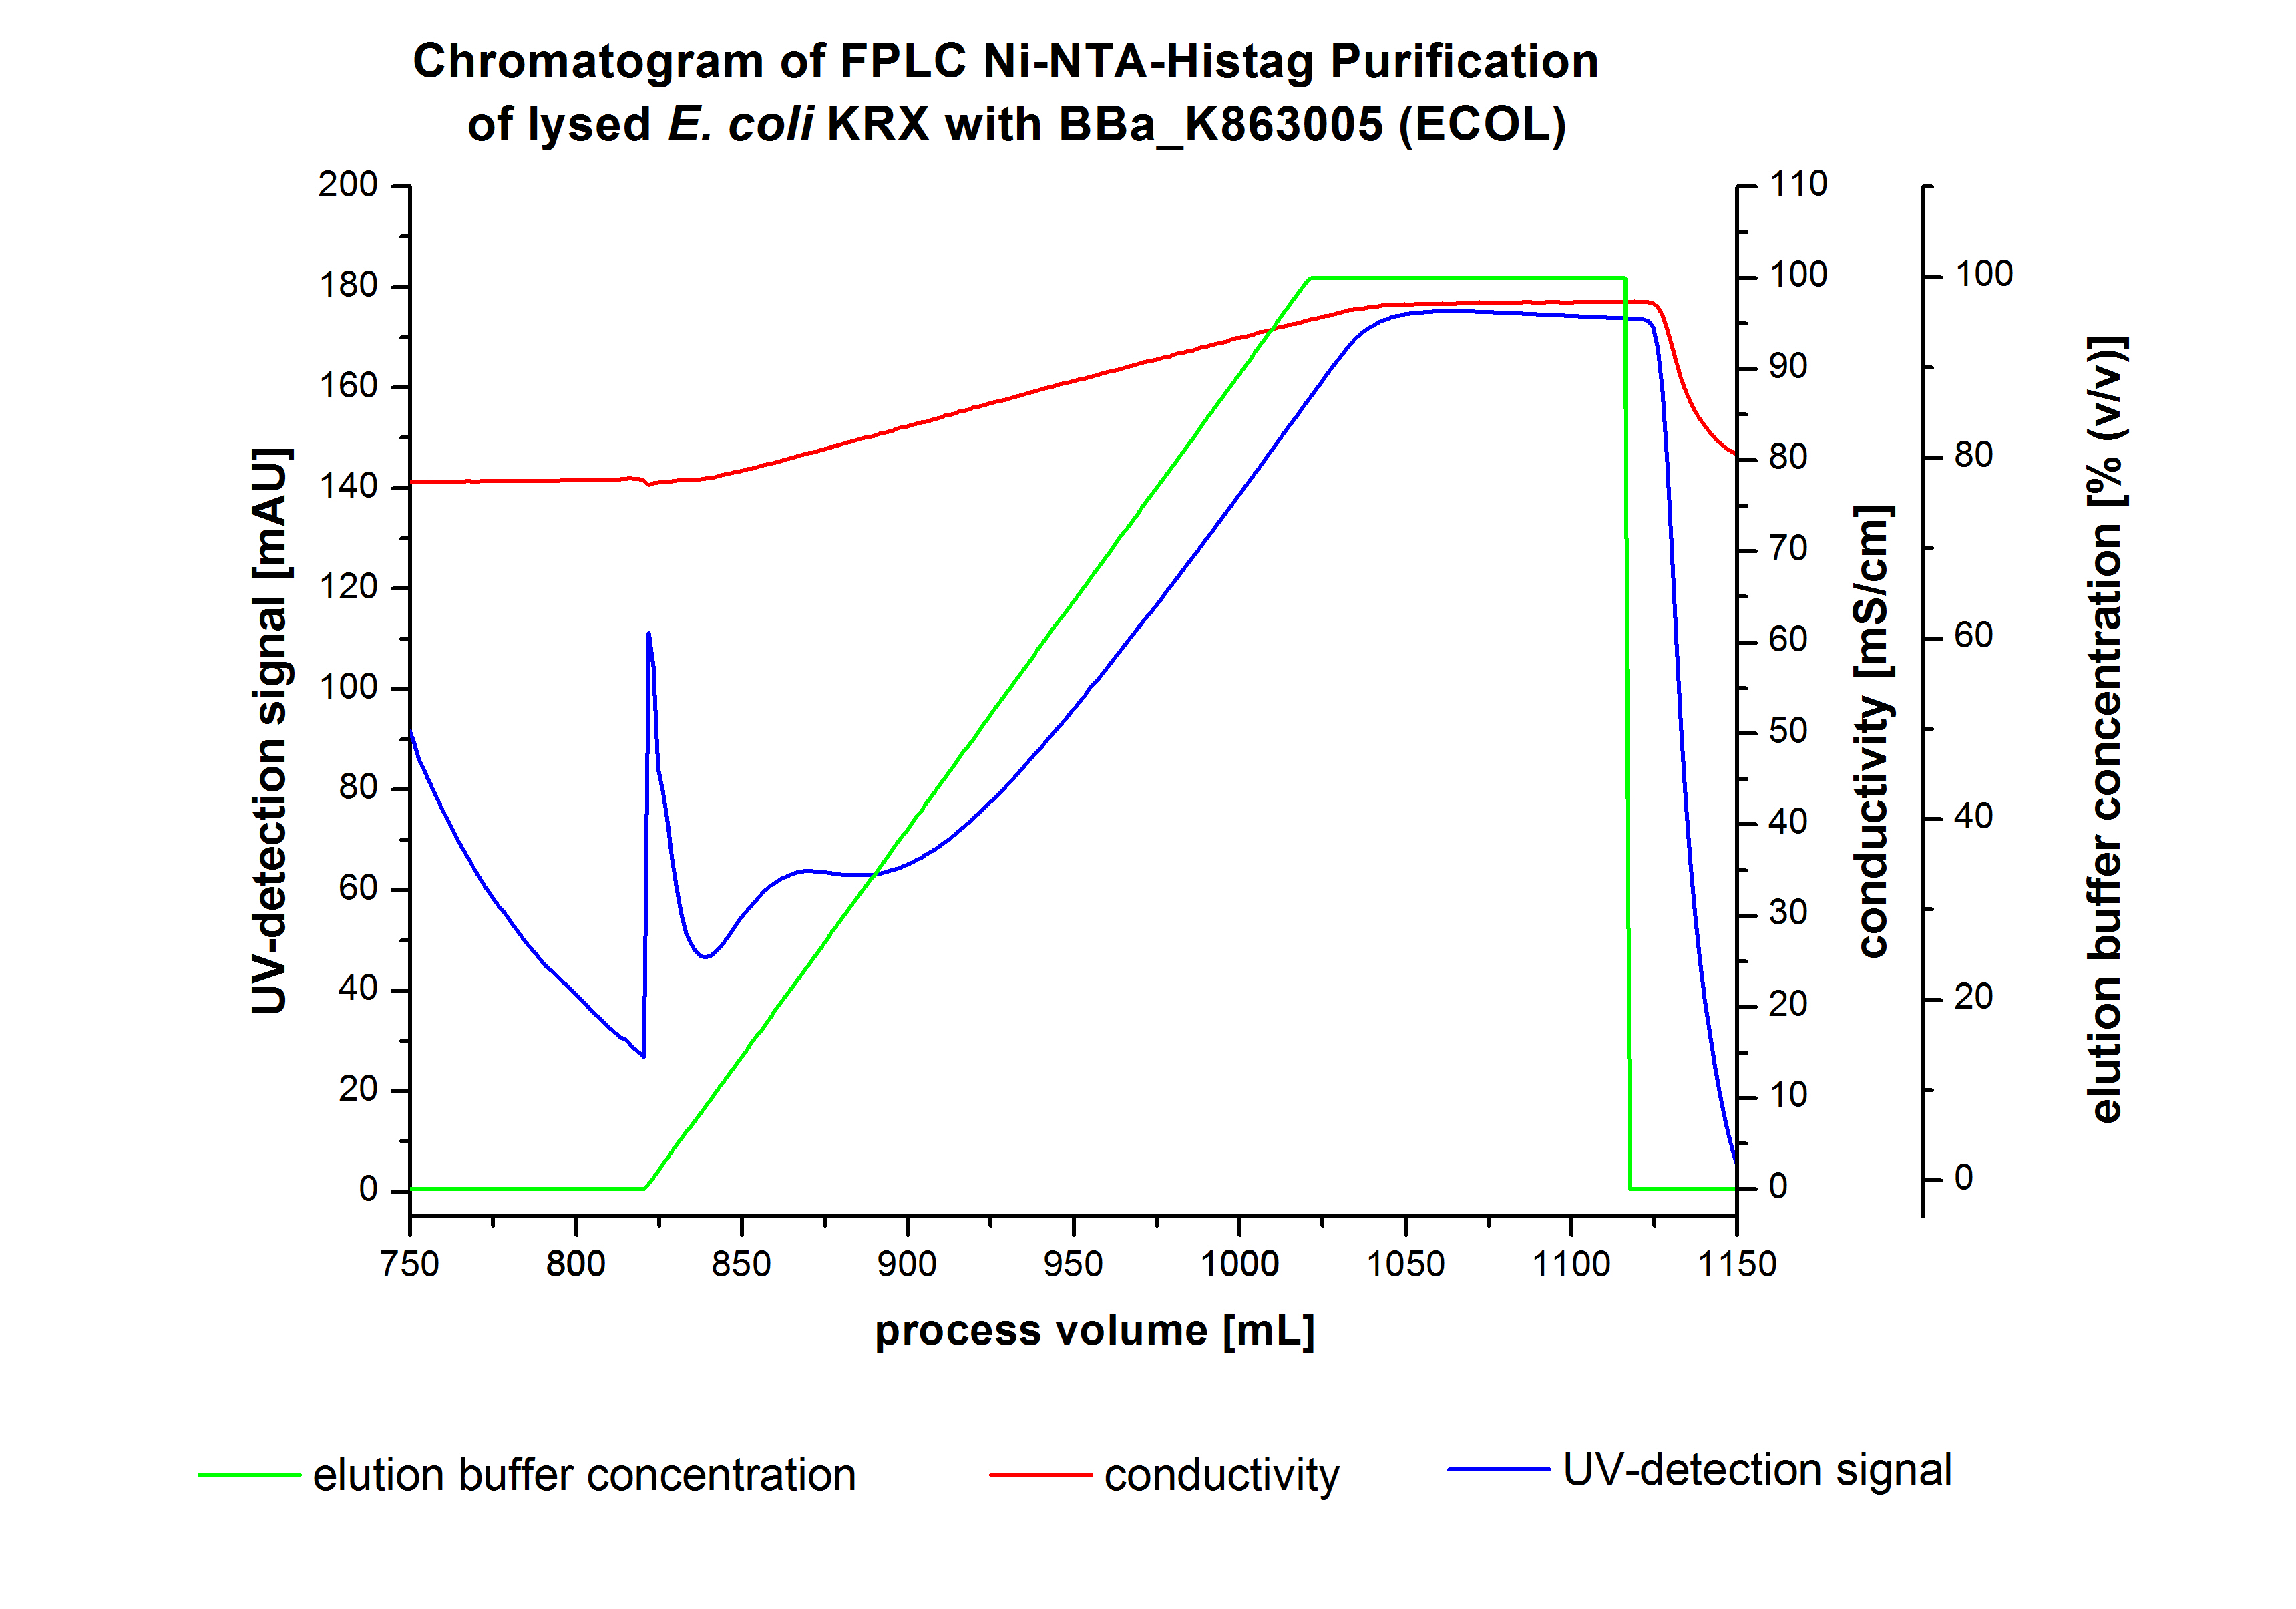
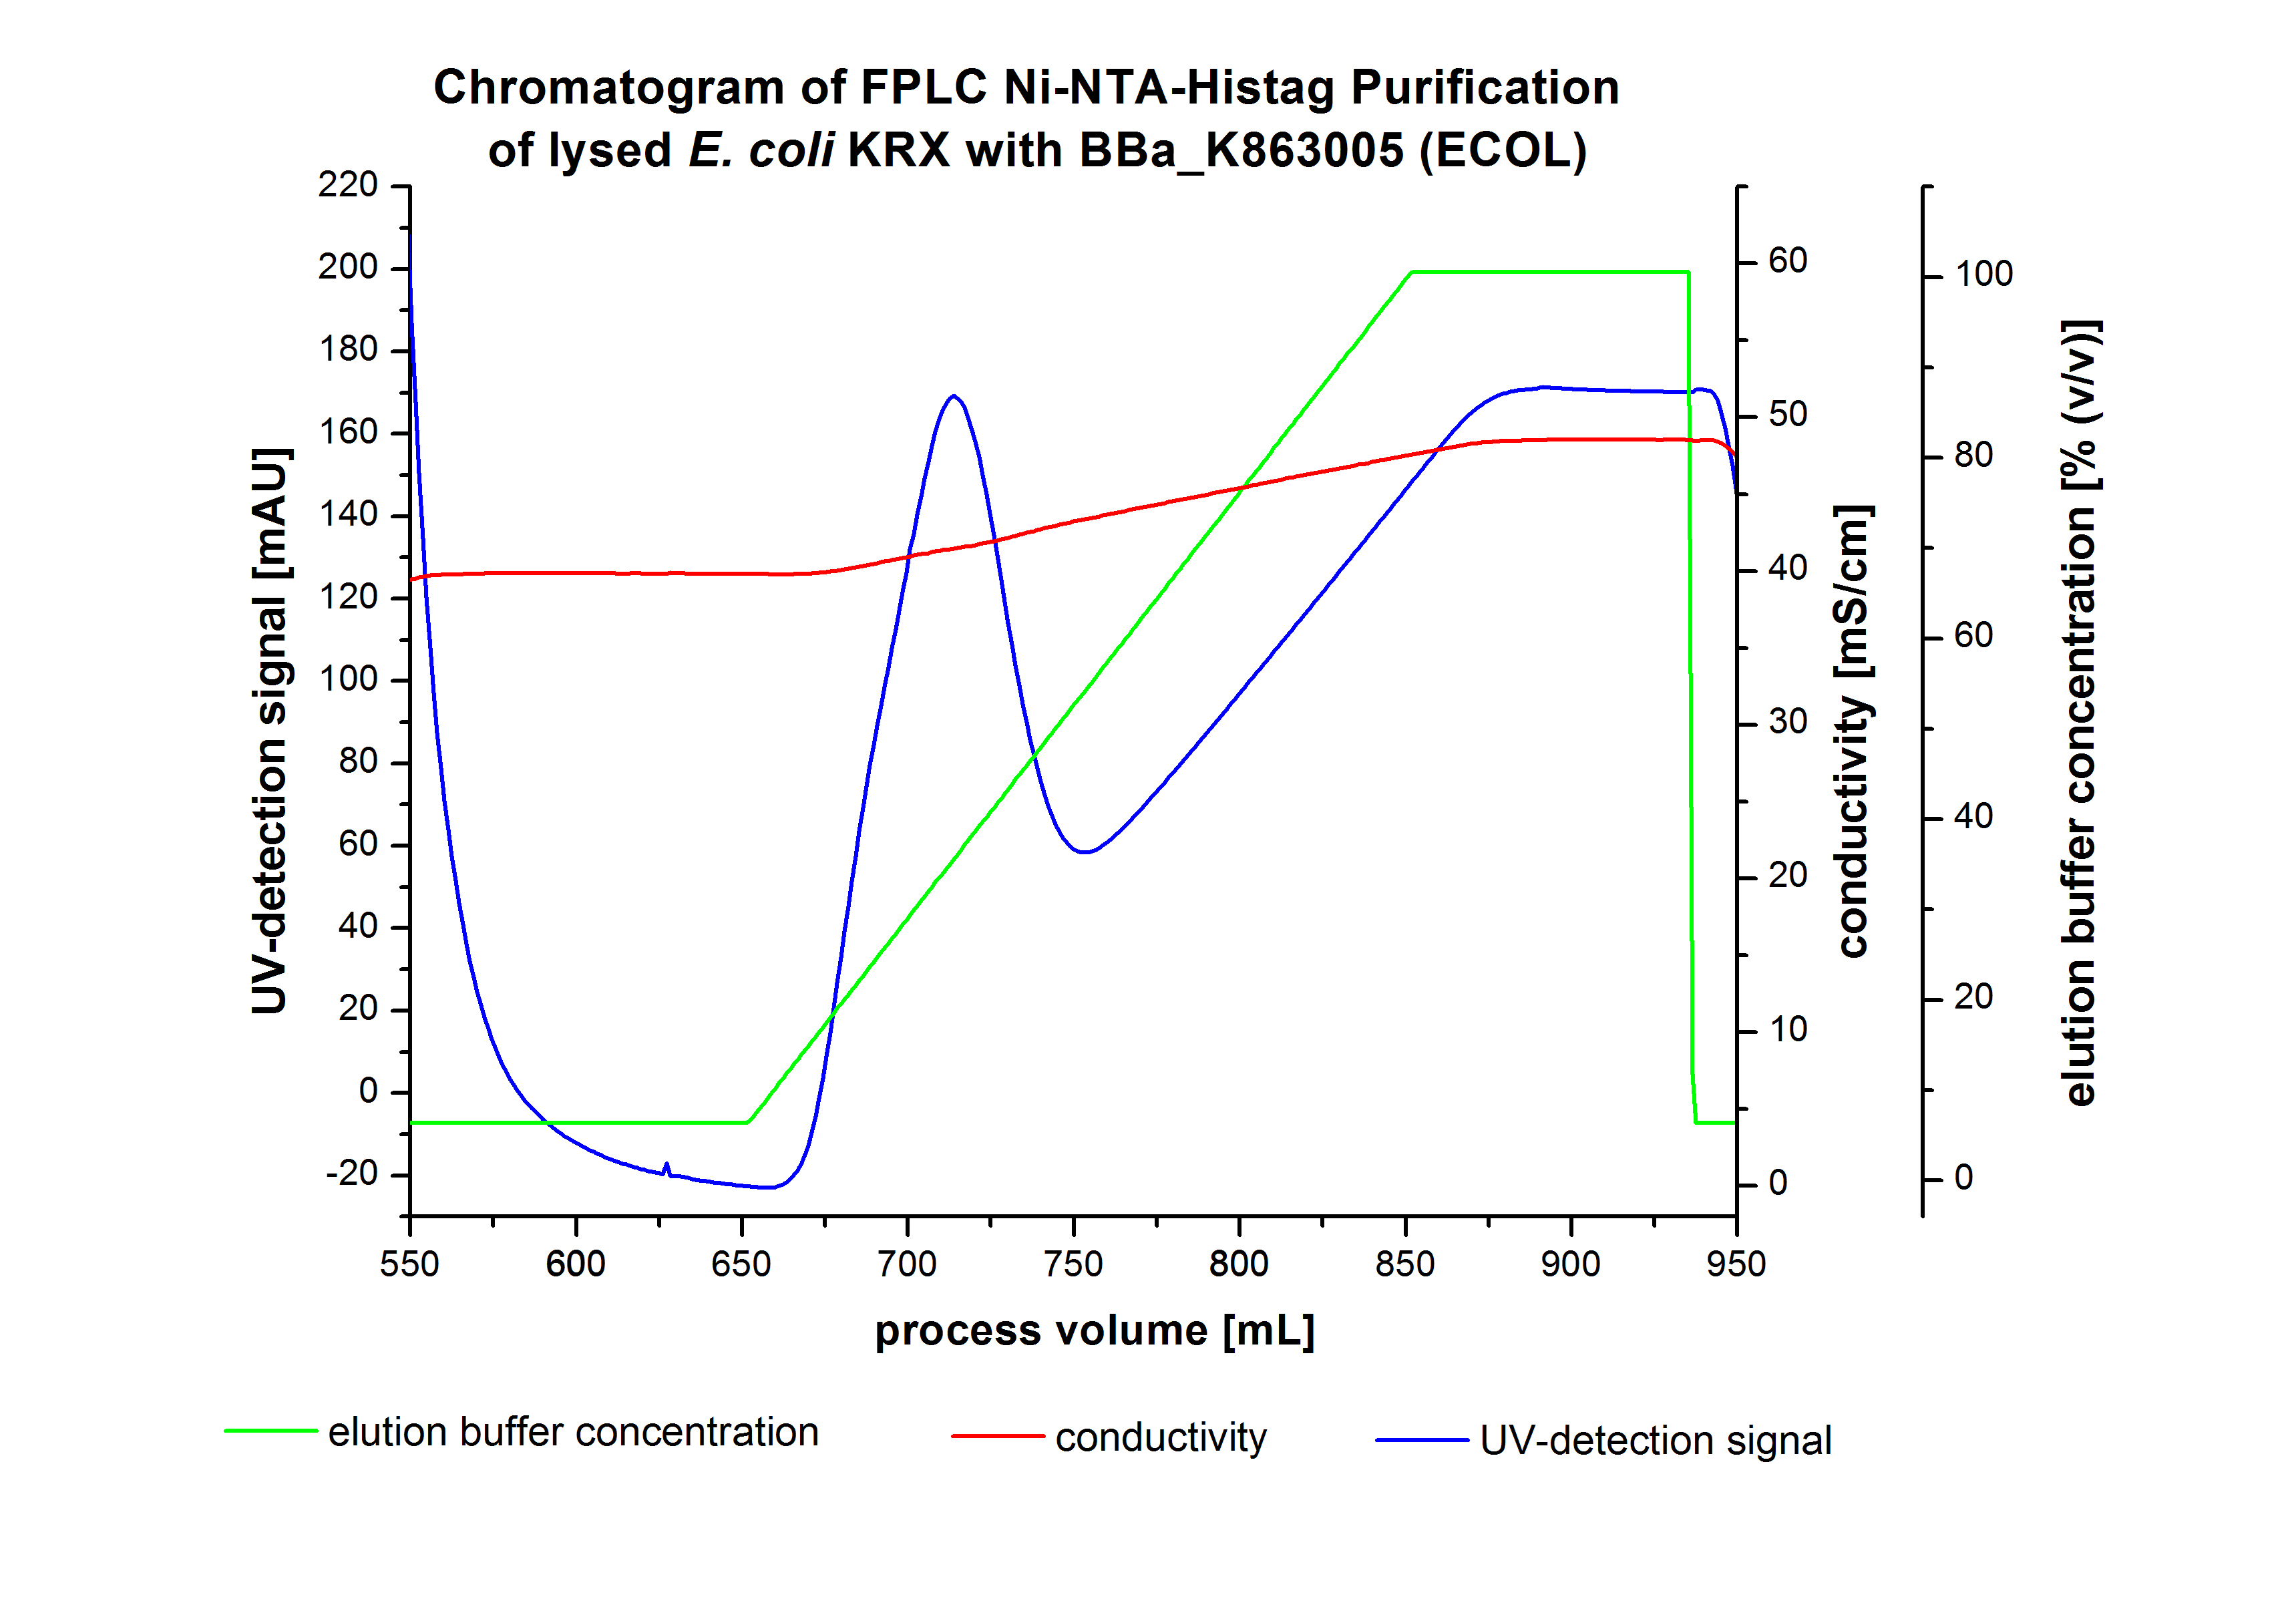
The harvested cells were resuspended in Ni-NTA-equilibrationbuffer, mechanically lysed by homogenization and centrifuged. The supernatant of the lysed cell paste was loaded on the Ni-NTA-column (15 mL Ni-NTA resin) with a flowrate of 1 mL min-1 cm-2. The column was washed by 10 column volumes (CV) with Ni-NTA-equilibrationbuffer. The bound proteins were eluted by an increasing Ni-NTA-elutionbuffer gradient from 0 % to 100 % with a length of 200 mL and the elution was collected in 10 mL fractions.Due to the high UV-detection signal of the loaded samples and to simplify the illustration of the detected product peak only the UV-detection signal of the wash step and the elution are shown. A typical chromatogram of purified laccases is illustrated here. The chromatogram of the ECOL-elution is shown in figure 4:
After washing the column with 10 CV Ni-NTA-elutionbuffer the elution process was started. At a process volume of 670 mL to 750 mL the chromatogram shows a remarkable widespread peak (UV-detection signal 189 mAU) caused by the elution of a high amount of proteins. The run of the curve show a fronting. This can be explained by the elution of weakly bound proteins, which elutes at low imidazol concentrations. A better result could be achieved with a step elution strategy (see purification of the 3 L Fermentation above). To detect ECOL the corresponding fractions were analysed by SDS-PAGE analysis.
SDS-PAGES of ECOL purification

In figure 6 the result of the Ni-NTA-Histag purification of the lysed culture E. coli KRX containing [http://partsregistry.org/wiki/index.php?title=Part:BBa_K863005 BBa_K863005] (6 L fermentation) including the flow-through, wash and the fractions 1 to 15 (except from fraction 11/12) is shown. The red arrow indicates the band of ECOL with a molecular weight of 53.4 kDa, which appears in all fractions. The strongest bands appear from fractions 3 and 8 with a decreasing amount of other non-specific bands.
Furthermore the bands were analysed by MALDI-TOF and identified as CueO (ECOL).
Activity Analysis of [http://partsregistry.org/wiki/index.php?title=Part:BBa_K863005 ECOL]
coming soon
Laccase Ltth from [http://www.dsmz.de/catalogues/details/culture/DSM-7039.html?tx_dsmzresources_pi5 Thermus thermophilus HB27]
First some trials of shaking flask cultivations were made with different parameters to define the best conditions for the production of the His-tagged laccase Ltth from [http://www.dsmz.de/catalogues/details/culture/DSM-7039.html?tx_dsmzreso Thermus thermophilus HB27] named TTHL. Because of no measured activity in the cell lysate a purification method was established (using Ni-NTA-Histag resin). Using E. coli KRX containing BioBrick <partinfo>BBa_K863010</partinfo> TTHL could not be detected by SDS-PAGE (molecular weight of 53 kDa) or by activity test. Therefore a new BioBrick <partinfo>BBa_K863012</partinfo> was constructed and expressed in E. coli Rosetta-Gami 2. With this expression system the TTHL could be detected by SDS-PAGE (molecular weight of 53 kDa). To prove the activity of the produced laccase we used a small scale Ni-NTA-column to purify it. The fractionated samples were tested concerning their activity. A maximal activity of X was reached. After measuring activity of TTHL a scale up was made up to 6 L.
Shaking Flask Cultivation
The first trials to produce the Ltth - laccase from [http://www.dsmz.de/catalogues/details/culture/DSM-7039.html?tx_dsmzresources_pi5 Thermo thermophilus HB27] (named TTHL) were produced in shaking flask with various designs (from 100 mL-1 to 1 L flasks, with and without baffles) and under different conditions. The used BioBrick was <partinfo>BBa_K863010</partinfo>. The changed parameters during the screening experiments were temperature (27 °C,30 °C and 37 °C), concentrations of chloramphenicol (20-170 µg mL-1), induction strategies (autoinduction and manual induction with 0,1 % rhamnose) and cultivation times (6 to 24 h). Furthermore it was cultivated with and without 0,25 mM CuCl2 to provide a sufficient amount of copper, which is needed for the active center of the laccase. Under the screened conditions it was not able to produce active TTHL, therefore another BioBrick was constructed and another chassi was chosen. For further cultivations the BioBrick <partinfo>BBa_K863012</partinfo> was used, which has a constitutive promoter insteat of the T7 promoter system. Additionally the strain E. coli Rosetta-Gami 2 was used, because of its ability to translate rare codons. TTHL was produced under the following conditions:
- flask design: shaking flask without baffles
- medium: LB-Medium
- antibiotics: 60 µg mL-1 chloramphenicol and 300 µg mL-1 ampicillin
- temperature: 37 °C
- cultivation time: 24 h
The reproducibility and repeatability of the measured data and results were investigated for the shaking flask cultivation, but not yet for the bioreactor cultivation.
Fermentation of E. coli KRX with <partinfo>BBa_K863012</partinfo>
After measuring activity of TTHL we made a scale-up and fermented E. coli Rosetta-Gami 2 with <partinfo>BBa_K863000</partinfo> in a Bioengineering NFL22 with a total volume of 6 L. Agitation speed, pO2 and OD600 were determined and illustrated in Figure 1. There is no noticeable lag phase. Caused by the cell growth, the pO2 decreased up to a value of 0 %, because the breakdown of the control unit. After a cultivation time of 9 hours the agitation speed was increased manually up to a 500 rpm, which resulted in a higher pO2 value of more than 100 % for the rest of the cultivation. During the whole process the OD600 increased slowly in comparison to the fermentation of E. coli KRX with <partinfo>BBa_K863000</partinfo> or <partinfo>BBa_K863005</partinfo>. The maximal OD600 was reached after 19 hours of cultivation, when the cells were harvested.

Purification of TTHL
The cells were harvested and resuspended in Ni-NTA-equilibrationbuffer, mechanically lysed by homogenization and centrifuged. After preparing the cell paste the TTHL could not be purificate with the 15 mL column, because of its damage. For this reason a small scale purification (6 mL) of the supernatant of the lysate was made with a 1 mL Ni-NTA-column.
SDS-PAGE of purification TTHL
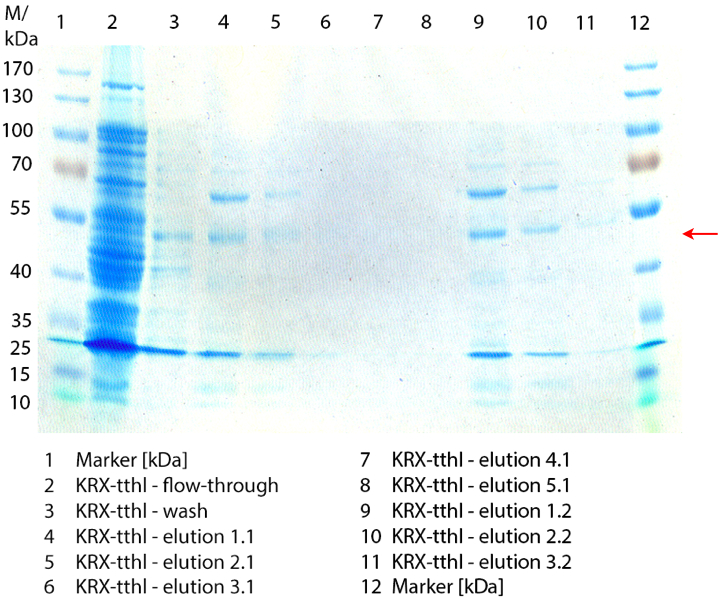
Figure 2 shows the SDS-PAGE of the purified E. coli Rosetta-Gami 2 lysates fermented in 6 L Bioengineering NFL22 including the flow-through, wash and all elution fractions (1 to 5). TTHL has a molecular weight of 53 kDa and the corresponding band was marked with a red arrow. The TTHL band appears in fractions 1 to 3, but not in the other two elution fractions. Furthermore there are some other non-specific bands, which could not be identified. To improve the purification the 15 mL column and ÄKTA method could be used.
Activity Analysis of [http://partsregistry.org/wiki/index.php?title=Part:BBa_K863012 TTHL]
coming soon
Laccase Lbh1 from [http://www.dsmz.de/catalogues/details/culture/DSM-18197.html?tx_dsmzresources_pi5 Bacillus halodurans C-125]
First some trials of shaking flask cultivations were made with various parameters to identify the best conditions for the production of the His-tagged laccase Lbh1 from [http://www.dsmz.de/catalogues/details/culture/DSM-18197.html?tx_dsmzresources_pi5 Bacillus halodurans C-125 ] named BHAL. Because of no measured activity in the cell lysate a purification method was established (using Ni-NTA-Histag resin). BHAL could not be detected by SDS-PAGE (theoretical molecular weight of 56 kDa) or activity test by using the BioBrick <partinfo>BBa_K863020</partinfo> and E. coli KRX as expression system. Due to this results the new BioBrick <partinfo>BBa_K863022</partinfo> was constructed and expressed E. coli Rossetta-Gami 2. With this expression system the laccase could be produced and analysed via SDS-PAGE. To prove the activity of the produced laccase we used a small scale Ni-NTA-column to purify our laccase. The fractionated samples were tested concerning their activity. A maximal activity of X was reached. A scale up was not yet performed.
Cultivation
The first trials to produce the Lbh1 - laccase from Bacillus Halodurans (named BHAL) were produced in shaking flask with various designs (from 100 mL-1 to 1 L flasks, with and without baffles) and under several conditions. The parameters we have changed during our screening experiments were temperature (27 °C,30 °C and 37 °C), concentrations of chloramphenicol (20-170 µg mL-1), induction strategies (autoinduction and manual induction with 0,1 % rhamnose) and cultivation times (6 to 24 h). Furthermore it was cultivated with and without 0,25 mM CuCl2 to provide a sufficient amount of copper, which is needed for the active center of the laccase. Under the screened conditions it was not able to produce active BHAL, therefore another chassi was chosen. For further cultivations E. coli Rosetta-Gami 2 was transformed with BBa_K863012, because of its ability to translate rare codons. BHAL was produced under the following conditions:
- flask design: shaking flask without baffles
- medium: LB-Medium
- antibiotics: 60 µg mL-1 chloramphenicol and 300 µg mL-1 ampicillin
- temperature: 37 °C
- cultivation time: 24 h
Just a small scale cultivation was performed so far.
Purification
The cells were harvested and resuspended in Ni-NTA-equilibrationbuffer, mechanically lysed by sonification and centrifuged. After preparing the cell paste the BHAL could not be purificate with the 15 mL column, because of its damage. For this reason a small scale purification (6 mL) of the supernatant of the lysate was made with a 1 mL Ni-NTA-column. The elution was collected in 1 mL fractions.
SDS-PAGE
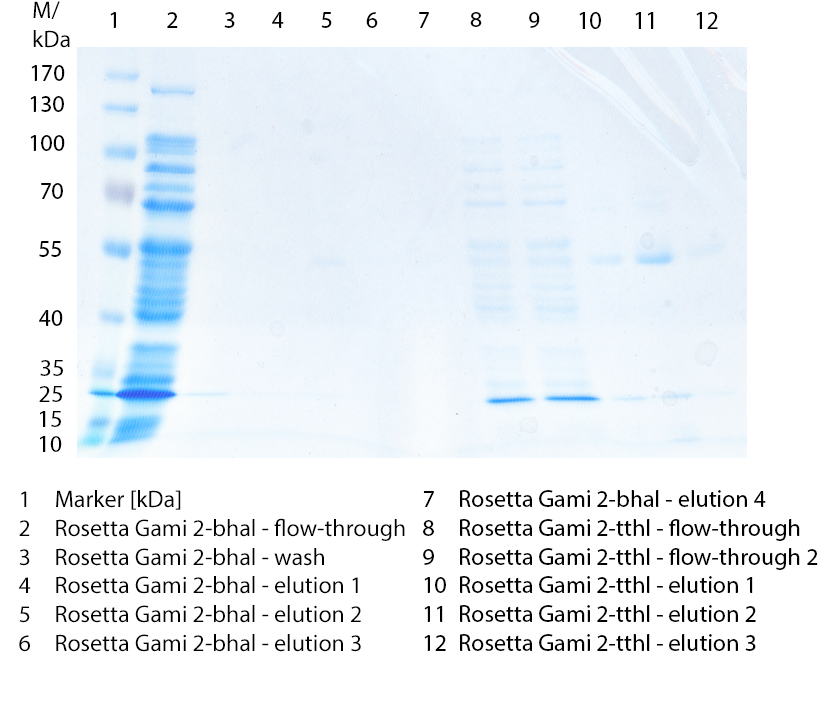
In figure 1 the different fractions of the purified cell lysate of E. coli Rosetta-Gami 2 with <partinfo>BBa_K863022</partinfo> are shown in a SDS-PAGE. BHAL has a molecular weight of 56 kDa. In lane 5, which corresponds to the elution fraction 2, a light band of 56 kDa is visible. Therefore the fractions were further analysed by activity test and MALDI-TOF.
Activity Analysis of [http://partsregistry.org/wiki/index.php?title=Part:BBa_K863022 BHAL]
coming soon
Laccase from Trametes versicolor
TVEL0 Activity Tests
[http://www.sigmaaldrich.com/catalog/product/sigma/51639?lang=de®ion=DE TVEL0] was characterized in terms of its activity to establish activity test protocols and to create a standard which can be used as a reference.
Immobilization
Introduction
Immobilization on silica dioxide beads
Immobilization on CPC-beads
Improvement of bead concentration and incubation time
Immobilization behavior
Enzyme activity of immobilized Lacasses
Literature
Subtrate Analytics
Liquid chromatography–mass spectrometry
Dilution series
We have detected our limit of detection by making some calibration curves. The limit were for the hormonal subtrates 10µg/L and we used this information for the other substrates.
Degradation results
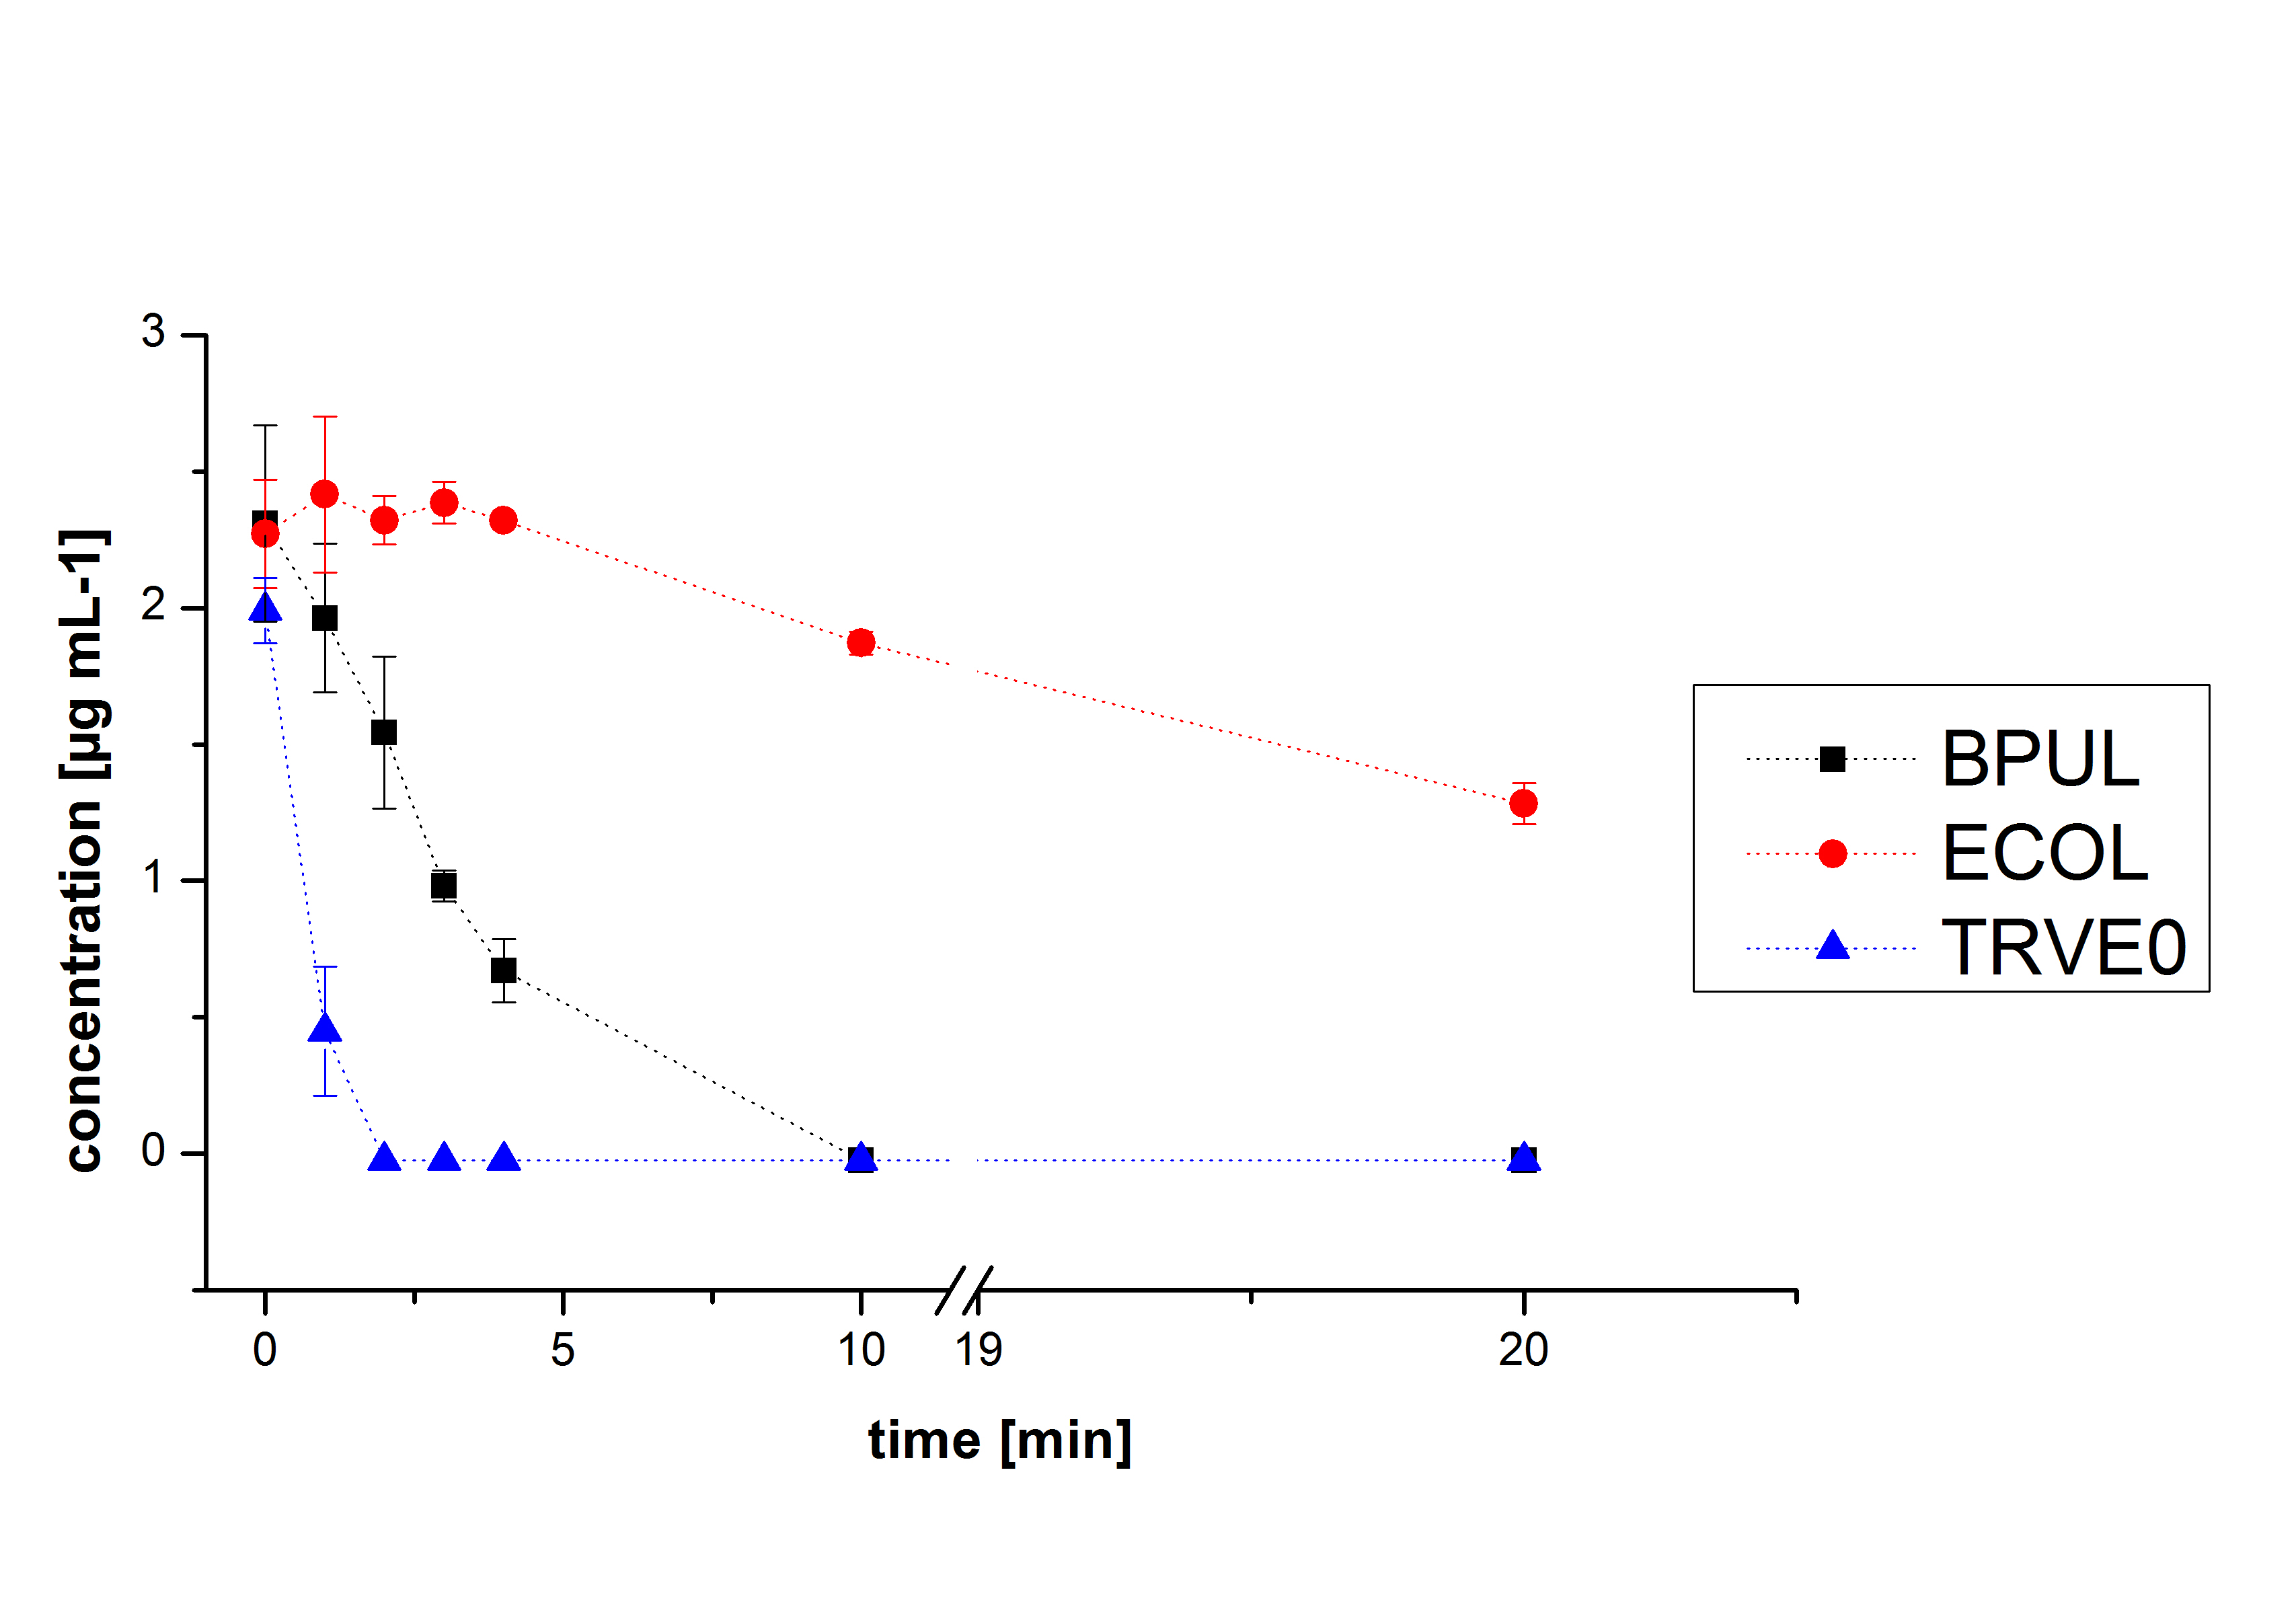
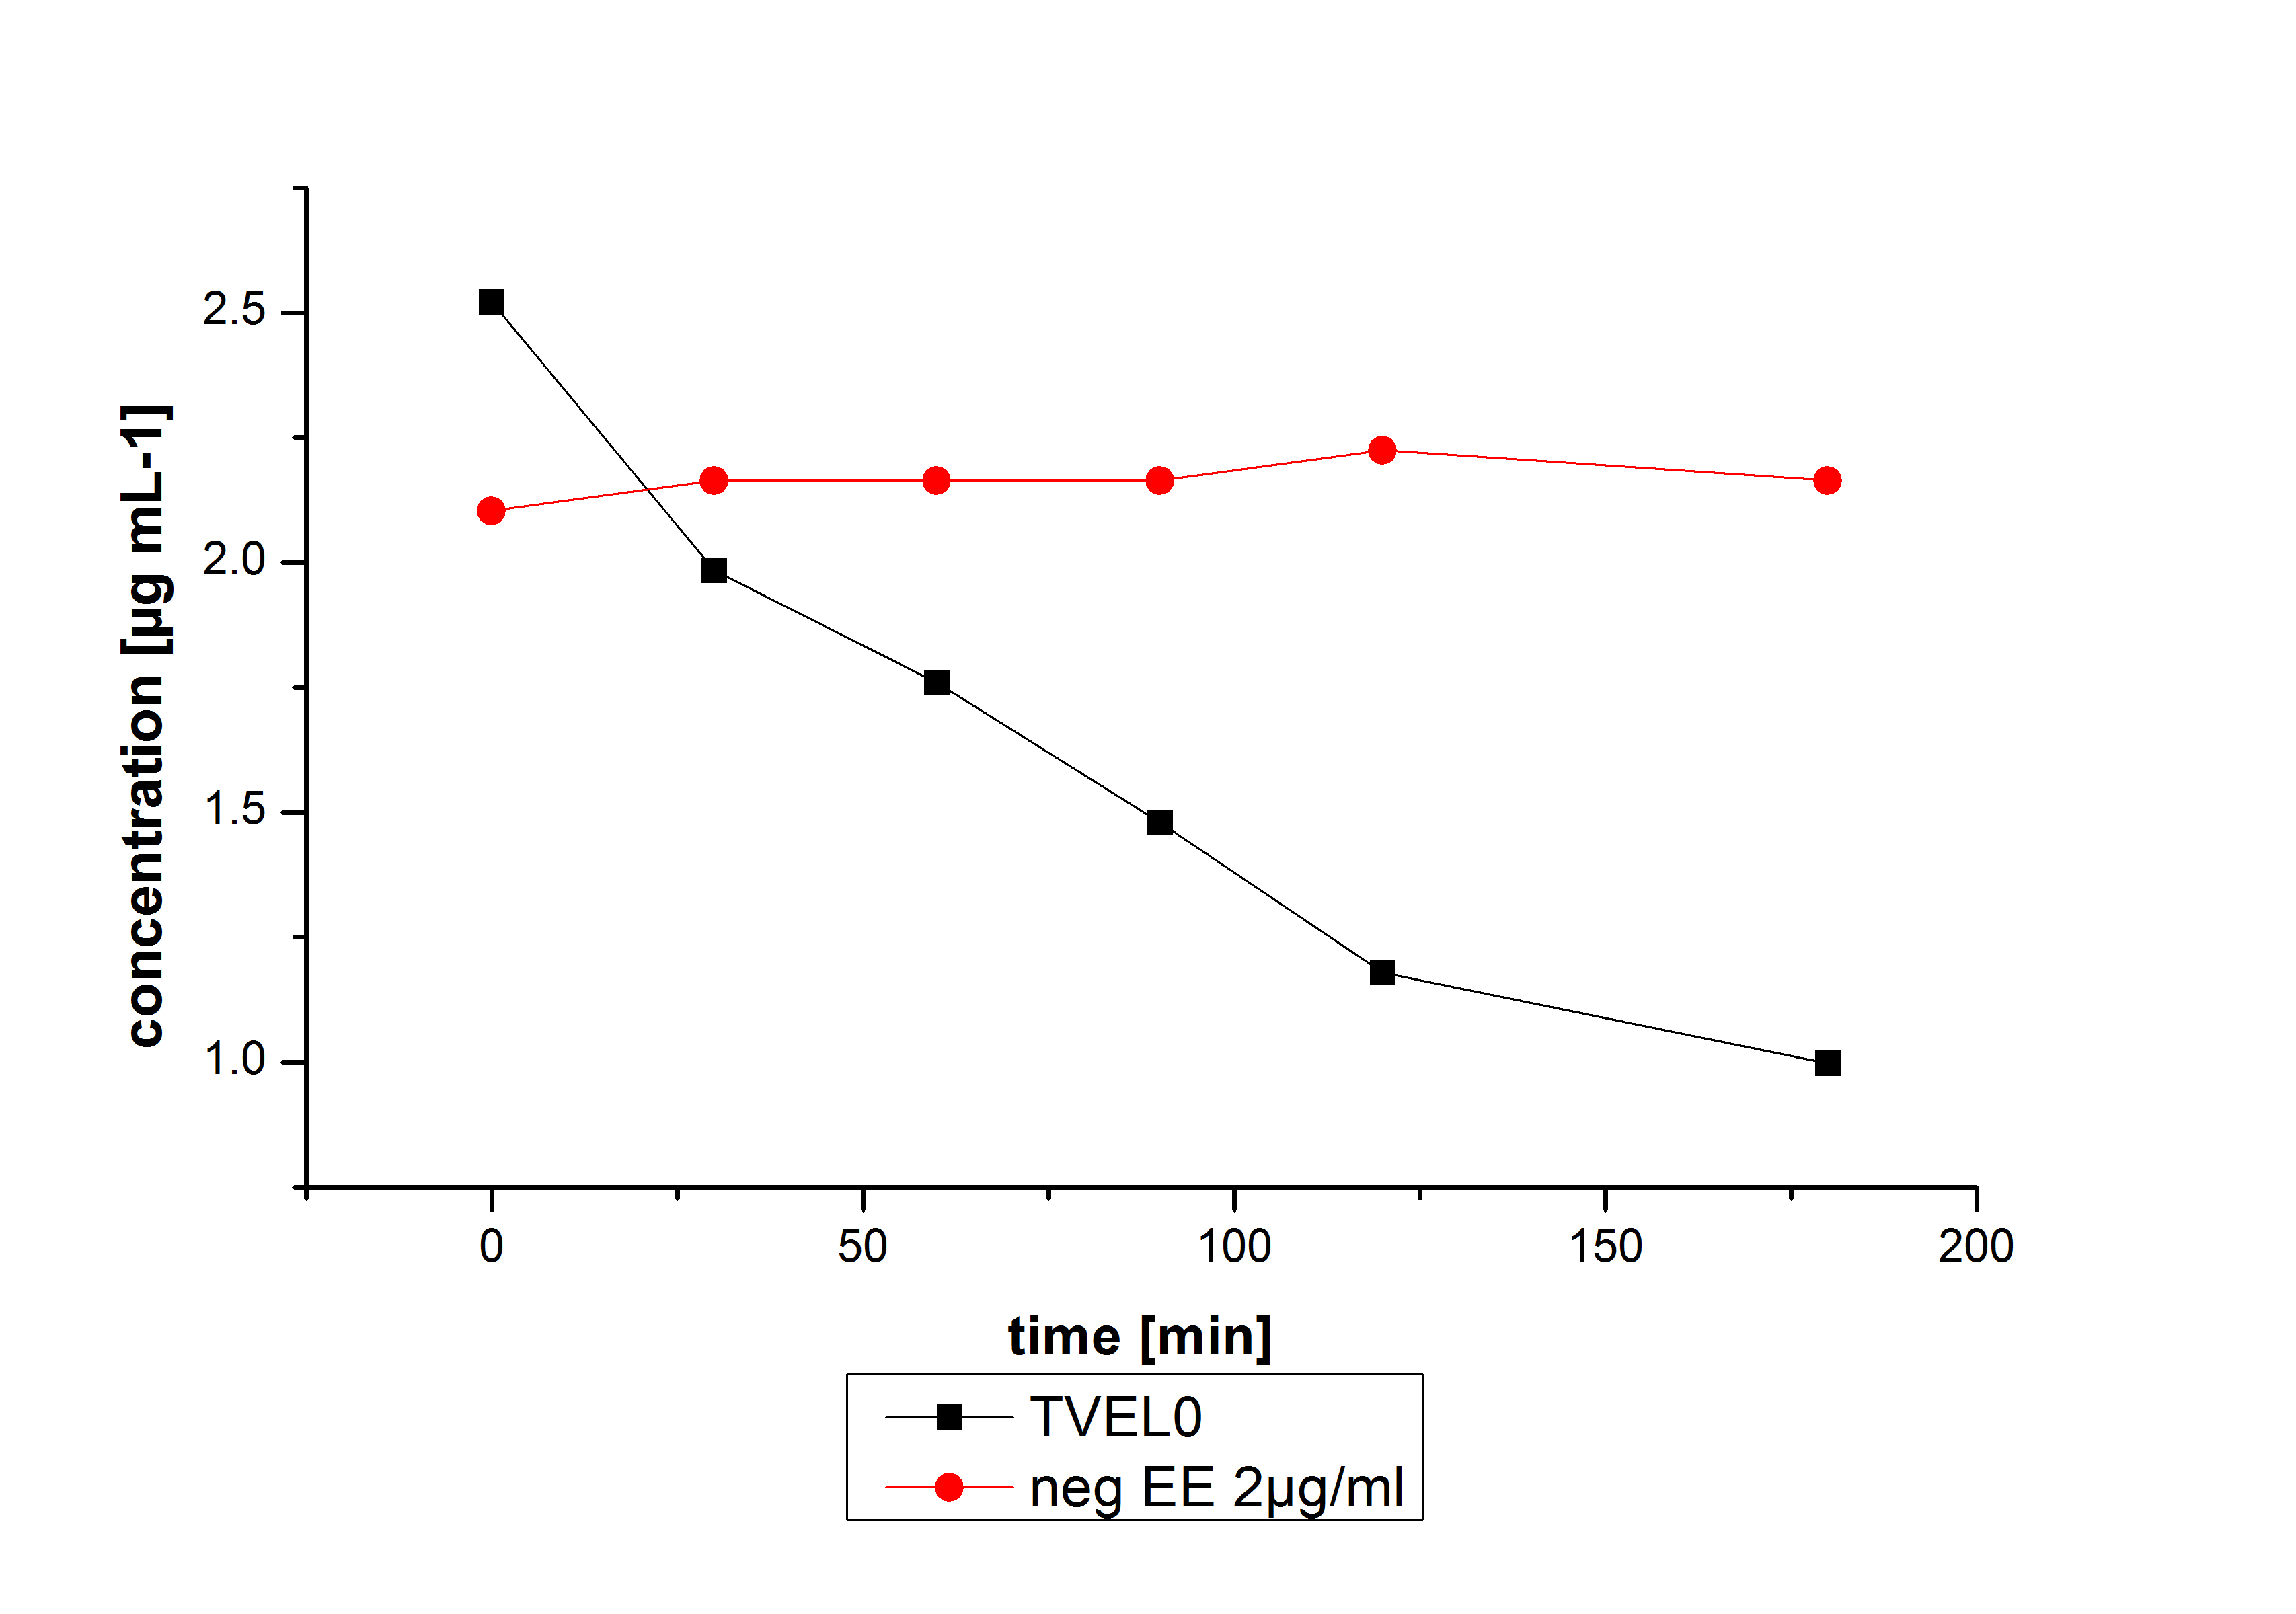
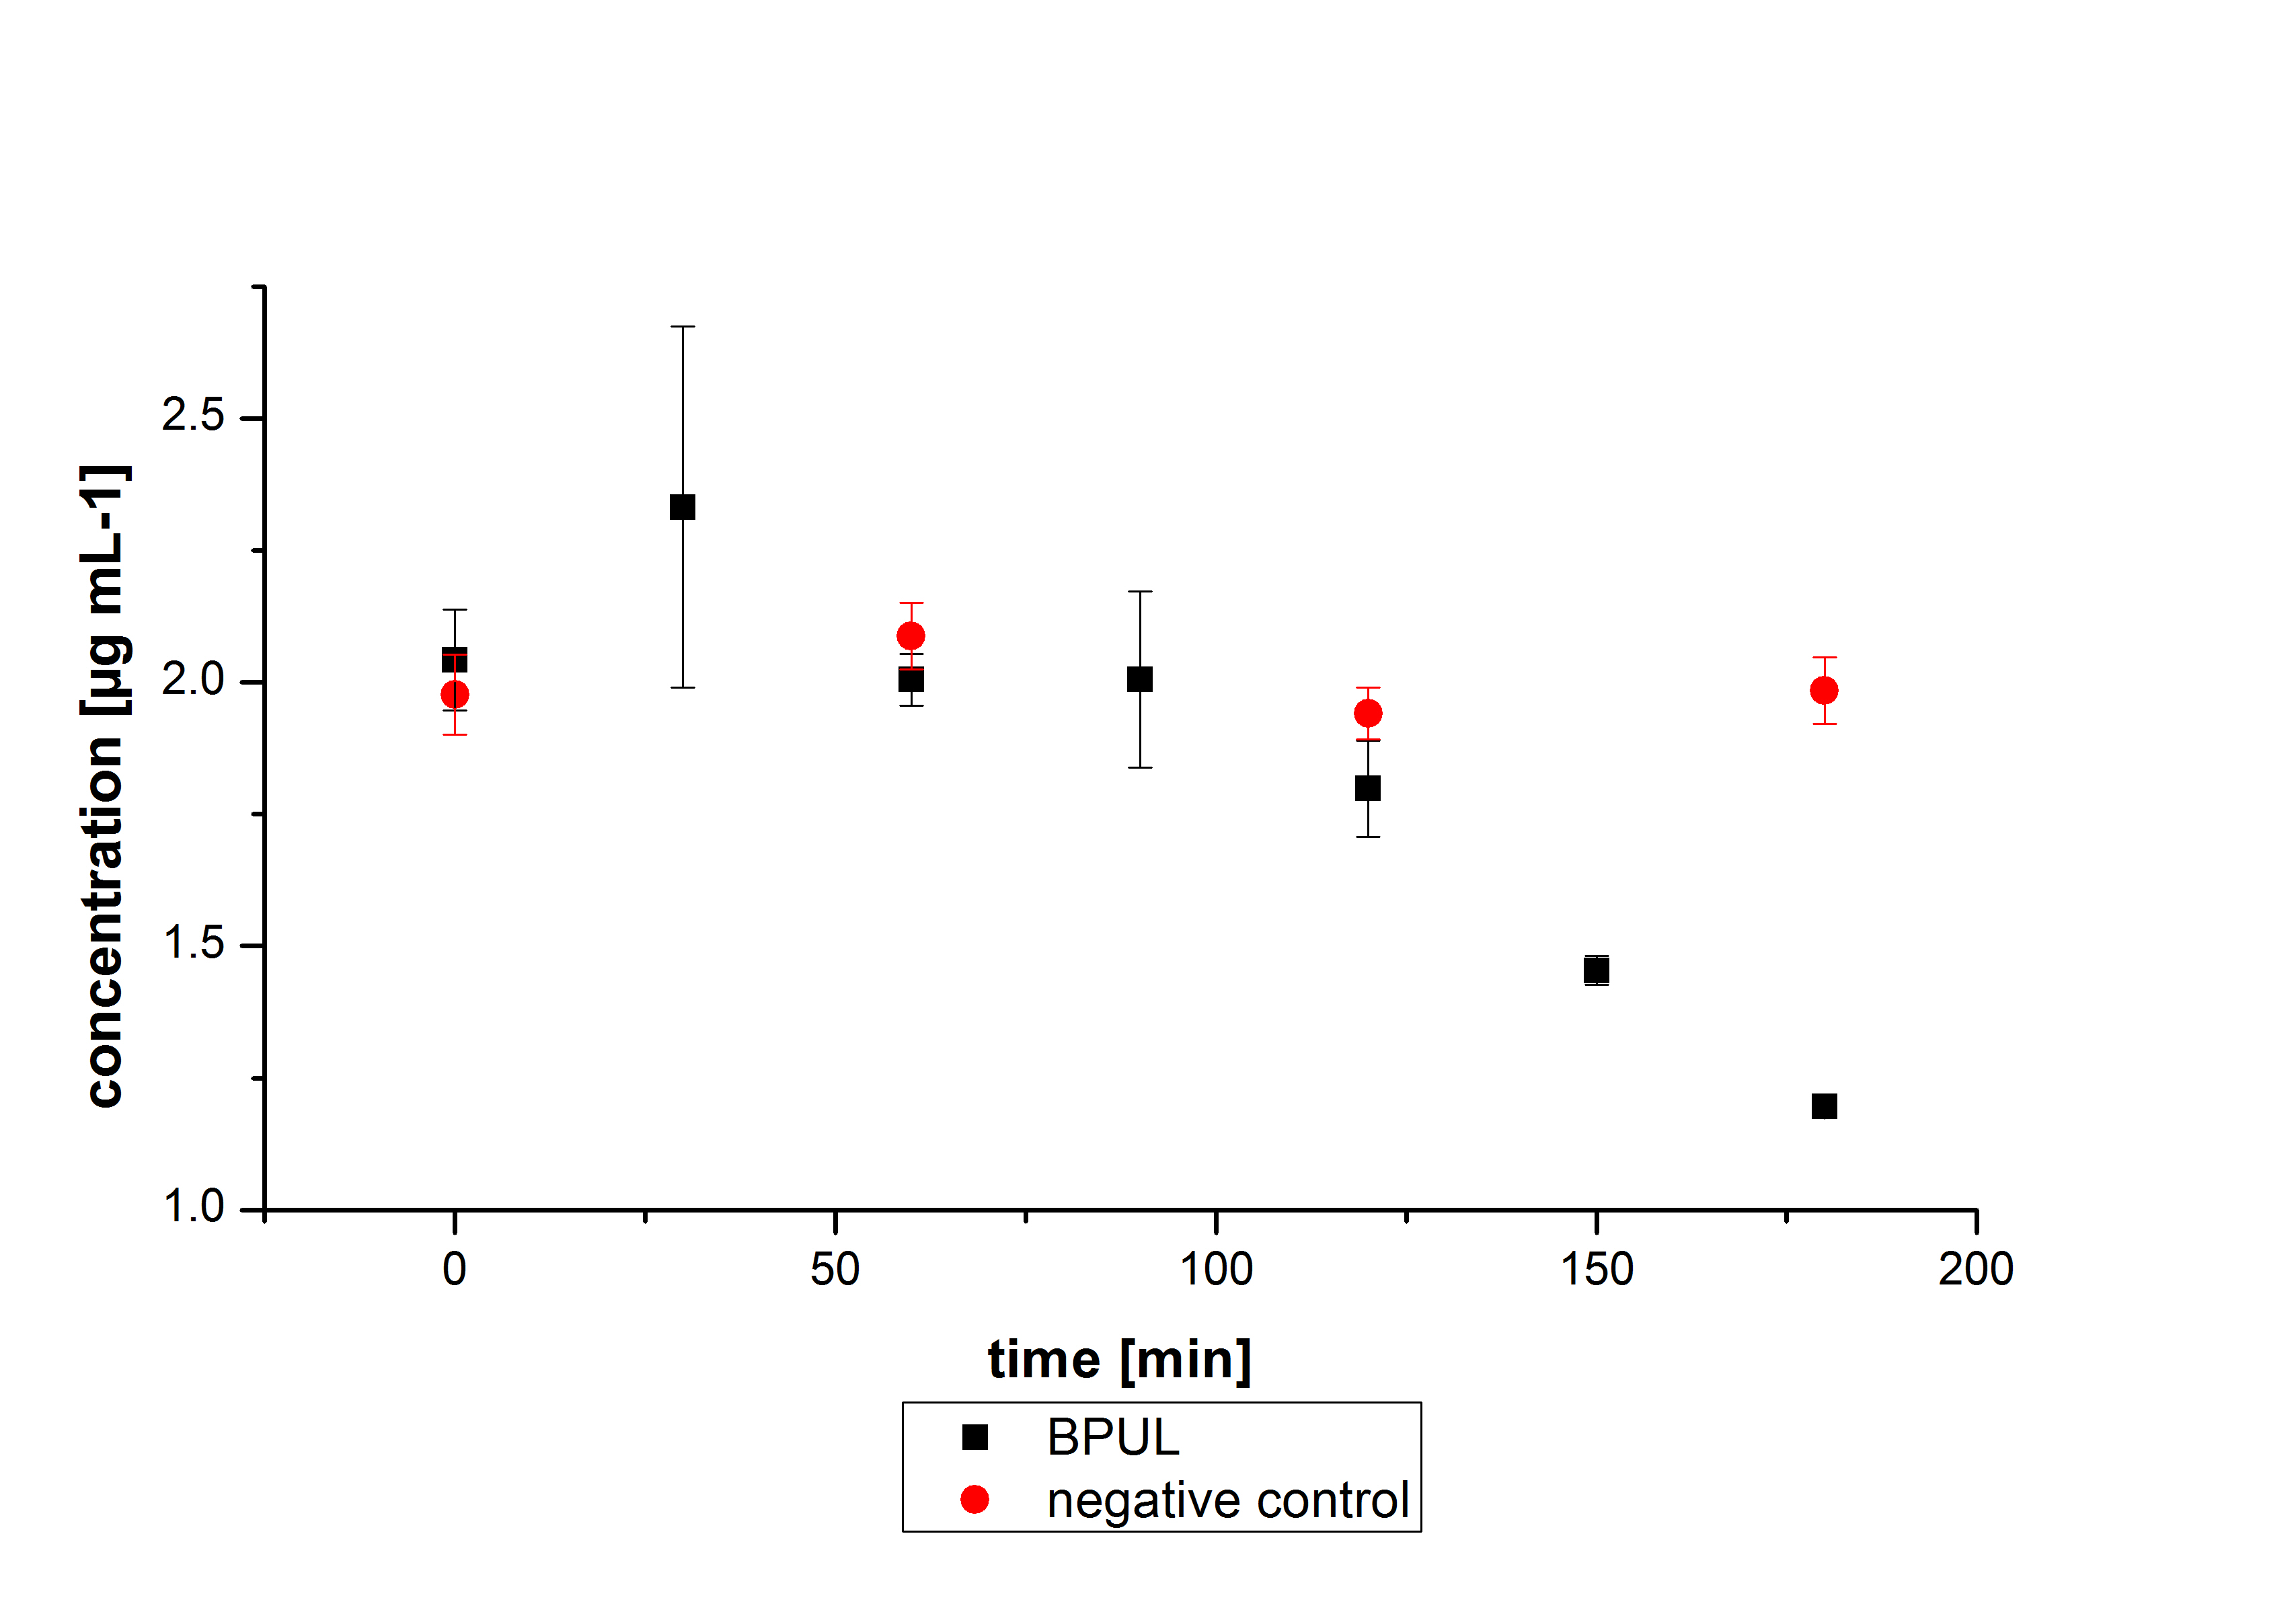
The TVEL0 was able to degradate the synthetic estradiol (fig. 1) and we cannot say it for sure but also Anthracen (fig 3.). Our Ethinylestradiol calibration curve showed that it is stable in the media we used (fig 2.). Anthracen distingrates itself in the Britton Puffer but with Laccases there is less Anthracen measured in the LC-MS indicating our Laccase is able to degradate it (fig. 4). Esteron (fig. 5) and Estradiol (fig. 6) were degrade as well. On Esteron we could not identify any degradation products. The reason for this could be that the products are not detectable with LC-MS. We could identify peaks in the degradation of Estradiol but were not able to identify them. On the following figures you can see the results of our LC-MS measurments.
High performance liquid chromatography
Dilution series
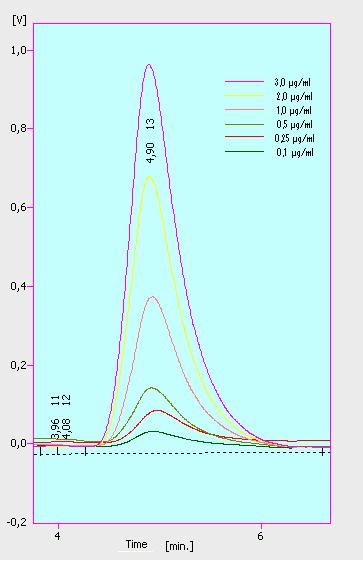
At first we mesured dilution series of all different substrates. While estradiol and ethinyl estradiol where easy to mesure, we didnt succed often with the estrone calibration curves. This was caused by its bad solubility. The retention time for estradiol is 5.8 minutes, for estrone 4.7 minutes and for ethinyl estradiol 5.2 minutes. For all estrogens we could use the same extinction and emmission values: Ex 230, Em 310.
The next substrate class where the analgesics. These three substrates have different optimal extinction and emission values. Additional difficulties occured with naproxene and ibuprofen. Instead of one single peak we found two for each substrate, and none of them correlated with the used concentration. With diclofenac we are still not sure which extinction and emmission values are to use. We found different values and aditionaly we analysed it with a spectrofluorometer but this has also shown no clear peak for diclofenac.
Three of the four PAH´s have the same extinction and emmission values. Simular to the estrogens, the PAH calibration curves are easy to generate. Naphthalene has a retention time of 9.6 minutes and its detection range ist also 0.1 till 2.5 µg*mL-1. Acenaphthene with a retention time of 15.1 minutes and phenantrene with a retention time of 17 minutes have maximal detectable concentration of 1.5 µg*mL-1.
Anthracene will be mesured later.
Negative controls
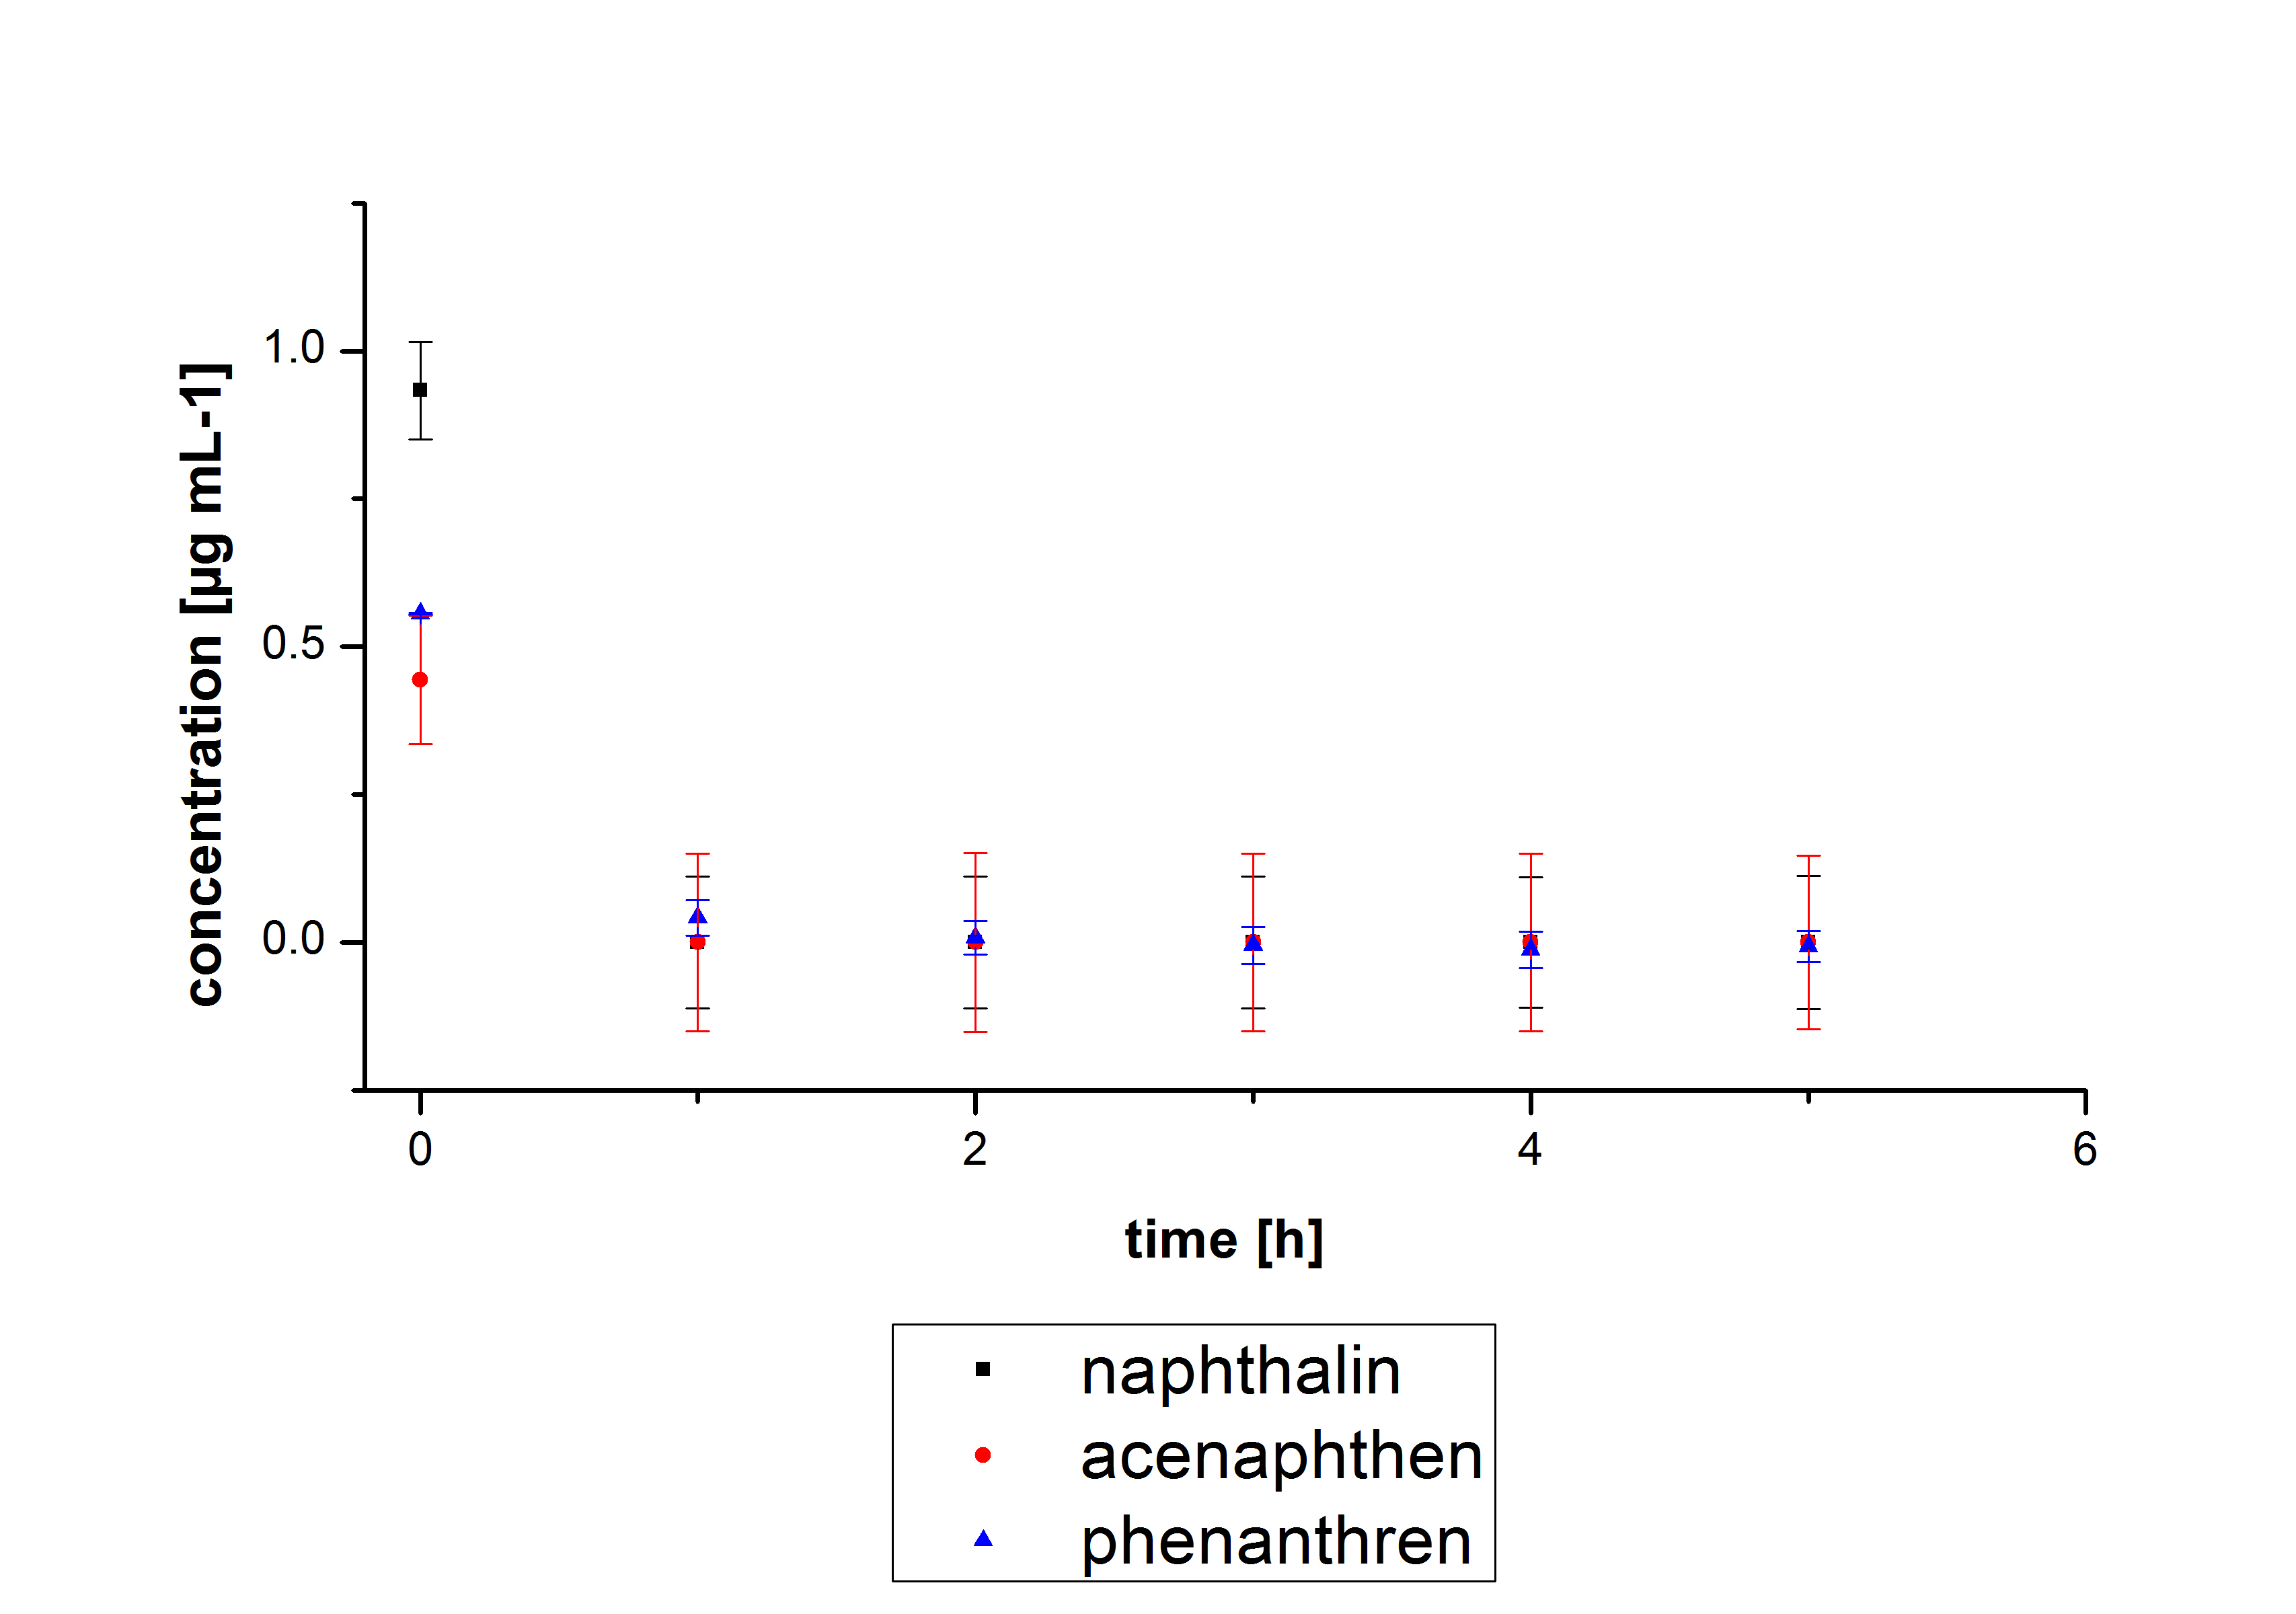
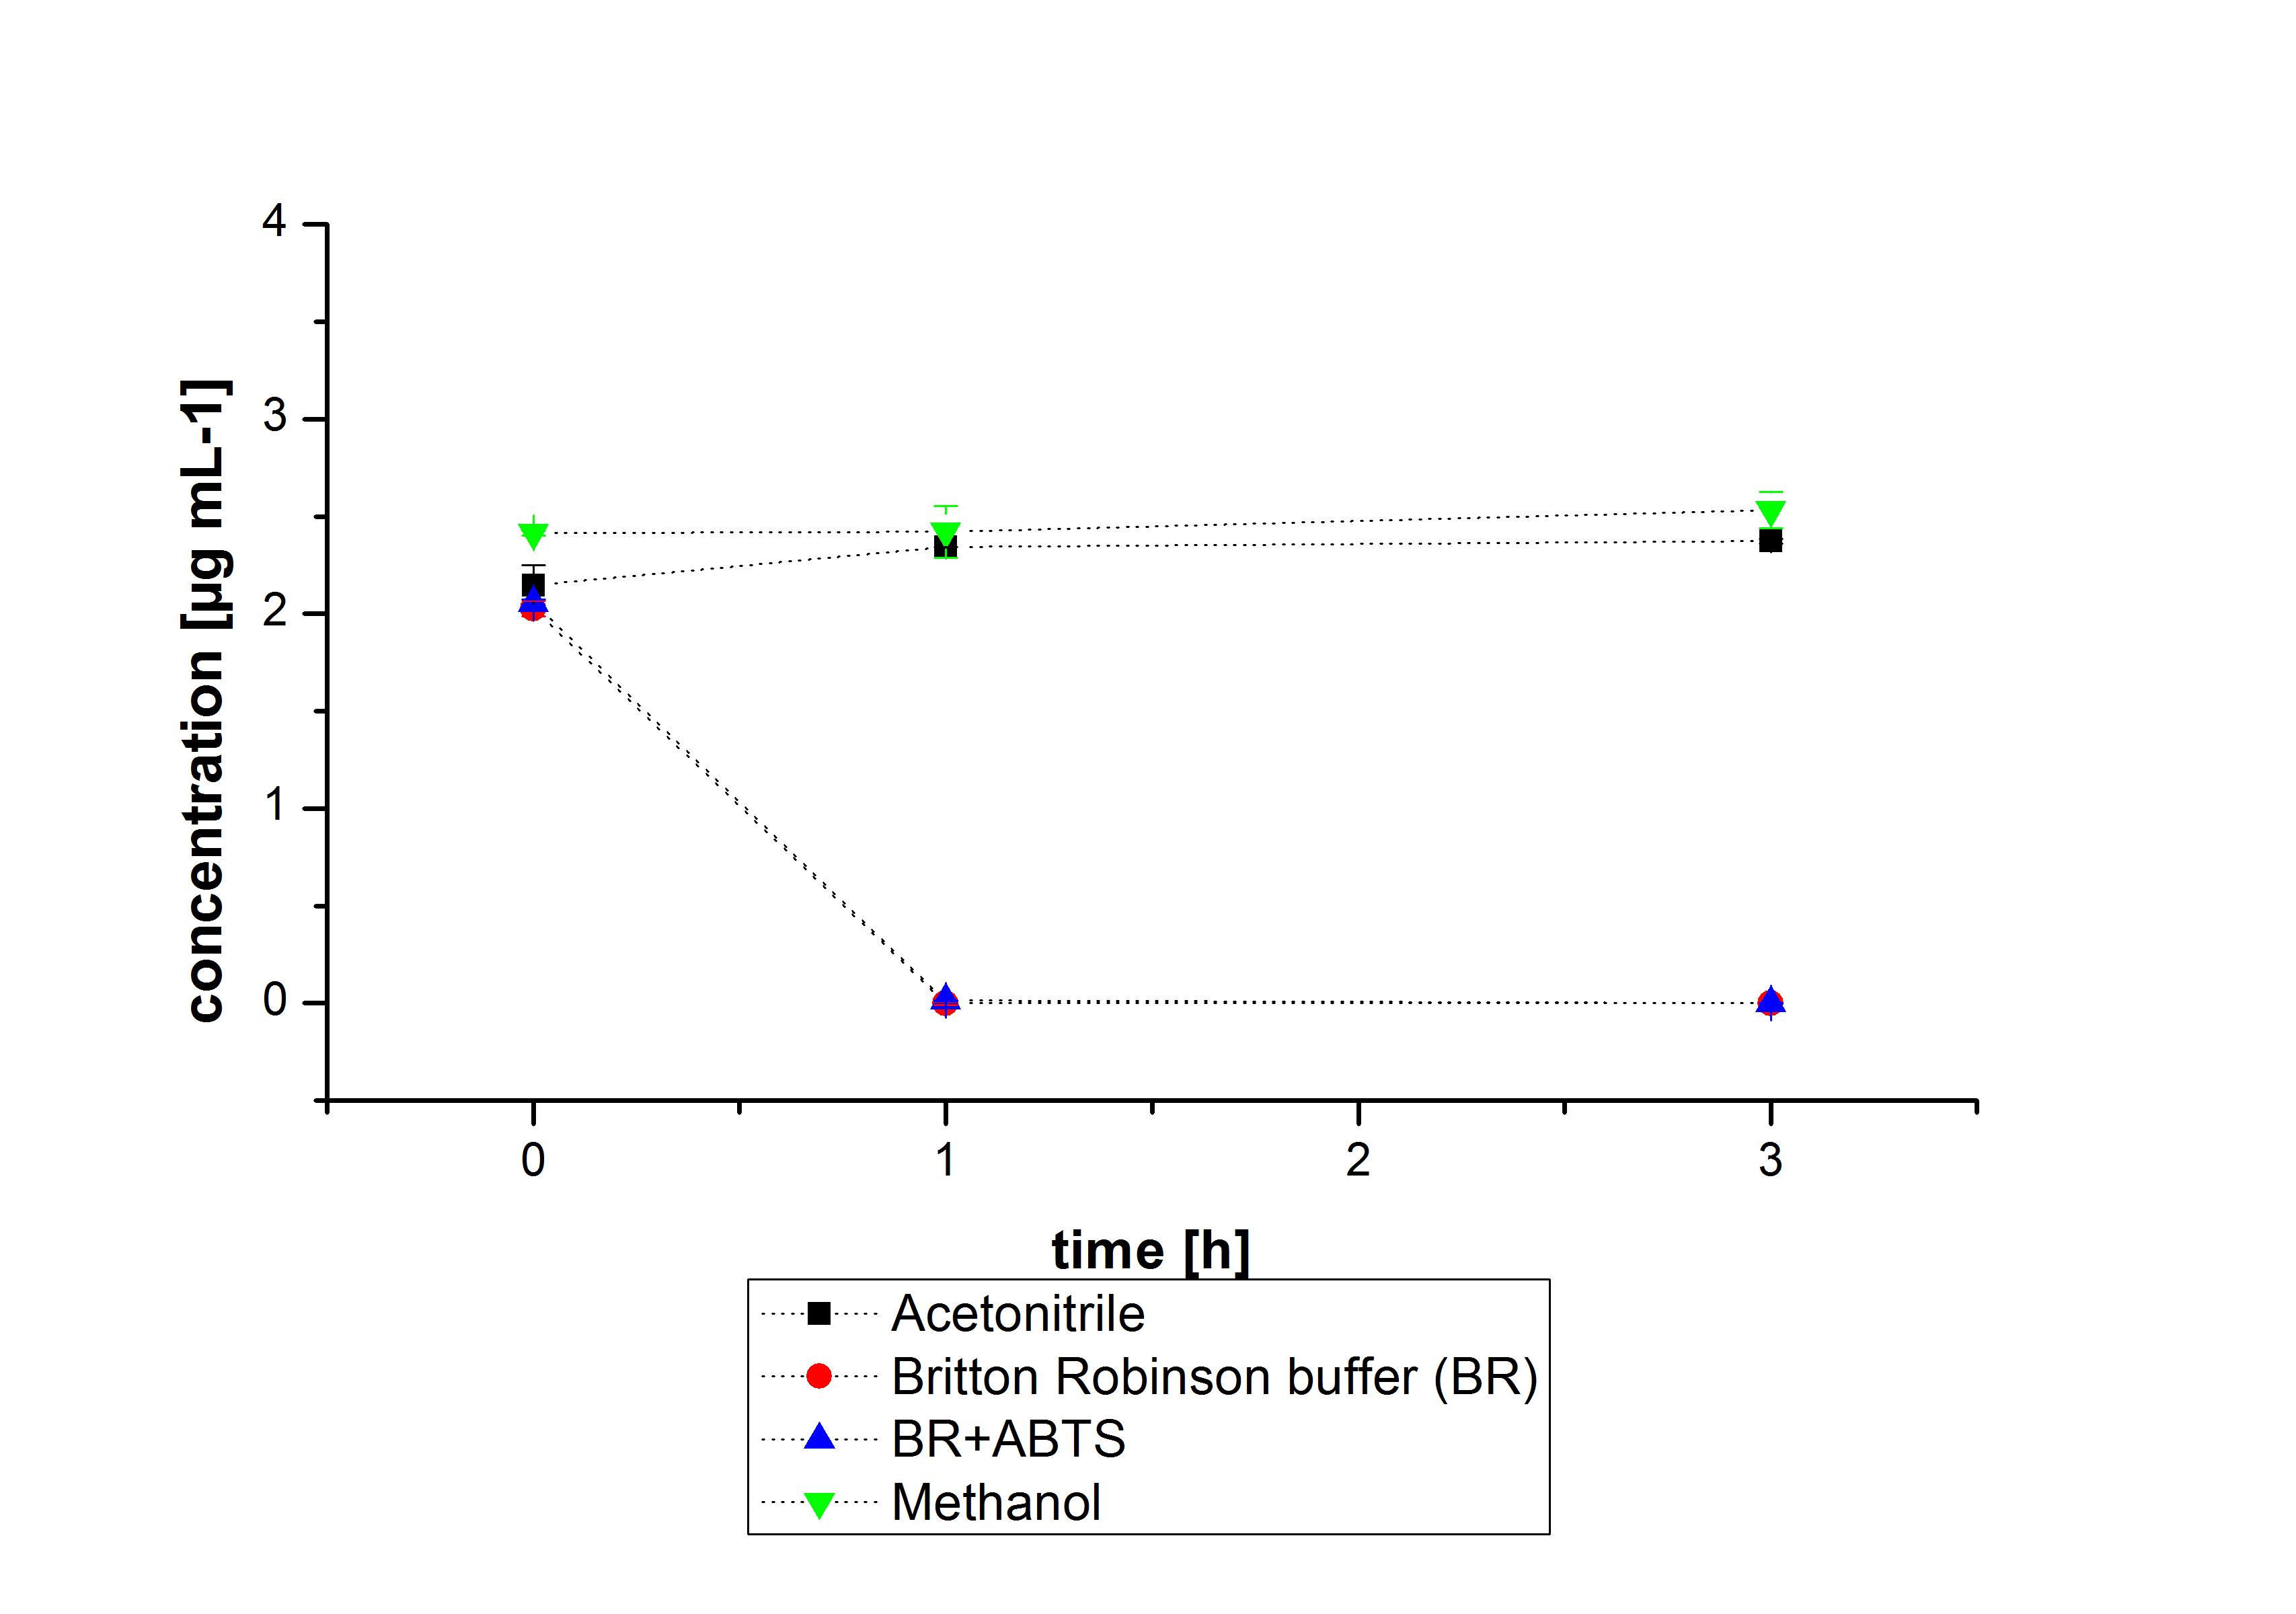
The results of our negative controls of the first Polycyclic aromatic hydrocarbon, PAH, degradations showed, that PAH´s decay without laccase with a high speed. So we take a closer look at the three PAH´s in Britton Robinson (BR)-buffer. The result can be seen in figure 2.1. After one hour most of the used substrates decayed.
The next step was to check if and which substance cause the decay. In this test we dissolved naphthalene in acetonitrile and in methanol and compared the pure solvents with the influence of the BR-buffer and BR-buffer with ABTS. With pure methanol or acetonitrile naphthalene decays slow in comparison to BR-buffer. In BR-buffer with or without ABTS the decay happens faster and under nearly the same velocity. So BR-buffer seems to be a bad choice to test if our laccases degrade PAH´s.
Degradation
Degradation reactions with ABTS showed the expected results. Team Activity test already showed, that the laccases have the ability to oxidise ABTS. The fact that oxidised ABTS react chemical with the substrates explains, that all of our active laccases have the ability to degrade ethinly estradiol and other substrates.
The potential of the purchased laccase TVEL0 is much higher. TVEL0 degrades ethinyl estradiol without ABTS.
BPUL has not the same potential as the purchased laccase. But BPUL degrades estradiol without the influence of ABTS.
Outlook
Anthracene, lindane and diclofenac are to be detected with the HPLC. Ibuprofen and naproxen need a good calibration curve. For naphthalene, acenaphthene and phenantrene we have to test different buffers or lower the temperature too keep ist more stable. We have only tested BPUL and ECOL, and there will be not only TTHL to test, bot also the trametis versicolor laccases TVEL5, TVEL10, TVEL13 and TVEL20. Additional we want to determine kcat/km for the degradable substances.
Cellulose binding domain
Introduction
In the field of cheap protein-extraction cellulose binding domains (CBD) have made themselfes a name. A lot of publications have been made, concerning a cheap strategy to capture a protein from the cell-lysate with a CBD-tag. Also enhanced segregation with CBD-tagged proteins have been observed. At this project the idea is different, the binding of our self-produced proteins to cellulose via a protein-domain-tag is taking advantage of the binding capacity of binding domains not only for purification reasons (it is still a great benefit), but also as an immobilizing-protocol for our laccases.
To make a purification and immobilization-tag out of a protein domain, there are a lot of decisions and characterizations to get through.
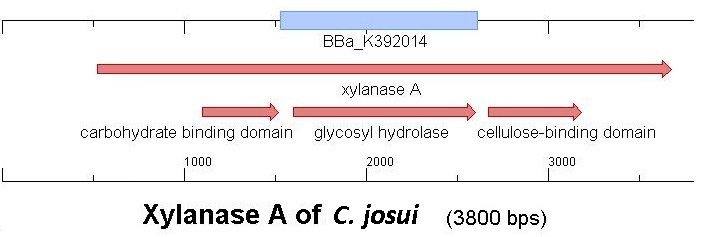
Starting with the choice of the binding domain, the first limitation is accessibility. The first place to look at is, of course the [http://partsregistry.org Partsregistry]. A promising Cellulose binding motif of the C. josui Xyn10A gene (<partinfo>BBa_K392014</partinfo>) was found and ordered for the project right from the spot. After some research later concerning the sequence of that BioBrick it turned out that the part is not the CBD of the Xylanase as it should be, but the glycosyl hydrolase domain of the protein (Figure 1). This result made the part useless for the project ([http://partsregistry.org/Part:BBa_K392014:Experience complete review]) and it was the only binding domain in the [http://partsregistry.org Partsregistry] that fitted to the project.
Accessible organisms were searched via NCBI for binding-domains, -proteins and -motifs and work-groups were asked if they could help out. The results of the database research were only two chitin/carbohydate binding modules within the Bacillus halodurans genome (That stain was ordered for it's laccase <partinfo>BBa_K863020</partinfo>). One is in the [http://www.ncbi.nlm.nih.gov/nucleotide/289656506?report=genbank&log$=nuclalign&blast_rank=1&RID=0JPT9WMS01N Cochin chitinase gene] and the other in a [http://www.ncbi.nlm.nih.gov/protein/BAB05022.1 chitin binding protein].
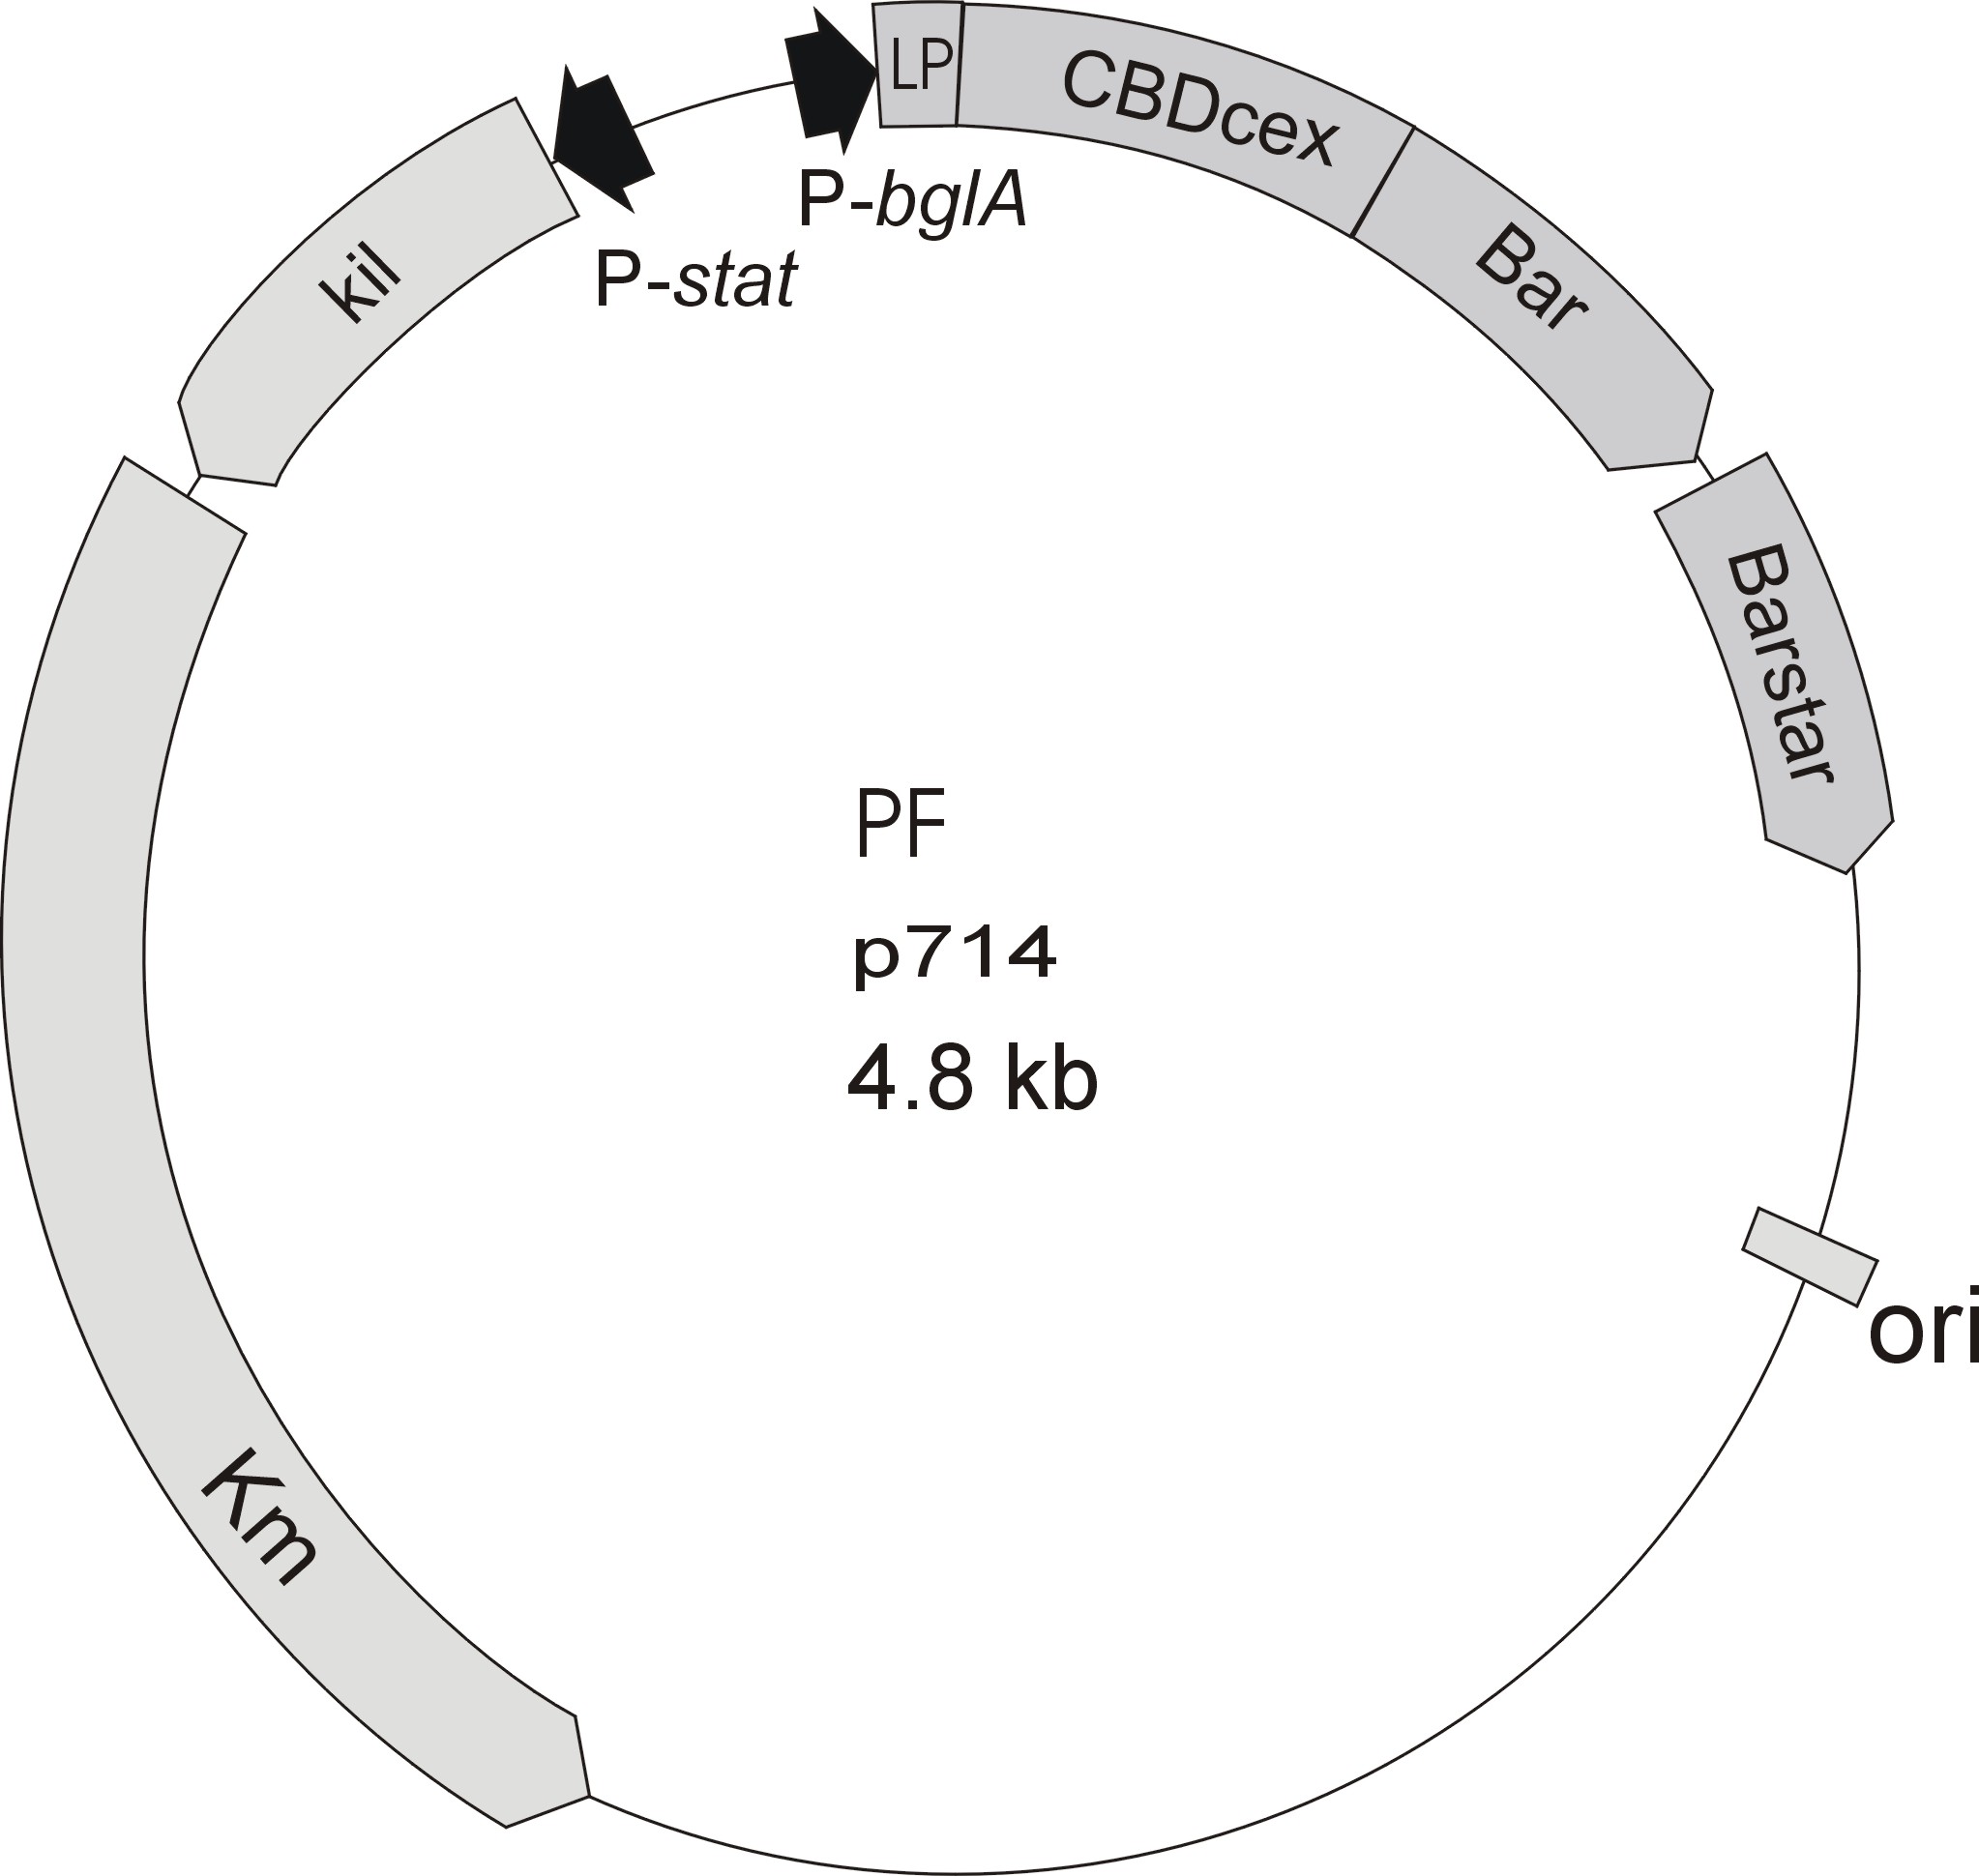
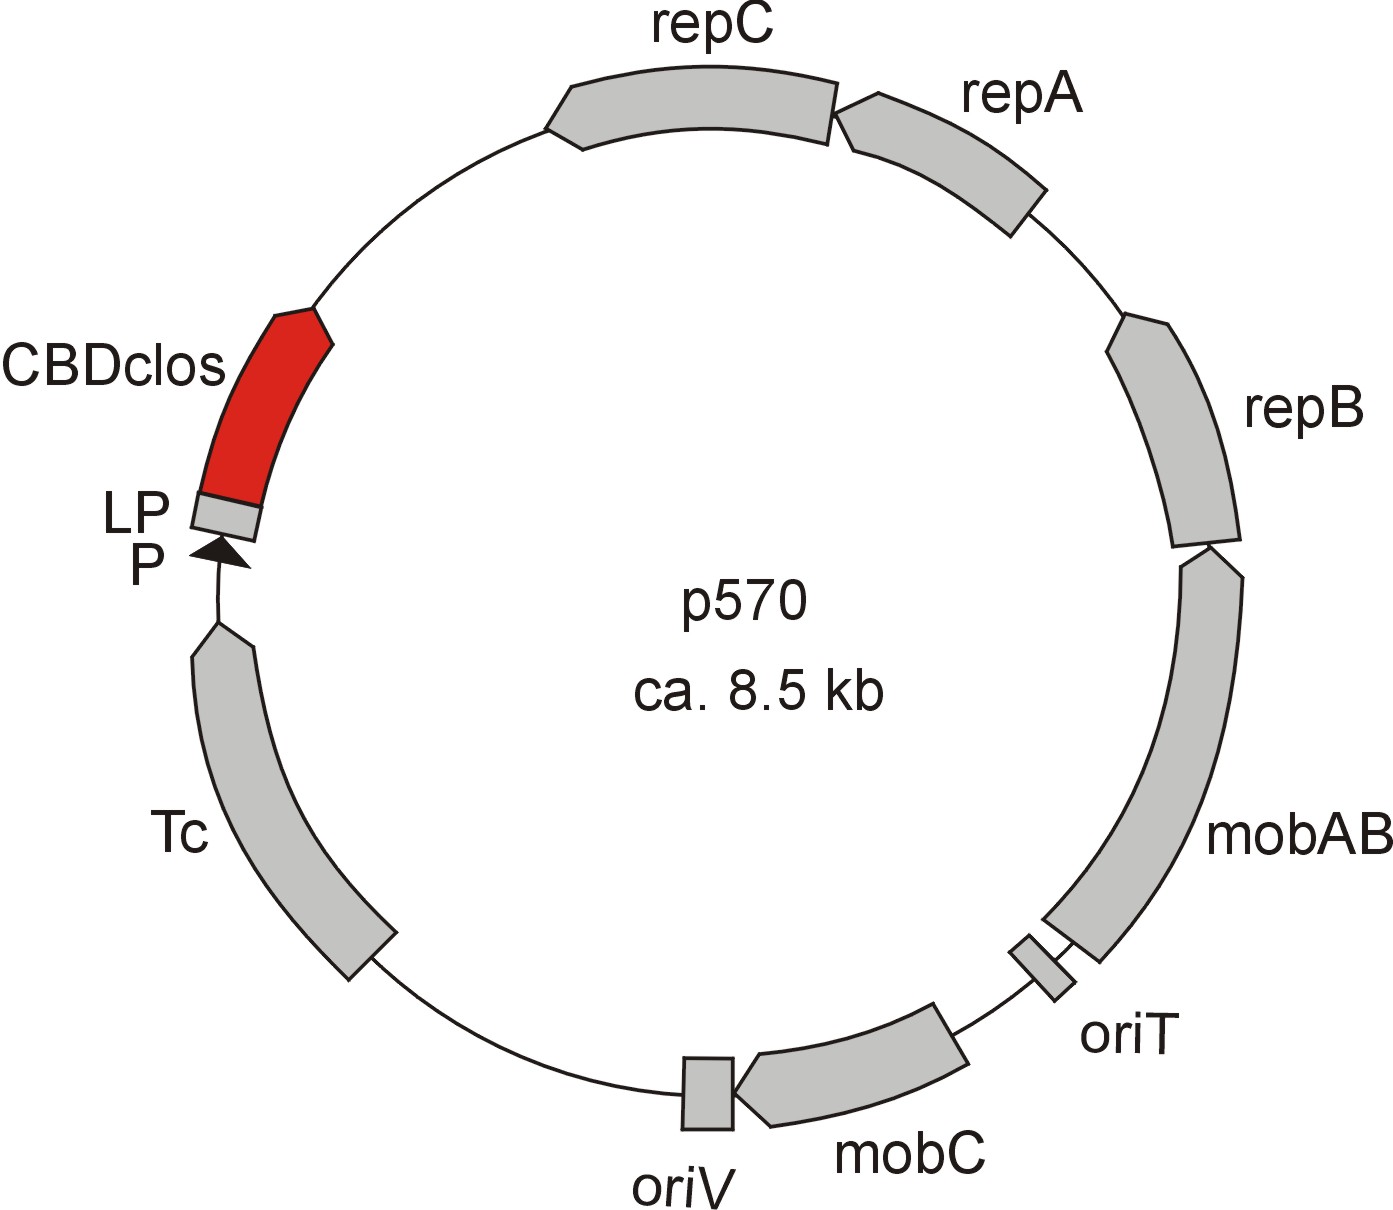
Meanwhile the Fermentation group of our university group offered the use of two plasmids (p570 & p671), containing cellulose binding domains. The cellulose binding domain of the [http://www.ncbi.nlm.nih.gov/nucleotide/327179207?report=genbank&log$=nucltop&blast_rank=3&RID=152ZCN0E01N Cellulomonas fimi ATCC 484 exoglucanase gene] (CBDcex) and the cellulose binding domain of [http://www.ncbi.nlm.nih.gov/nuccore/M73817 Clostridium cellulovorans cellulose binding protein gene (cbp A)] (CBDclos). The decision was made to use these two domains. Staying within the cellulose binding domain-family and leave other protein domains like carbohydrate binding domains aside would keep the results comparable. Like changing to a different binding material would change the binding capacities of both domains in the same way. Also both are bacterial CBDs and no post-translational modification and glycosylation had to be dealt with.
To get to know more about these two domains, their properties and their proteins NCBI wasconsulted and the [http://blast.ncbi.nlm.nih.gov/ BLAST]-tool was used to identify the cellulose binding domains and ExPASy-tools were used for further measurements.
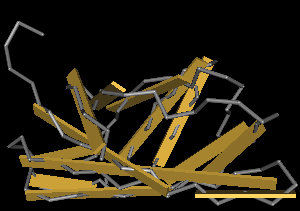
The CBD of the Cellulomonas fimi ATCC 484 exoglucanase gene (Figure 6) is a 100 amino acid long domain, close to the C-terminal ending of the protein with a theoretical pI of 8.07 and a molecular weight of 10.3 kDa. It is classified to be stable and belongs to the Cellulose Binding Modul family 2 (pfam00553/cl02709;Figure 5). This means two tryptophan residues are involved in cellulose binding, this type of CBD is only found in bacteria. Also a CBM49 Carbohydrate binding domain is found within the protein domain, where [http://www.ncbi.nlm.nih.gov/pubmed/17322304?dopt=Abstract binding studies] have shown, that it binds to crystalline cellulose, which could be a possible target for immobilization.
The CBD of the [http://www.ncbi.nlm.nih.gov/nuccore/M73817 Clostridium cellulovorans cellulose binding protein gene (cbp A)] on the other hand is a N-terminal domain with 92 amino acids, theoretical pI of 4.56 and ist also classified as stable. It belongs to the Cellulose Binding Modul family 3 (pfam00942/cl03026; Figure 8) and is part of a very large cellulose binding protein with four other carbohydrate binding moduls and a lot of docking interfaces for the proteins in its amino acid sequence (Figure 7).
The Binding Assay
To measure the capacity and strength of the bonding between the cellulose binding domains and different types of cellulose many different assays have been made. One of the simplest and most often used is the fusion of the CBD to a reporter-protein, especially [http://www.ncbi.nlm.nih.gov/pubmed/22305911a green or red fluorescent protein (GFP/RFP)] is very common. The place of the CBD is measured through the fluorescence of the fused GFP and quantification can easily been done.
[http://www.ncbi.nlm.nih.gov/pubmed/18573384 Protocol]:
- Harvest the E coli-cells producing the fusion-protein of CBD and GFP and centifuge 10 minutes at top speed.
- Re-suspend the cell-pellet in 50 mM Tris-HCl-Buffer (pH 8.0).
- Break down cells via sonication.
- Centrifuge at top speed for 20 minutes to get rid of the cell-debris.
- Take the supernatant and measure the emission at 511 nm (excitation at 501 nm) (<partinfo>E0040</partinfo>)
- Mix a definite volume of lysate with a definite volume or mass of e.g. crystalline cellulose (CC) or reactivated amorphous cellulose (RAC)
- Wait 15 (RAC) to 30 (CC) minutes
- Take supernatant and measure the emission at 511 nm again.
- The difference between the first an the second measurement is the relative quantity of what has bound to the cellulose.
Cloning of the Cellulose Binding Domains
The cloning of the CBDs should fit to the cloning of our laccases, so the BioBricks were designed with a T7-promoter and the B0034 RBS to have a similar method of cultivation. After investigating the restriction-sites it showed, that at least for the characterization of the CBDs a quick in-frame assembly of the CBDs and a GFP would be possible, because neither the CBDs nor the GFP (<partinfo>I13522</partinfo>) of the Partsregistry inherits a AgeI- or NgoMIV-site, which makes Freiburg-assembly possible. To do so, primers for the constructs <partinfo>BBa_K863101</partinfo> (CBDcex(T7)), carrying the CBDcex domain from the C. fimi exoglucanase and <partinfo>BBa_K863111</partinfo> (CBDclos(T7)), carrying the CBDclos domain from the C.cellulovorans binding protein were designed. The protein-BLAST of the two CBDs gave an exact picture of which bases belong to the binding domains and which don't. To be sure not to disturb the folding anyway 6 to 12 bases up and downstream of the domains as conserved sequences were kept. Even if the [http://partsregistry.org/Part:BBa_K863101 CBDcex]is an C-terminal domain both domains were made N-terminal, so the BioBricks can carriy all regulatory parts and the linked protein can easily be exchanged. This also would be nice for other people using this part.
| CBDcex_T7RBS | 80 | TGAATTCGCGGCCGCTTCTAGAGTAATACGACTCACTATAGGGAAAGAGGAGAAATAATGGGT CCGGCCGGGTGCCAGGT |
| CBDcex_2AS-Link_compl | 56 | CTGCAGCGGCCGCTACTAGTATTAACCGGTGCTGCCGCCGACCGTGCAGGGCGTGC |
| CBDclos_T7RBS | 73 | CCGCTTCTAGAGTAATACGACTCACTATAGGGAAAGAGGAGAAATAATGTCAGTTGAATTTTACAACTCTAAC |
| CBDclos_2ASlink_compl | 63 | CTGCAGCGGCCGCTACTAGTATTAACCGGTGCTGCCTGCAAATCCAAATTCAACATATGTATC |
The listed complementary primers added, besides the Freiburg-suffix, a two amino acid Glycine-Serine-linker to the end of the CBDs. This is a very short linker, but as GFP-experts and [http://www.ncbi.nlm.nih.gov/pubmed/17394253 publications] described GFP and CBDs are very stable proteins and should cope with a very short linker. The benefit of a short linker is that protease activity is kept minimal.
The GFP <partinfo>K863121</partinfo> used in the assay was an alternated version of the <partinfo>BBa_I13522</partinfo>. The primers that were made added a Freiburg-pre- and suffix to the GFP coding sequence and a His-tag to the C-terminus to get it purified for the measurements. This part <partinfo>BBa_K863121</partinfo> (GFP_His) should be easily added to the CBDs and assembled to the fusion-proteins <partinfo>BBa_K863103</partinfo> CBDcex(T7)+GFP_His] and <partinfo>BBa_K863113</partinfo> CBDclos(T7)+GFP_His]).
| GFP_Frei | 54 | TACGGAATTCGCGGCCGCTTCTAGATGGCCGGCATGCGTAAAGGAGAAGAACTT |
| GFP_His6_compl | 74 | CTGCAGCGGCCGCTACTAGTATTAACCGGTGTGATGGTGATGGTGATGTTTGTATAGTTCATCCATGCCATGTG |
Since a His-tag was added to the end of the GFP, an alternated version of the <partinfo>BBa_I13522</partinfo> had to be made to compare binding of GFP with and without CBD. Therefore a forward primer was made, to amplify the whole <partinfo>BBa_I13522</partinfo> with the GFP_His_compl-primer to add the His-tag to the C-terminus.
| GFP_FW_SV | 39 | acgtcacctgcgtgtagctCGTAAAGGAGAAGAACTTTT |
Due to bad cleavage efficiency at the PstI restriction-site in nearly all PCR-products the cloning of the CBDs ([http://partsregistry.org/Part:BBa_K863102 CBDcex(T7)] and [http://partsregistry.org/Part:BBa_K863112 CBDclos(T7)])and especially the insertion of [http://partsregistry.org/Part:BBa_K863121 GFP_His] to the CBDs took a lot more time as expected. This was because, while designing the primers, it was missed to add additional base pairs from the cleavage-site to the termini to increase the efficiency to standard. When the problem was disclosed, cloning got a lot quicker and more successful.
As the project went on and the T7-constructs didn't seem to work one suspected reason was that a stop codon (TAA) that accidentally resulted between the RBS and ATG could be the reason for that. To solve the problem a change to a constitutive promoter (<partinfo>BBa_J61101</partinfo>) was made now and then using the Freiburg-assembly. Therefore Freiburg forward primers for the CBDs were made.
| CBDcex_Freiburg-Prefix | 54 | GCTAGAATTCGCGGCCGCTTCTAGATGGCCGGCGGTCCGGCCGGGTGCCAGGTG |
| CBDclos_Freiburg-Prefix | 57 | GCTAGAATTCGCGGCCGCTTCTAGATGGCCGGCTCATCAATGTCAGTTGAATTTTAC |
The second advantage of these primers were, that the order of the fusion proteins could easily been changed, when a Freiburg suffix-primer for the GFP would be available, so it was ordered.
| GFP_Freiburg_compl | 61 | ACGTCTGCAGCGGCCGCTACTAGTATTAACCGGTTTTGTATAGTTCATCCATGCCATGTGT |
Sadly the primers arrived just a few days before wiki freeze and we had no time to test that. The switching to the constitutive promoter had no obvious effect (no green colonies or culture). Changing the expression strain from E. coli KRX to E. coli BL21 didn't do a positive effect ether. Which led to the conclusion, that besides further information the problem has to be the space in between the two proteins and the CBD and GFP must hamper each other from folding correctly. To test and solve this a very long linker with three serines followed by ten asparagines should be assembled in the already existing parts via a blunt end cloning. This also is right at hand, just wasn't successful in the time which was left.
| S3N10_Cex_compl | 40 | TTGTTGTTGTTCGAGCTCGAGCCGACCGTGCAGGGCGTGC |
| S3N10_Clos_compl | 40 | TTGTTGTTGTTCGAGCTCGAGCTGCCGCCGACCGTGCAGG |
| S3N10_GFP | 40 | CAATAACAATAACAACAACCGTAAAGGAGAAGAACTTTTC |
Literature
Kavoosi et al. (2007) Strategy for selecting and characterizing linker peptides for CBM9-tagged fusion proteins expressed in Escherichia coli. Biotechnol Bioeng. Oct 15;98(3):599-610. Urbanowicz et al. (2007) A tomato endo-beta-1,4-glucanase, SlCel9C1, represents a distinct subclass with a new family of carbohydrate binding modules (CBM49). J Biol Chem. Apr 20;282(16):12066-74. Epub 2007 Feb 23. Sugimoto et al. (2012) Cellulose affinity purification of fusion proteins tagged with fungal family 1 cellulose-binding domain. Protein Expr Purif. Apr;82(2):290-6. Epub 2012 Jan 28. Hong et al. (2008) Bioseparation of recombinant cellulose-binding module-proteins by affinity adsorption on an ultra-high-capacity cellulosic adsorbent. Anal Chim Acta. Jul 28;621(2):193-9. Epub 2008 May 27.
Shuttle vector
A shuttle vector for recombination into the yeast P. pastoris could be developed. With this system it is possible to recombine a protein of interest with a N-terminal mating factor alpha 1 for secretion the protein in the media. This protein of interest could be cloned in frame with one restiction-ligate-cloning-step. The selection depends not on an antibiotic resistance like zeocine, but on a complementation of histidine auxotrophy.
Description of the shuttle vector system
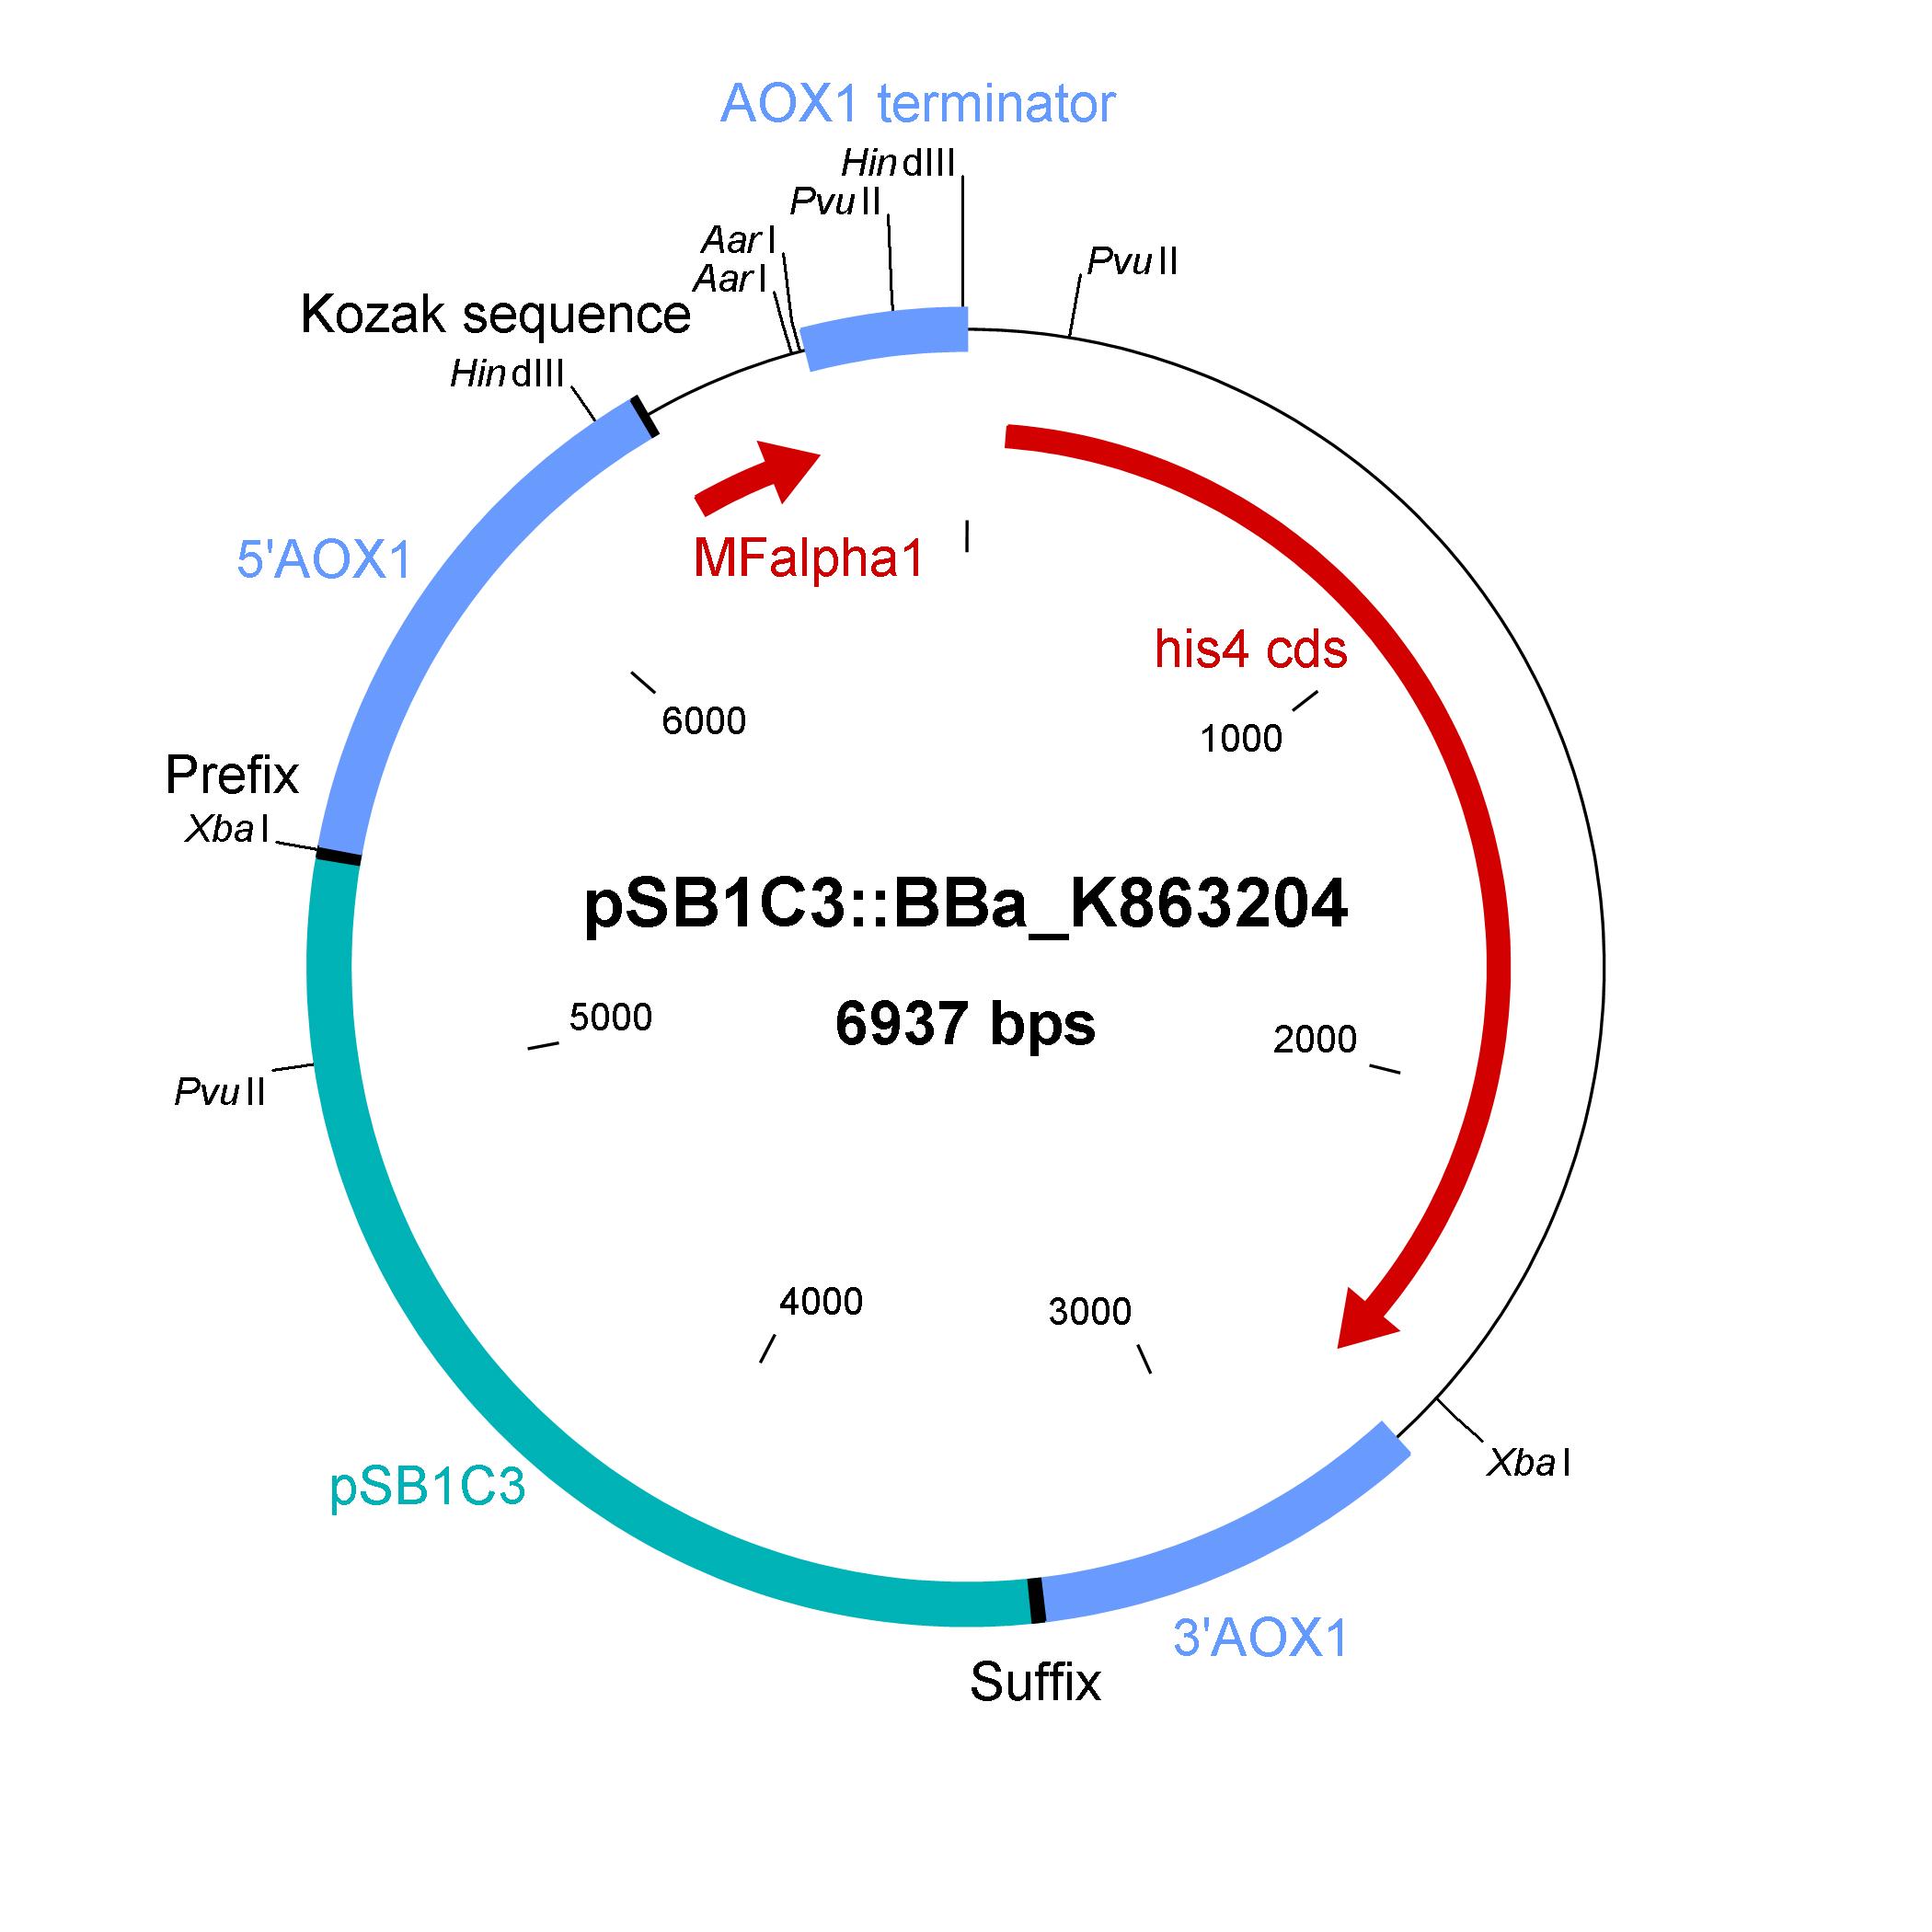
The design of a minimal shuttle vector system with defined regions (or better DNA fragments) for expression and secretion of proteins of interest (POI) like laccase which needed glycolisation is the basic concept. The shuttle vector needs a bacterial part for cloning in bacteria (like E. coli) and an eucaryotic part for genomic integration and selection in yeast (like P. pastoris). For other teams it is able to clone in frame their POI via the AarI restriction site. With only one restriction-ligation-cloning step the shuttle vector will be ready to use and integrate in the eucaryote P. pastoris.
The shuttle vector consists of the plasmid pSB1C3, 5' UTR of alcohol oxidase 1 gene (aox1) containing the aox1 promoter region, Kozak sequence, mating factor alpha 1 (MFalpha1), AarI restriction site, aox1 terminater, his4 gene and 3' UTR of aox1 gene. Cloning and plasmid replication in E. coli is able via the pSB1C3 part. The protein of interest (like laccase) can be included in frame with MFalpha1 via AarI restriction site. With the N-terminal MFalpha1 the POI could be secreted in the media. Genomic intregation of MFalpha1-taged POI is able via the 5' UTR and 3' UTR of the aox1 gene. This allows a double cross over and the genomic integration without any bacterial proportion of DNA which could be a decisive point for industrial application. The complementation of histidine auxotrophie via his4 gene is choosen instead of a zeocine resistance. This selection strategy is choosen because we want to avoid the application of antibiotics as many as possible.
Gibson assembly is used for building the shuttle vector (see the figure below) and the fragments with 5' overlap were amplified via PCR. In addition, die fragments were designed as basic BioBrick parts for use. The origin of the DNA sequence for design of the shuttle vector and the source of DNA for PCR is listed in the table below.
Elements of the shuttle vector and their origin
| Element | Origin of DNA sequence of design | Origin of DNA sequence of PCR |
|---|---|---|
| [http://partsregistry.org/Part:pSB1C3 pSB1C3] | [http://partsregistry.org/Part:pSB1C3 pSB1C3] | [http://partsregistry.org/Part:pSB1C3 pSB1C3] |
| [http://partsregistry.org/Part:BBa_K863200 5'UTR of aox1] | [http://products.invitrogen.com/ivgn/product/V19520 plasmid pPICZalphaA (Invitrogen)] | P. pastoris wild type X-33 |
| Kozak sequence | [httpp class="more">
| integrated in primer sequence |
| [http://partsregistry.org/Part:BBa_K863203 MFalpha1] | [http://products.invitrogen.com/ivgn/product/V19520 plasmid pPICZalphaA (Invitrogen)] | [http://products.invitrogen.com/ivgn/product/V19520 plasmid pPICZalphaA (Invitrogen)] |
| [http://partsregistry.org/Part:BBa_K863203 aox1 terminater] | plasmid pPIC9K | P. pastoris wild type X-33 |
| [http://partsregistry.org/Part:BBa_K863202 his4] | plasmid pPIC9K | P. pastoris wild type X-33 |
| [http://partsregistry.org/Part:BBa_K863201 3'UTR of aox1] | plasmid pPIC9K | P. pastoris wild type X-33 |
Shuttle vector in E. coli
The developed shuttle vector could transformed in E. coli and analyzed by restriction with the enzymes PvuII and HindIII. The restriction pattern is positiv. A [http://partsregistry.org/cgi/partsdb/dna.cgi?part_name=BBa%20K863204 sequencing] was also done.
Shuttle vector in P. pastoris
After linearization by restriction with EcoRI and SpeI the shuttle vector could be transformed in competent P. pastoris cells. On selective media plates for complementation of histidine auxotrophy some transformants growth (see the picture below). For differentiation between the M+ and Ms genotype a PCR with the Primer 5AOX-Genotyp-FW and TT-Genotyp-RV was done.
GFP integrated in shuttle vector
Cloning of green fluorescent protein (GFP) via the AarI restriction site into the shuttle vector was done for testing the system. A restriction analyze with enzymes ans a sequencing could not be done. The next steps will be (a) linearization with EcoRI and SpeI restriction enzymes, (b) transformation in competent P. pastoris cells, (c) genotype characterization by PCR with 5AOX-Genotype-FW and TT-Genotype-RV primers, (d) cultivation with methanol induction for GFP production and at last (e) fluorescence measure of the cultivation broth.
Collaboration with UCL
The BioBrick [http://partsregistry.org/wiki/index.php?title=Part:BBa_K729002 BBa_K729002] from the University College London was characterized by us. Therefore E. coli KRX containing [http://partsregistry.org/wiki/index.php?title=Part:BBa_K729002 BBa_K729002] and E. coli KRX as negative control were cultivated in shaking flasks and a growth kinetic was determined. The harvested cells were lysed via sonification and the supernatant was purified from substances with a low molecular weight. After purification it was analyzed by SDS-PAGE, activity assay as well as MALDI-TOF. A maximal activity of X was reached. For a comparison E. coli KRX containing [http://partsregistry.org/wiki/index.php?title=Part:BBa_K863005 BBa_K7863005] was cultivated and also analysed by SDS-PAGE and activity assay.
Introduction
Sequencing analysis
For the improvement of the data collection, the BioBrick of the University College London iGEM team was sequenced. The sequence analysis shows, that the analyzed BioBrick is equal to the sequence published in the partsregistry.
The next step was to prove, if the BioBrick is coding for the E. coli laccase CueO. Therefore the sequence was blasted against CueO from E. coli BL21 (DE3). It matched with 100 %.
Cultivation
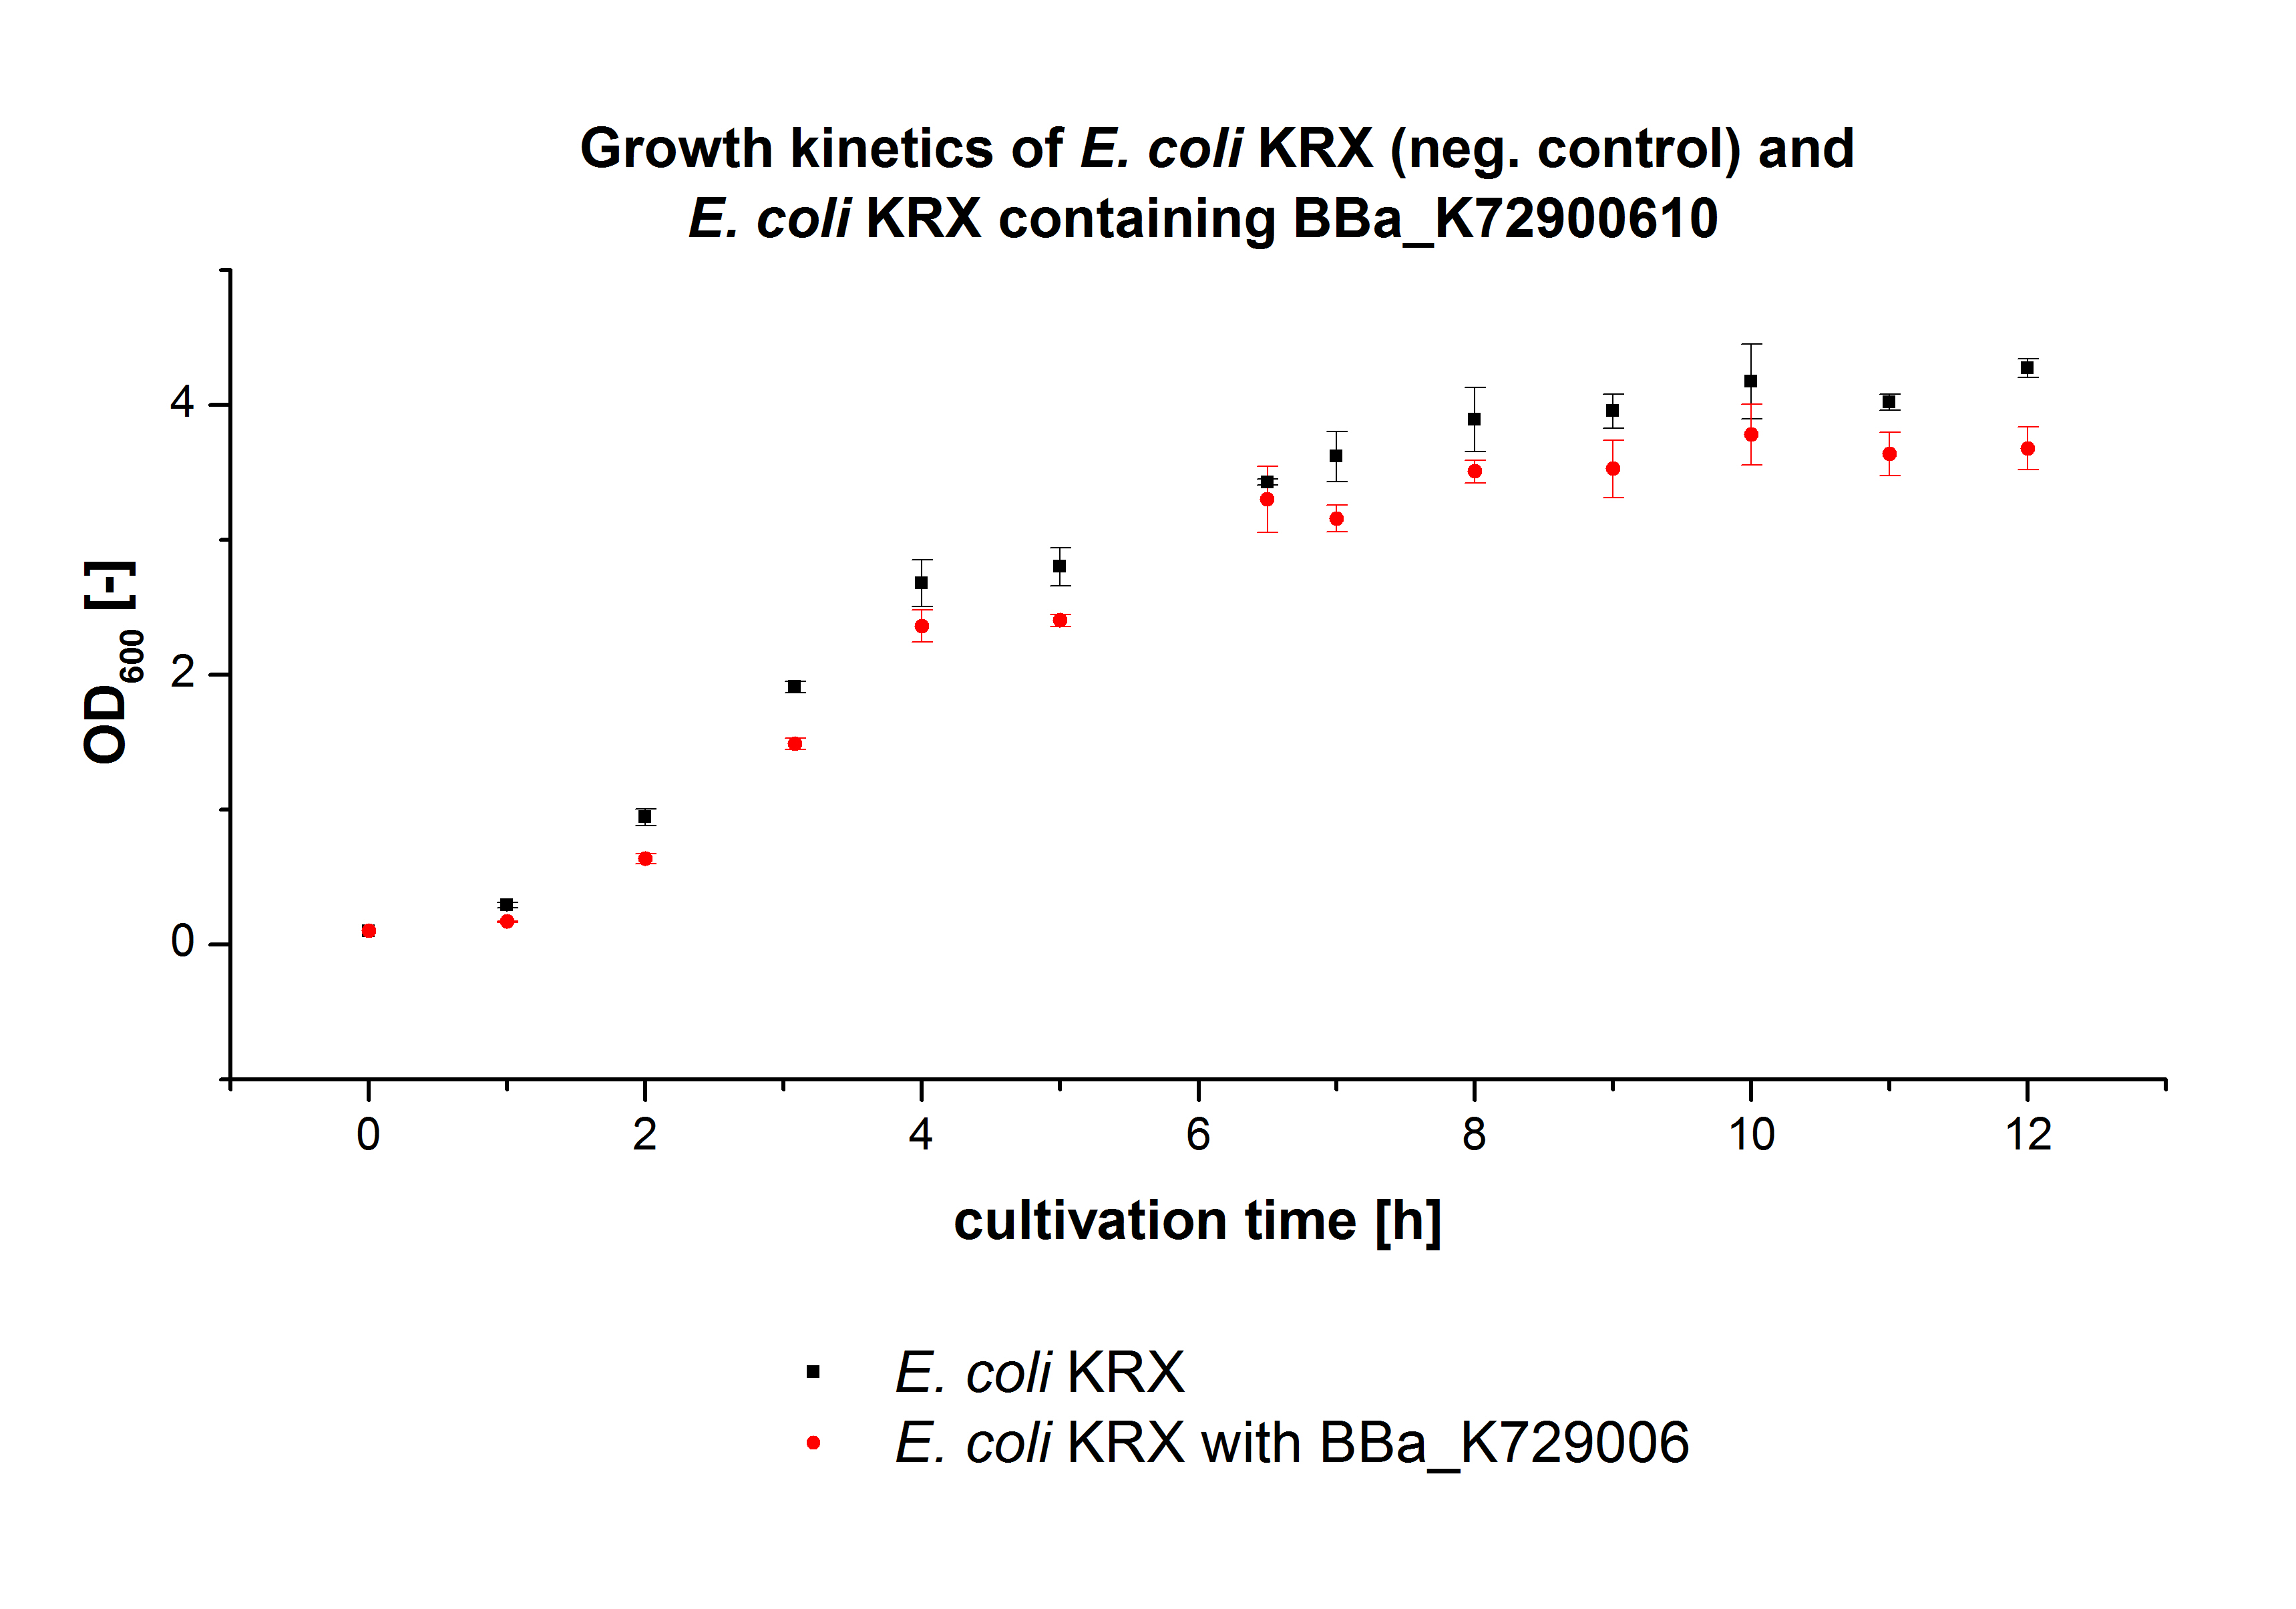
E. coli KRX was transformed with the BioBrick <partinfo>K729002</partinfo> of the iGEM team of University College of London. The cells were characterized by the growth kinetics and activity test. E. coli KRX containing <partinfo>K729002</partinfo> was cultivated in LB-medium with a total volume of 60 mL for 12 h at 37 °C (120 rpm) in 250 mL shaking flasks without baffles. To produce a higher amount of the protein, we also cultivated a total volume of 200 mL in a 1 L shaking flask without baffles. The OD600 values were determined every hour. To measure the influence of the transfered BioBrick on the growth of the cells, a negative control (E. coli KRX) was cultivated identically.
In figure 2 the OD600 of E. coli KRX containing <partinfo>K729002</partinfo> and of the negative control E. coli KRX were plotted. As expected the E. coli KRX containing <partinfo>K729002</partinfo> grew slower than negative control. This can be explained by the protein expression.
The cells were harvested and centrifuged after 12 h. Then the pellets were resuspended in 100 mM Na-Acetat-buffer, lysed by sonification and centrifuged. The supernatant was analysed by SDS-PAGE and activity assay.
SDS-PAGE
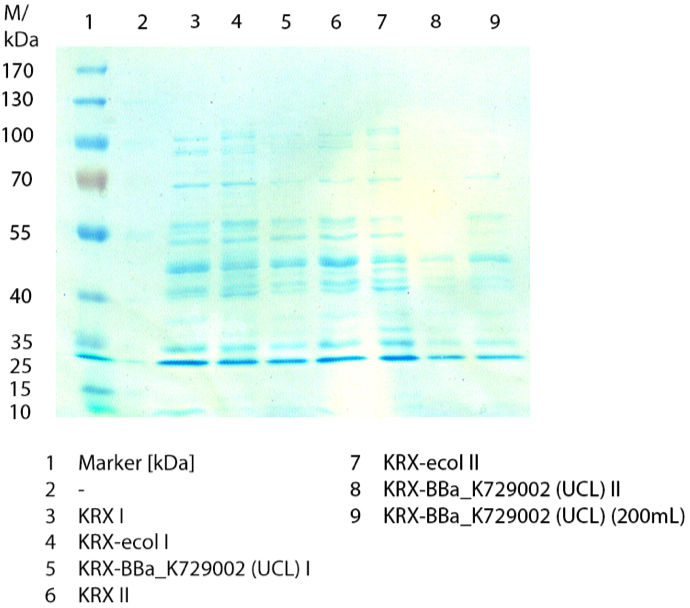
In figure 3 the SDS-PAGE of the lysates of E. coliKRX with <partinfo>BBa_K729006</partinfo>, E. coli KRX (negative control) and furthermore of E. coli KRX with <partinfo>BBa_K863005</partinfo> treated the same way are shown. No clear distinction between the samples is possible. By comparing the bands at 53.4 kDa, the molecular weight of CueO, a small difference of the bandintesity can be suspected. It seems, that the E. coli KRX containig <partinfo>BBa_K863005</partinfo> has a slightly stronger band. The bands at 53.4 kDa were picked and prepared for MALDI-TOF analysis.
Activity Tests
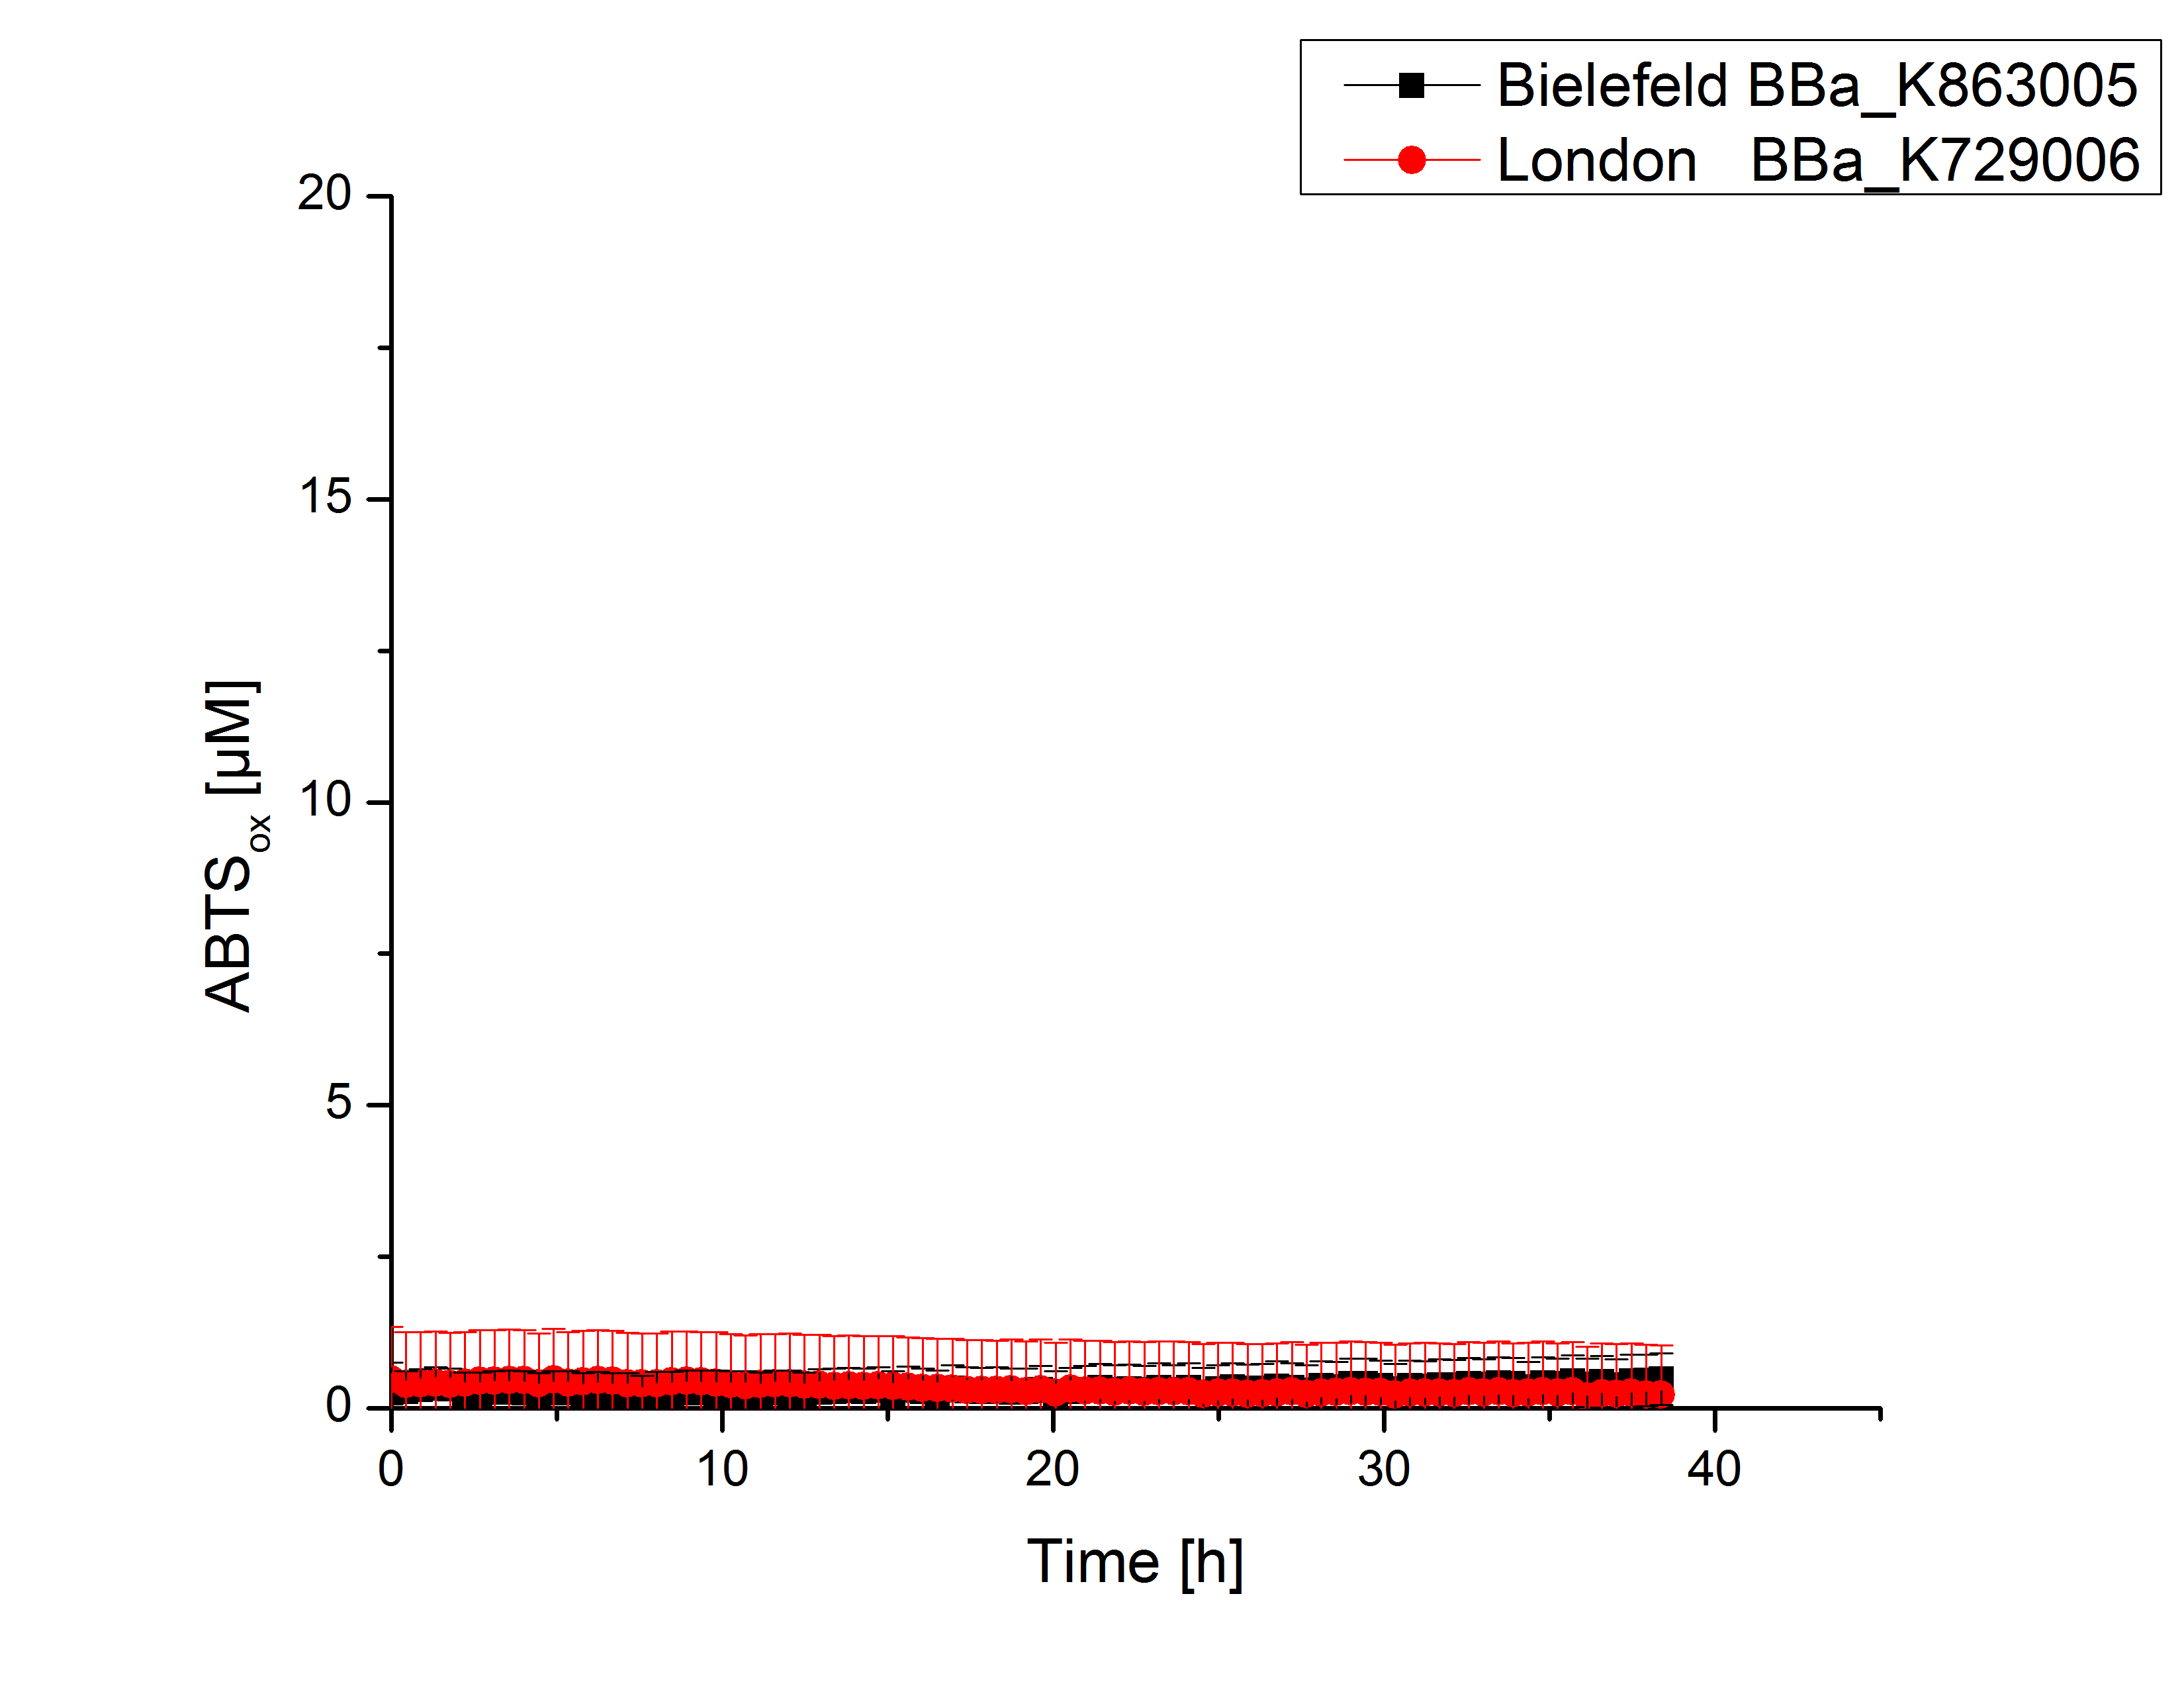
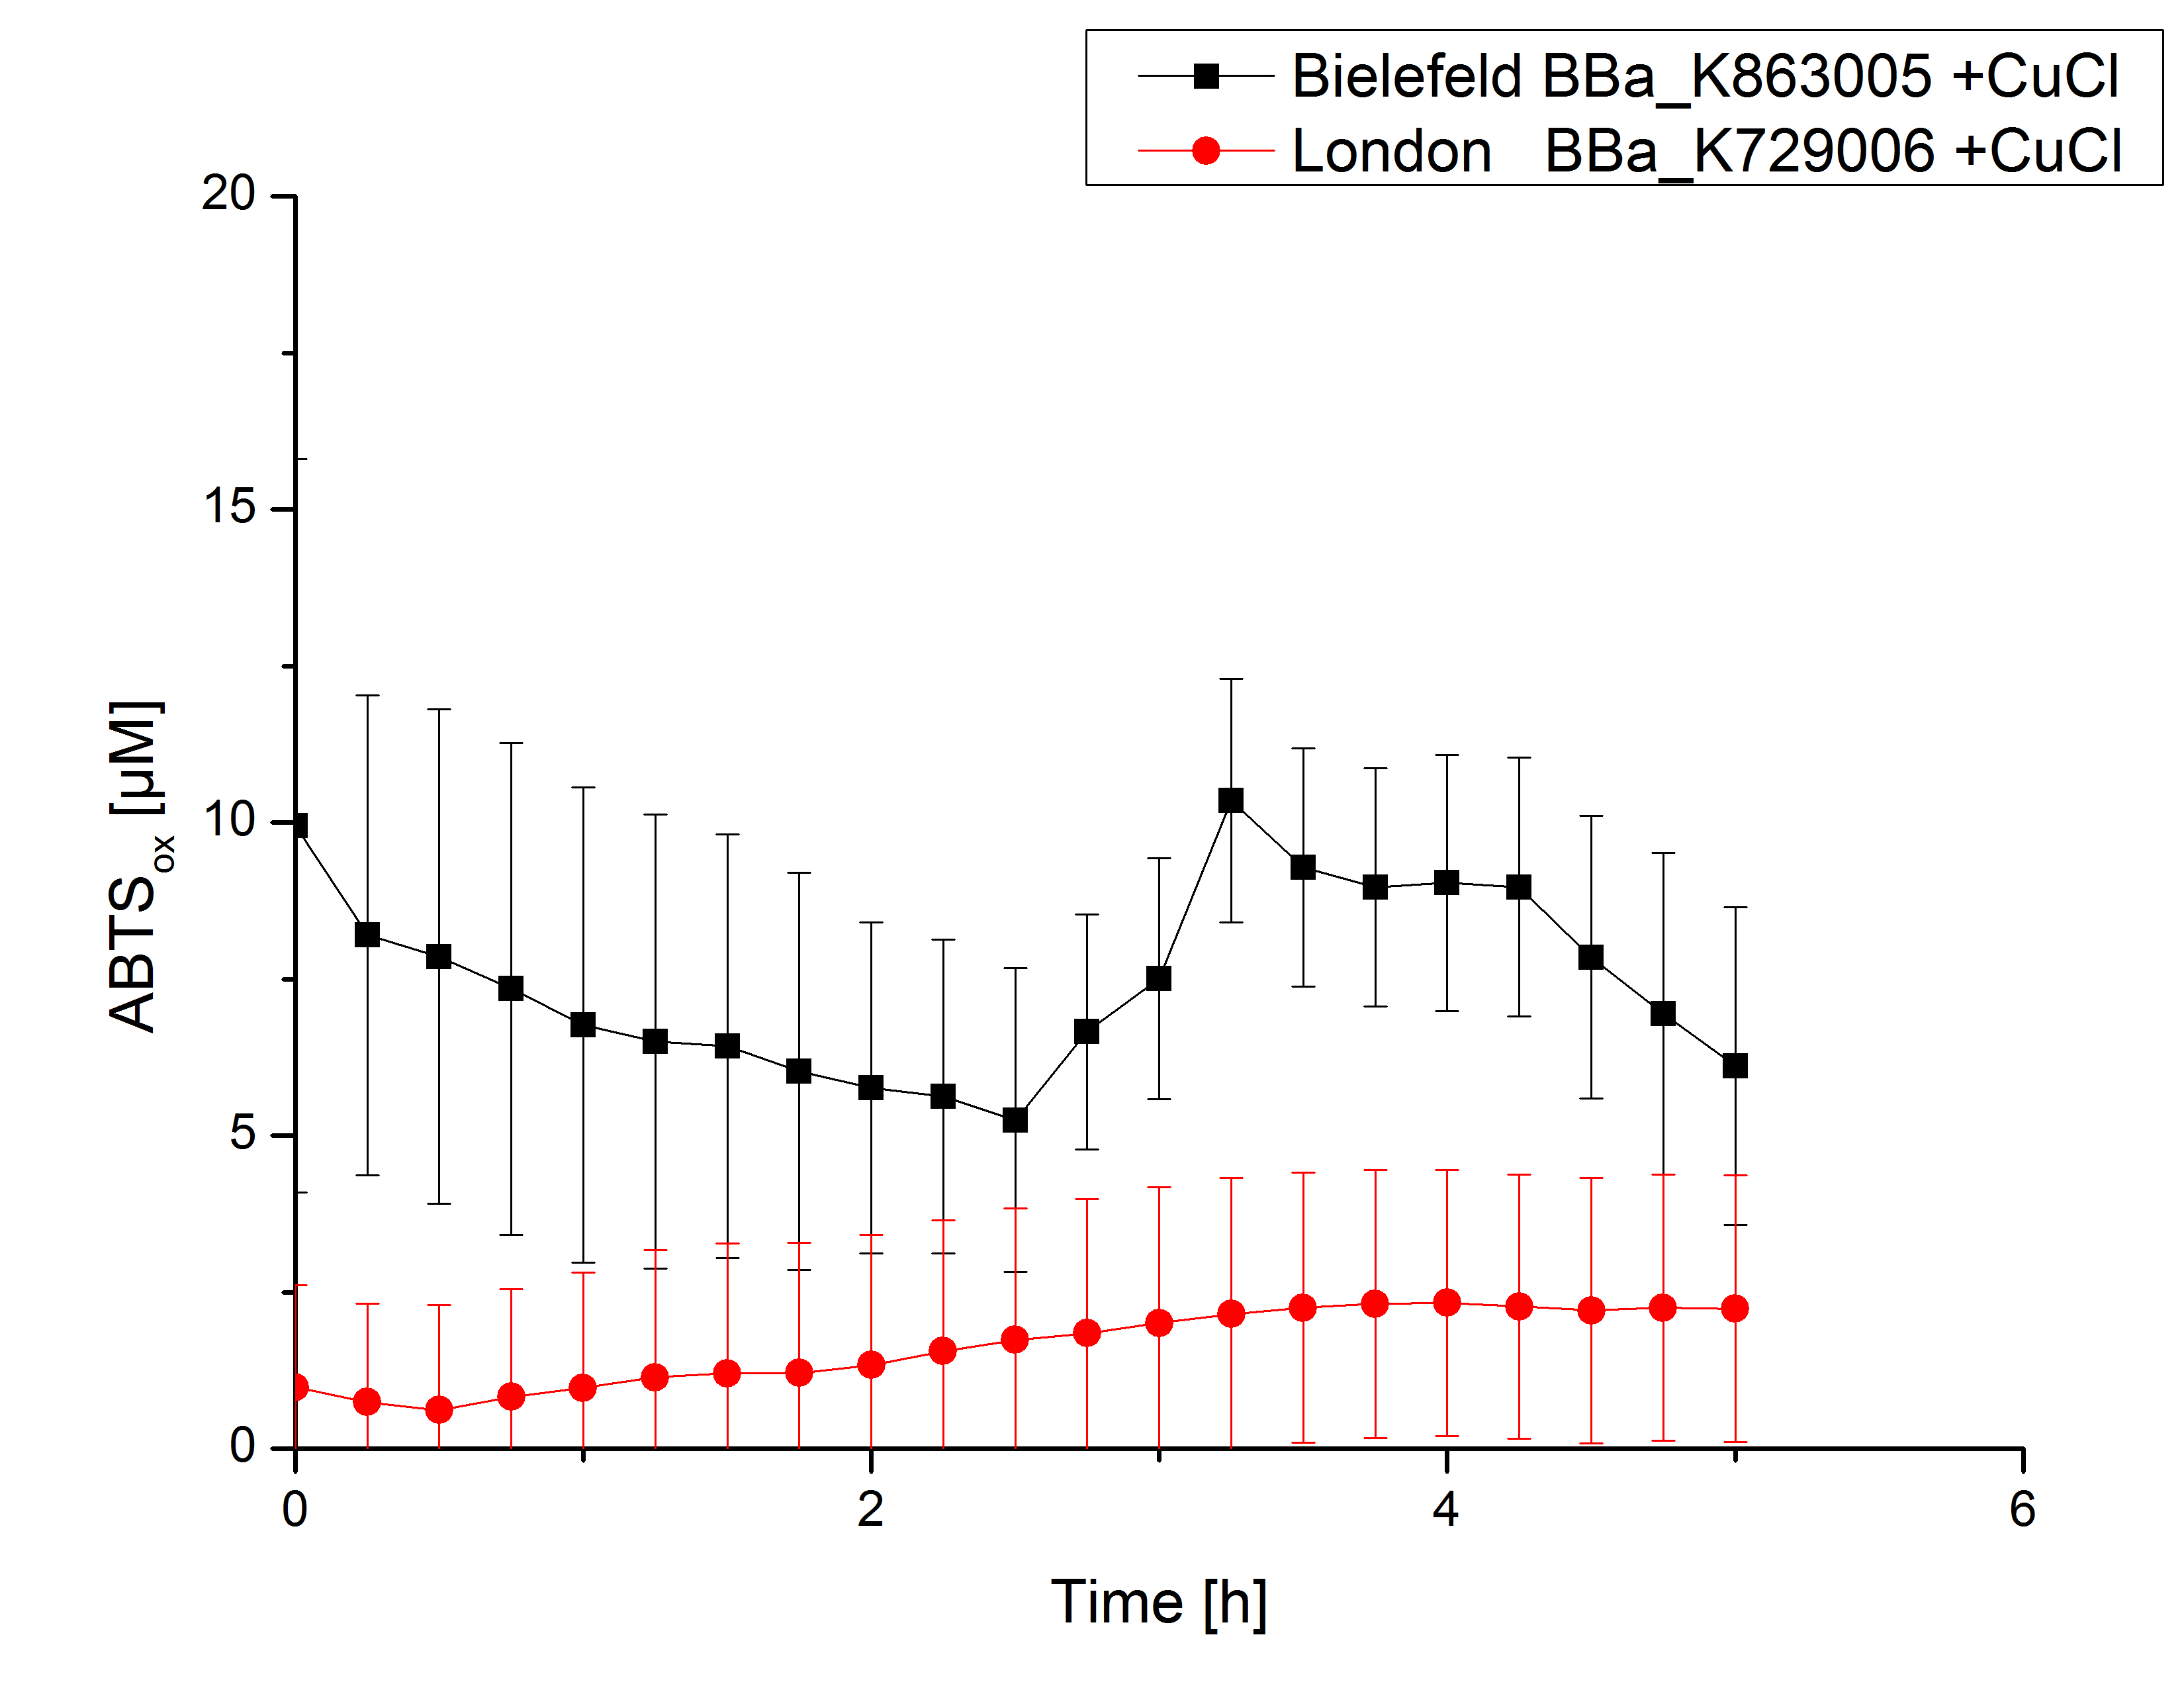
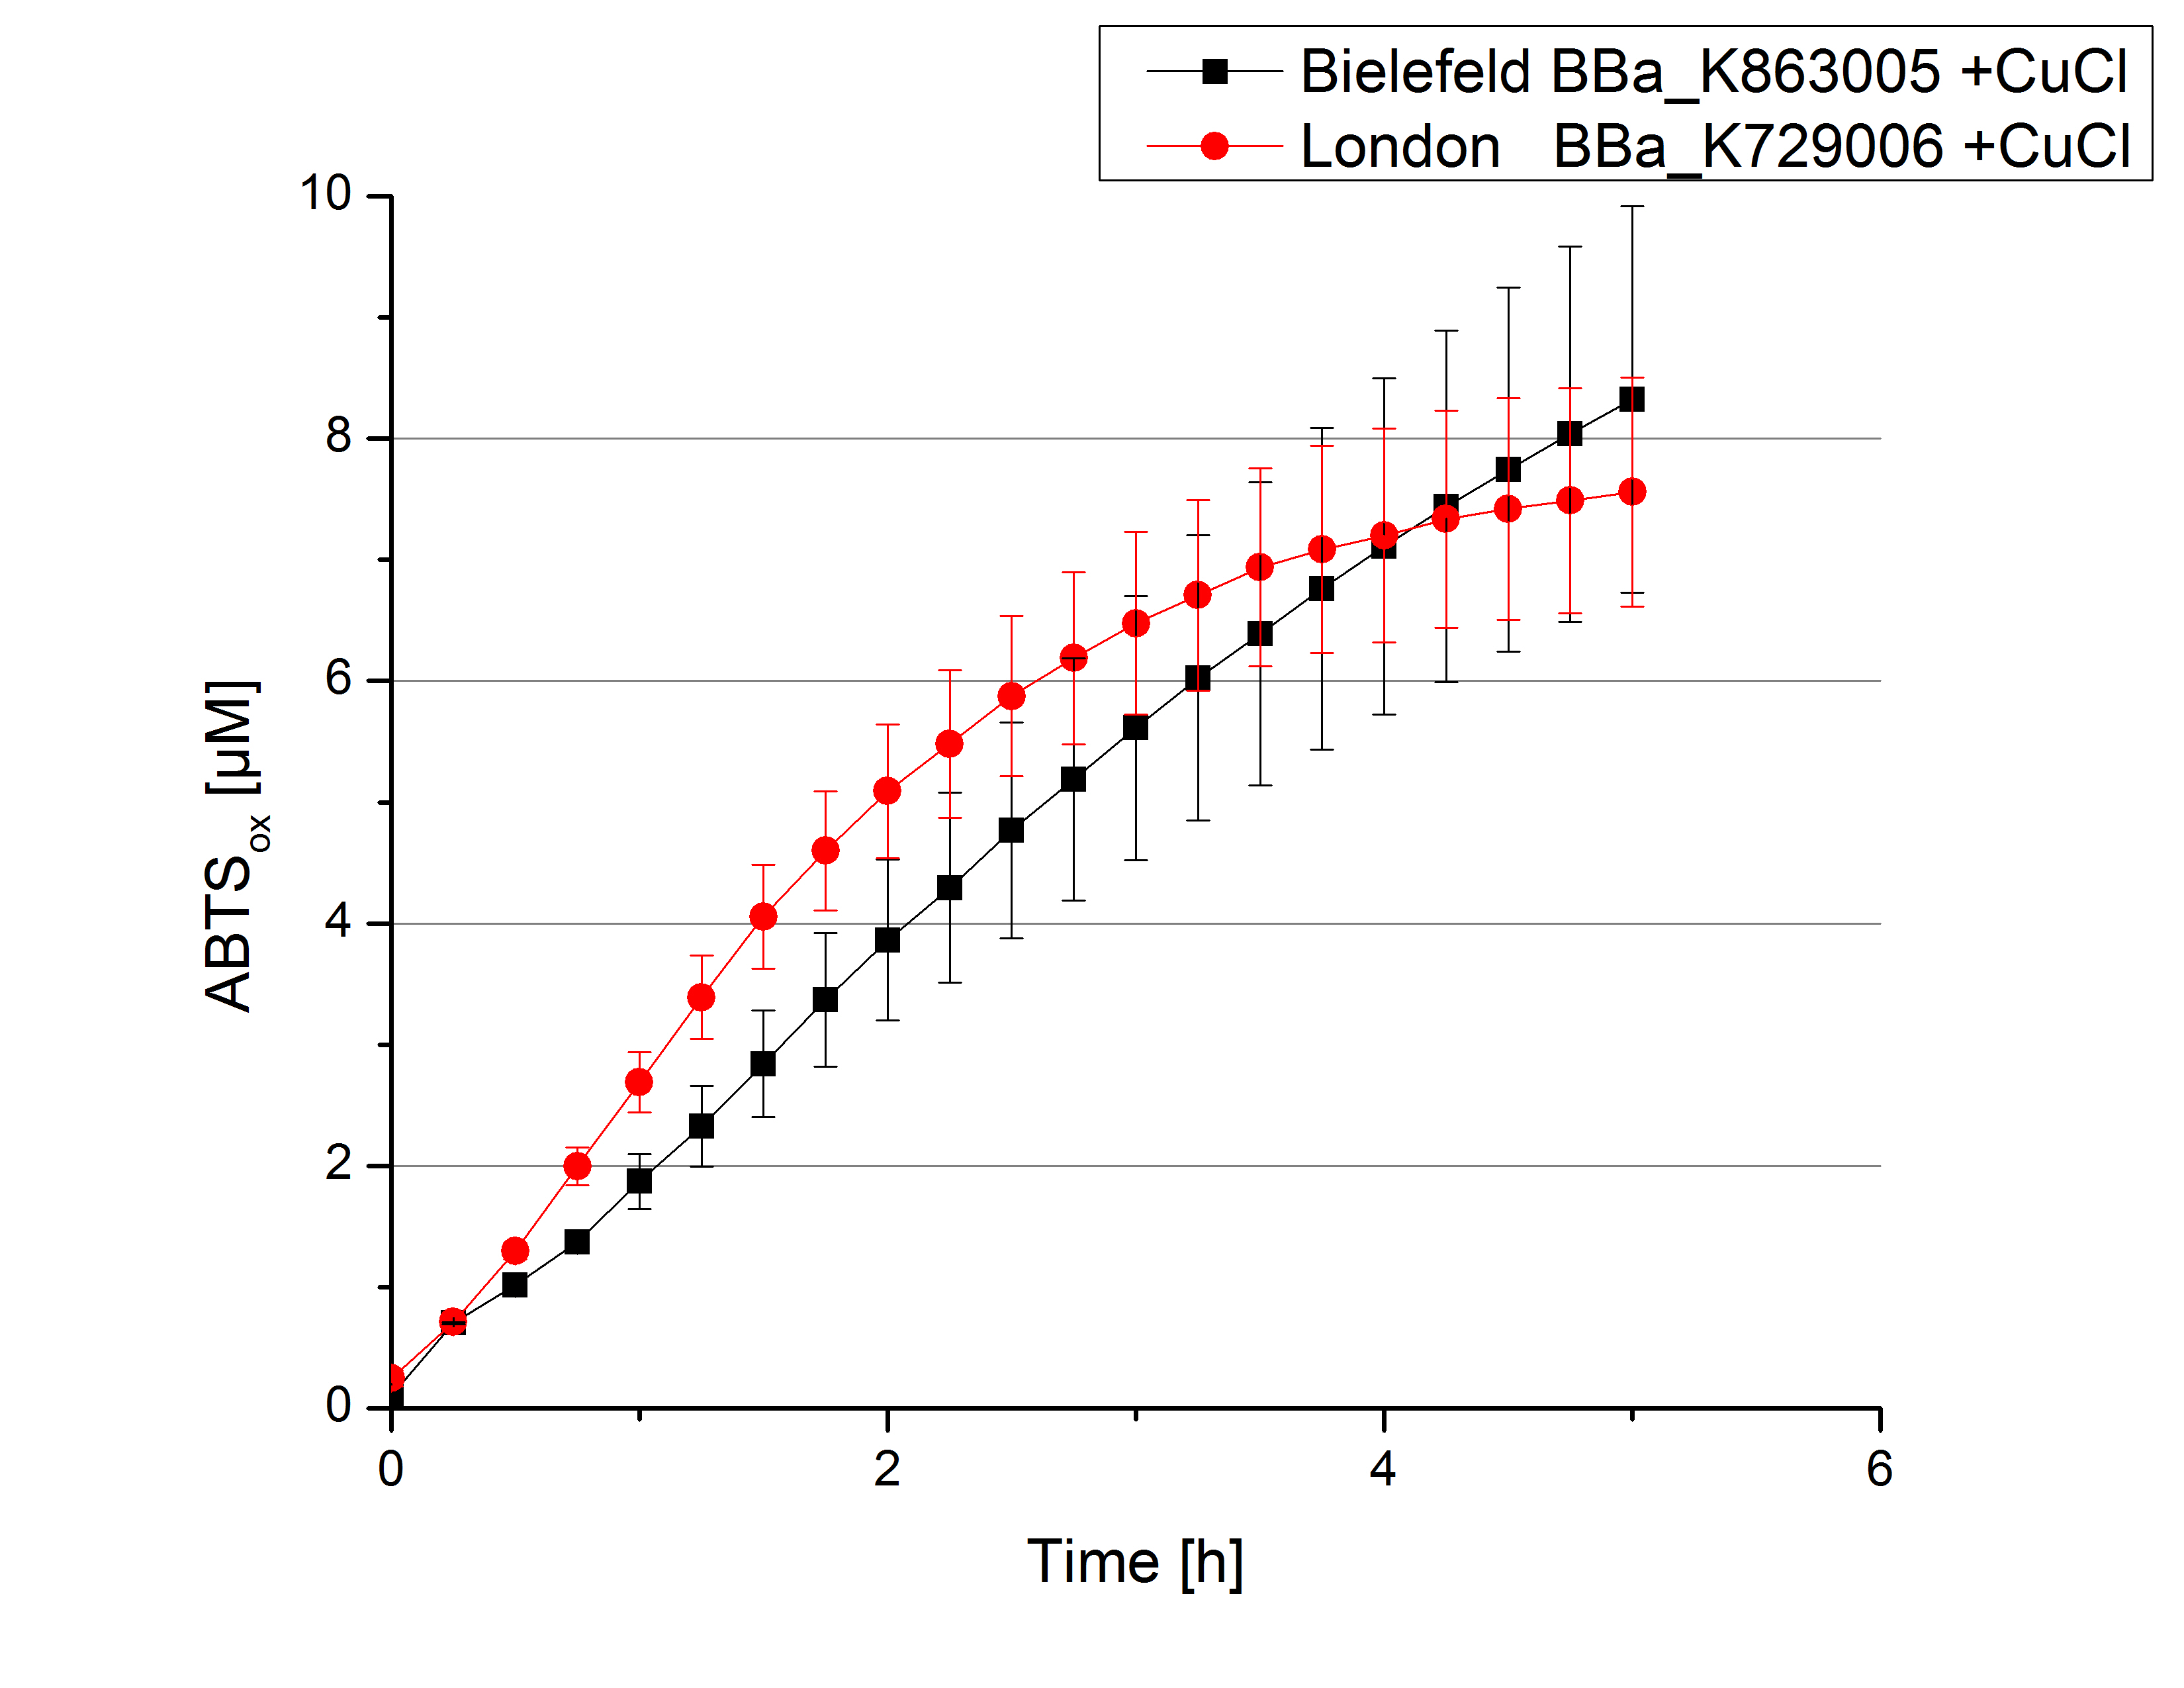
Expecting the laccase in the supernatant of the lysed cell samples, the activity testswas done by using 198 µL of the sample and 2 µL ABTS. Since laccases are capable of oxidzing ABTS the activity of laccases can be detected through measuring the absorption of oxidized ABTS at 420 nm. As positive control a E. coli KRX containing <partinfo>K863005</partinfo>, which was already characterized, was measured too. Using this approach there was no detectable activity over a period of 40 minutes (see figure 4). To gain some activity i the samples were incubated with 0.4 mM CuCl2 for at least 2 hours. After incubation time another setting was started using 198 µL of the samples containing <partinfo>K729002</partinfo> and <partinfo>K863005</partinfo> and applied 0.01 mM ABTS. The measurements lasted for 5 hours but the results did not show a decrease in oxidized ABTS again (see figure 5). We figured out that contaminants in the samples, e.g. salts, low molecular agents, could affect the activity of the tested laccases. The samples were rebuffered into deionized H2O using HiTrap Desalting Columns and then again incubated with 0.4 mM CuCl2 for 2 hours. This time the measurement setup differed because no buffer remained in the samples. The new measurements were done with 100 mM sodium acetate buffer (pH 5), 158 µL sample and 0.01 mM ABTS for 5 hours at a temperature of 25°C. This preparation of the samples led to oxidizing activity of the laccases and therefore to an increase in oxidized ABTS (see figure 6). After 5 hours both laccases, <partinfo>K729002</partinfo> and <partinfo>K863005</partinfo>, showed great activity and had oxidized ~8 µM ABTS. Since both laccases derive from the same organism they both show a similar reaction behavior.
PCIL - Laccase from Pycnoporus cinnabarinus
TVEL5 - Laccase from Trametes versicolor
TVEL10 - Laccase from Trametes versicolor
TVEL13 - Laccase from Trametes versicolor
TVEL20 - Laccase from Trametes versicolor
| 55px | | | | | | | | | | |
sup>+/partinfo> of the iGEM team of University College of London. The transformed cells were used to characterize the BioBrick by cultivation and activity test. The E. coli KRX containing
 "
"


