Team:University College London/Module 4/Results
From 2012.igem.org
(Difference between revisions)
Sednanalien (Talk | contribs) (→Characterisation of Starvation Promoter BBa_K118011) |
(→Characterisation of Starvation Promoter BBa_K118011) |
||
| Line 5: | Line 5: | ||
== Characterisation of Starvation Promoter BBa_K118011 == | == Characterisation of Starvation Promoter BBa_K118011 == | ||
| + | |||
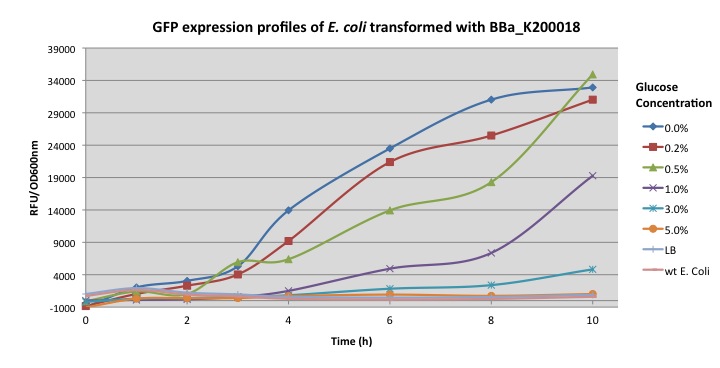
| + | Normalized expression levels were plotted as relative fluorescent units per optical density at 600 nm. E. coli carrying BBa_K200018 was grown in minimal M9 media supplemented with different glucose concentrations (0%, 0.2%, 0.5%, 1.0%, 3%, 5%). | ||
[[File:UniversityCollegeLondon_Buoyancy_K200018.jpg]] | [[File:UniversityCollegeLondon_Buoyancy_K200018.jpg]] | ||
| + | |||
| + | |||
[[File:UniversityCollegeLondon_Buoyancy_K729008.jpg]] | [[File:UniversityCollegeLondon_Buoyancy_K729008.jpg]] | ||
[[File:UniversityCollegeLondon_Buoyancy_Comparison.jpg]] | [[File:UniversityCollegeLondon_Buoyancy_Comparison.jpg]] | ||
Revision as of 12:53, 26 September 2012
Module 4: Buoyancy
Description | Design | Construction | Characterisation | Modelling | Results | Conclusions
Characterisation of Starvation Promoter BBa_K118011
Normalized expression levels were plotted as relative fluorescent units per optical density at 600 nm. E. coli carrying BBa_K200018 was grown in minimal M9 media supplemented with different glucose concentrations (0%, 0.2%, 0.5%, 1.0%, 3%, 5%).
 "
"


