Team:University College London/Module 4/Modelling
From 2012.igem.org
Erinoerton (Talk | contribs) (→Modelling) |
Sednanalien (Talk | contribs) (→Modelling) |
||
| Line 17: | Line 17: | ||
[[File:buoygraph1.png]] | [[File:buoygraph1.png]] | ||
| + | |||
Graph represents the GFP accummulation through time when is controlled by cstA promoter | Graph represents the GFP accummulation through time when is controlled by cstA promoter | ||
[[File:buoygraph2.png]] | [[File:buoygraph2.png]] | ||
| + | |||
The green line represents GFP expression levels and the blue line shows the T7 RNAP concentration over time. GFP production is considerably higher than in the previous model. | The green line represents GFP expression levels and the blue line shows the T7 RNAP concentration over time. GFP production is considerably higher than in the previous model. | ||
{{:Team:University_College_London/templates/foot}} | {{:Team:University_College_London/templates/foot}} | ||
Revision as of 09:48, 26 September 2012
Module 4: Buoyancy
Description | Design | Construction | Characterisation | Modelling | Results | Conclusions
Modelling
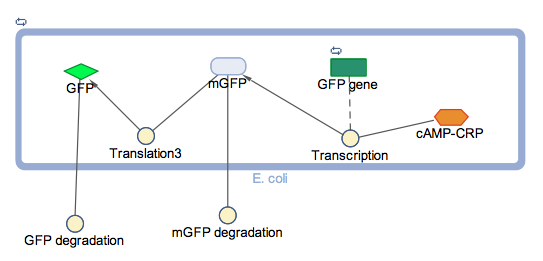
The block diagram shows the module where GFP expression is control by cstA promoter; the expression is triggered under low glucose concentrations.
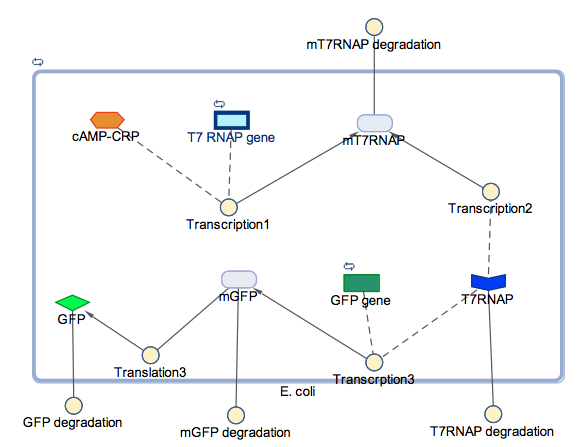
In the models the environmental sensitive promoters (cstA) is activated by carbon starvation stress, then the mRNA encoding T7 RNA polymerase is transcribed, whose protein binds the T7 promoter driving the expression of the the reporter output (GFP).
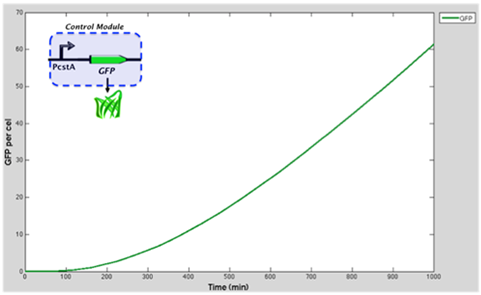
Graph represents the GFP accummulation through time when is controlled by cstA promoter
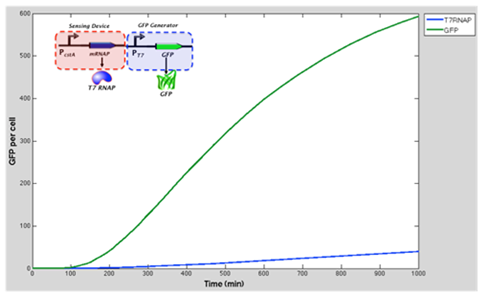
The green line represents GFP expression levels and the blue line shows the T7 RNAP concentration over time. GFP production is considerably higher than in the previous model.
 "
"


