Team:University College London/Module 4/Results
From 2012.igem.org
(→Characterisation of Starvation Promoter BBa_K118011) |
(→Expression Essays) |
||
| (8 intermediate revisions not shown) | |||
| Line 4: | Line 4: | ||
{{:Team:University_College_London/templates/module4menu}} | {{:Team:University_College_London/templates/module4menu}} | ||
| - | == | + | ==Expression Essays== |
| - | Normalized expression levels were plotted as relative fluorescent units per optical density at 600 nm. E. coli | + | Normalized expression levels were plotted as relative fluorescent units per optical density at 600 nm. Transformed ''E. coli'' was grown overnight in LB media and then transferred into minimal M9 media supplemented with different glucose concentrations (0%, 0.2%, 0.5%, 1.0%, 3%, 5%) to induce the activation of the cstA promoter. |
| - | [[File:UniversityCollegeLondon_Buoyancy_K200018.jpg]] | + | [[File:UniversityCollegeLondon_Buoyancy_K200018.jpg|center]] |
| - | + | ||
| - | + | The graph above show the further characterization of the pcstA fused with GFP (BBa_K200018) built by Imperial College's 2009 iGem team. Fluorescence was measured from overnight cultures and data collected shows significant higher expression for cultures with 0%, 0.2%, 0.5% glucose concentration, this essay also shows how glucose represses cstA promoter. | |
| - | + | ||
| - | [[File:UniversityCollegeLondon_Buoyancy_Comparison.jpg]] | + | |
| + | [[File:UniversityCollegeLondon_Buoyancy_K729008.jpg|center]] | ||
| + | |||
| + | |||
| + | This chart shows the fluorescence of GFP from module (BBa_K729008) that integrates the T7 RNA polymerase and T7 promoter in order to increase the expression of the reporter gene. Once the bacteria is exposed to carbon starvation stress, cstA promoter is activated, as a results it can be seen from the chart that GFP was expressed reaching higher accumulation in cultures with M9 media supplemented with less than 0.5% of glucose. | ||
| + | |||
| + | [[File:UniversityCollegeLondon_Buoyancy_Comparison.jpg|center]] | ||
| + | |||
| + | |||
| + | The chart shows GFP fluorescence profiles for different constructions. In order to demonstrate that our new biobrick increases the output production when using the cstA promoter and T7 RNA polymerase, we compared our results with other modules using minimal M9 media supplemented with 0.2% glucose: pcstA-GFP (BBa_K200018), pT7-GFP (BBa_I746909) and a constitutive promoter fused with GFP (BBa_I20260). From our results ''E. coli'' transformed with our module (BBa_K729008) demonstrated a 3 fold increase in GFP expression over the BBa_K200018 (pcstA-GFP) developed by Imperial College’s 2009 iGem team. | ||
Latest revision as of 01:25, 27 September 2012
Module 4: Buoyancy
Description | Design | Construction | Characterisation | Modelling | Results | Conclusions
Expression Essays
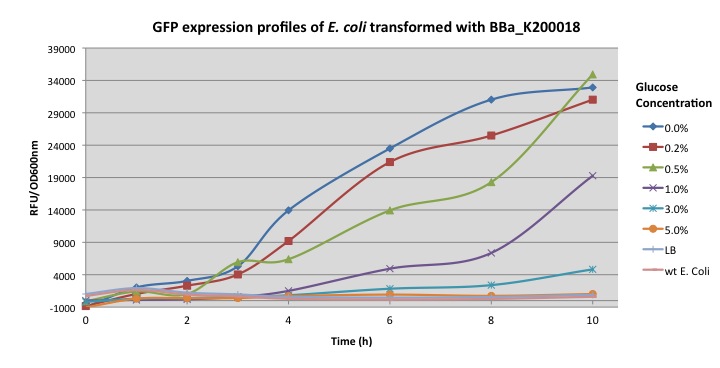
Normalized expression levels were plotted as relative fluorescent units per optical density at 600 nm. Transformed E. coli was grown overnight in LB media and then transferred into minimal M9 media supplemented with different glucose concentrations (0%, 0.2%, 0.5%, 1.0%, 3%, 5%) to induce the activation of the cstA promoter.
The graph above show the further characterization of the pcstA fused with GFP (BBa_K200018) built by Imperial College's 2009 iGem team. Fluorescence was measured from overnight cultures and data collected shows significant higher expression for cultures with 0%, 0.2%, 0.5% glucose concentration, this essay also shows how glucose represses cstA promoter.
This chart shows the fluorescence of GFP from module (BBa_K729008) that integrates the T7 RNA polymerase and T7 promoter in order to increase the expression of the reporter gene. Once the bacteria is exposed to carbon starvation stress, cstA promoter is activated, as a results it can be seen from the chart that GFP was expressed reaching higher accumulation in cultures with M9 media supplemented with less than 0.5% of glucose.
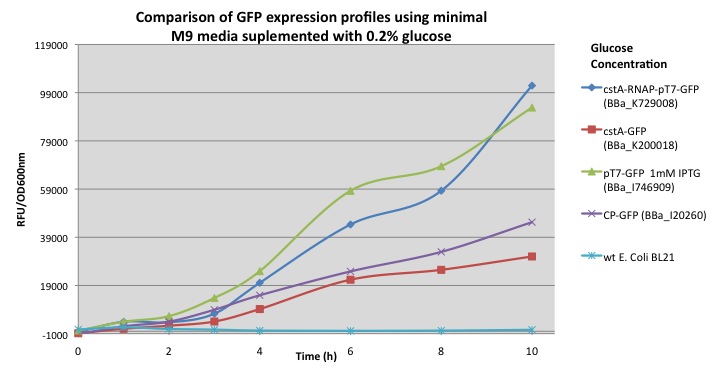
The chart shows GFP fluorescence profiles for different constructions. In order to demonstrate that our new biobrick increases the output production when using the cstA promoter and T7 RNA polymerase, we compared our results with other modules using minimal M9 media supplemented with 0.2% glucose: pcstA-GFP (BBa_K200018), pT7-GFP (BBa_I746909) and a constitutive promoter fused with GFP (BBa_I20260). From our results E. coli transformed with our module (BBa_K729008) demonstrated a 3 fold increase in GFP expression over the BBa_K200018 (pcstA-GFP) developed by Imperial College’s 2009 iGem team.
 "
"


