Team:Bielefeld-Germany/Results/trametis
From 2012.igem.org
(→Since Regionals: TVEL0 pH optimum) |
(→Since Regionals: TVEL0 pH optimum) |
||
| (13 intermediate revisions not shown) | |||
| Line 50: | Line 50: | ||
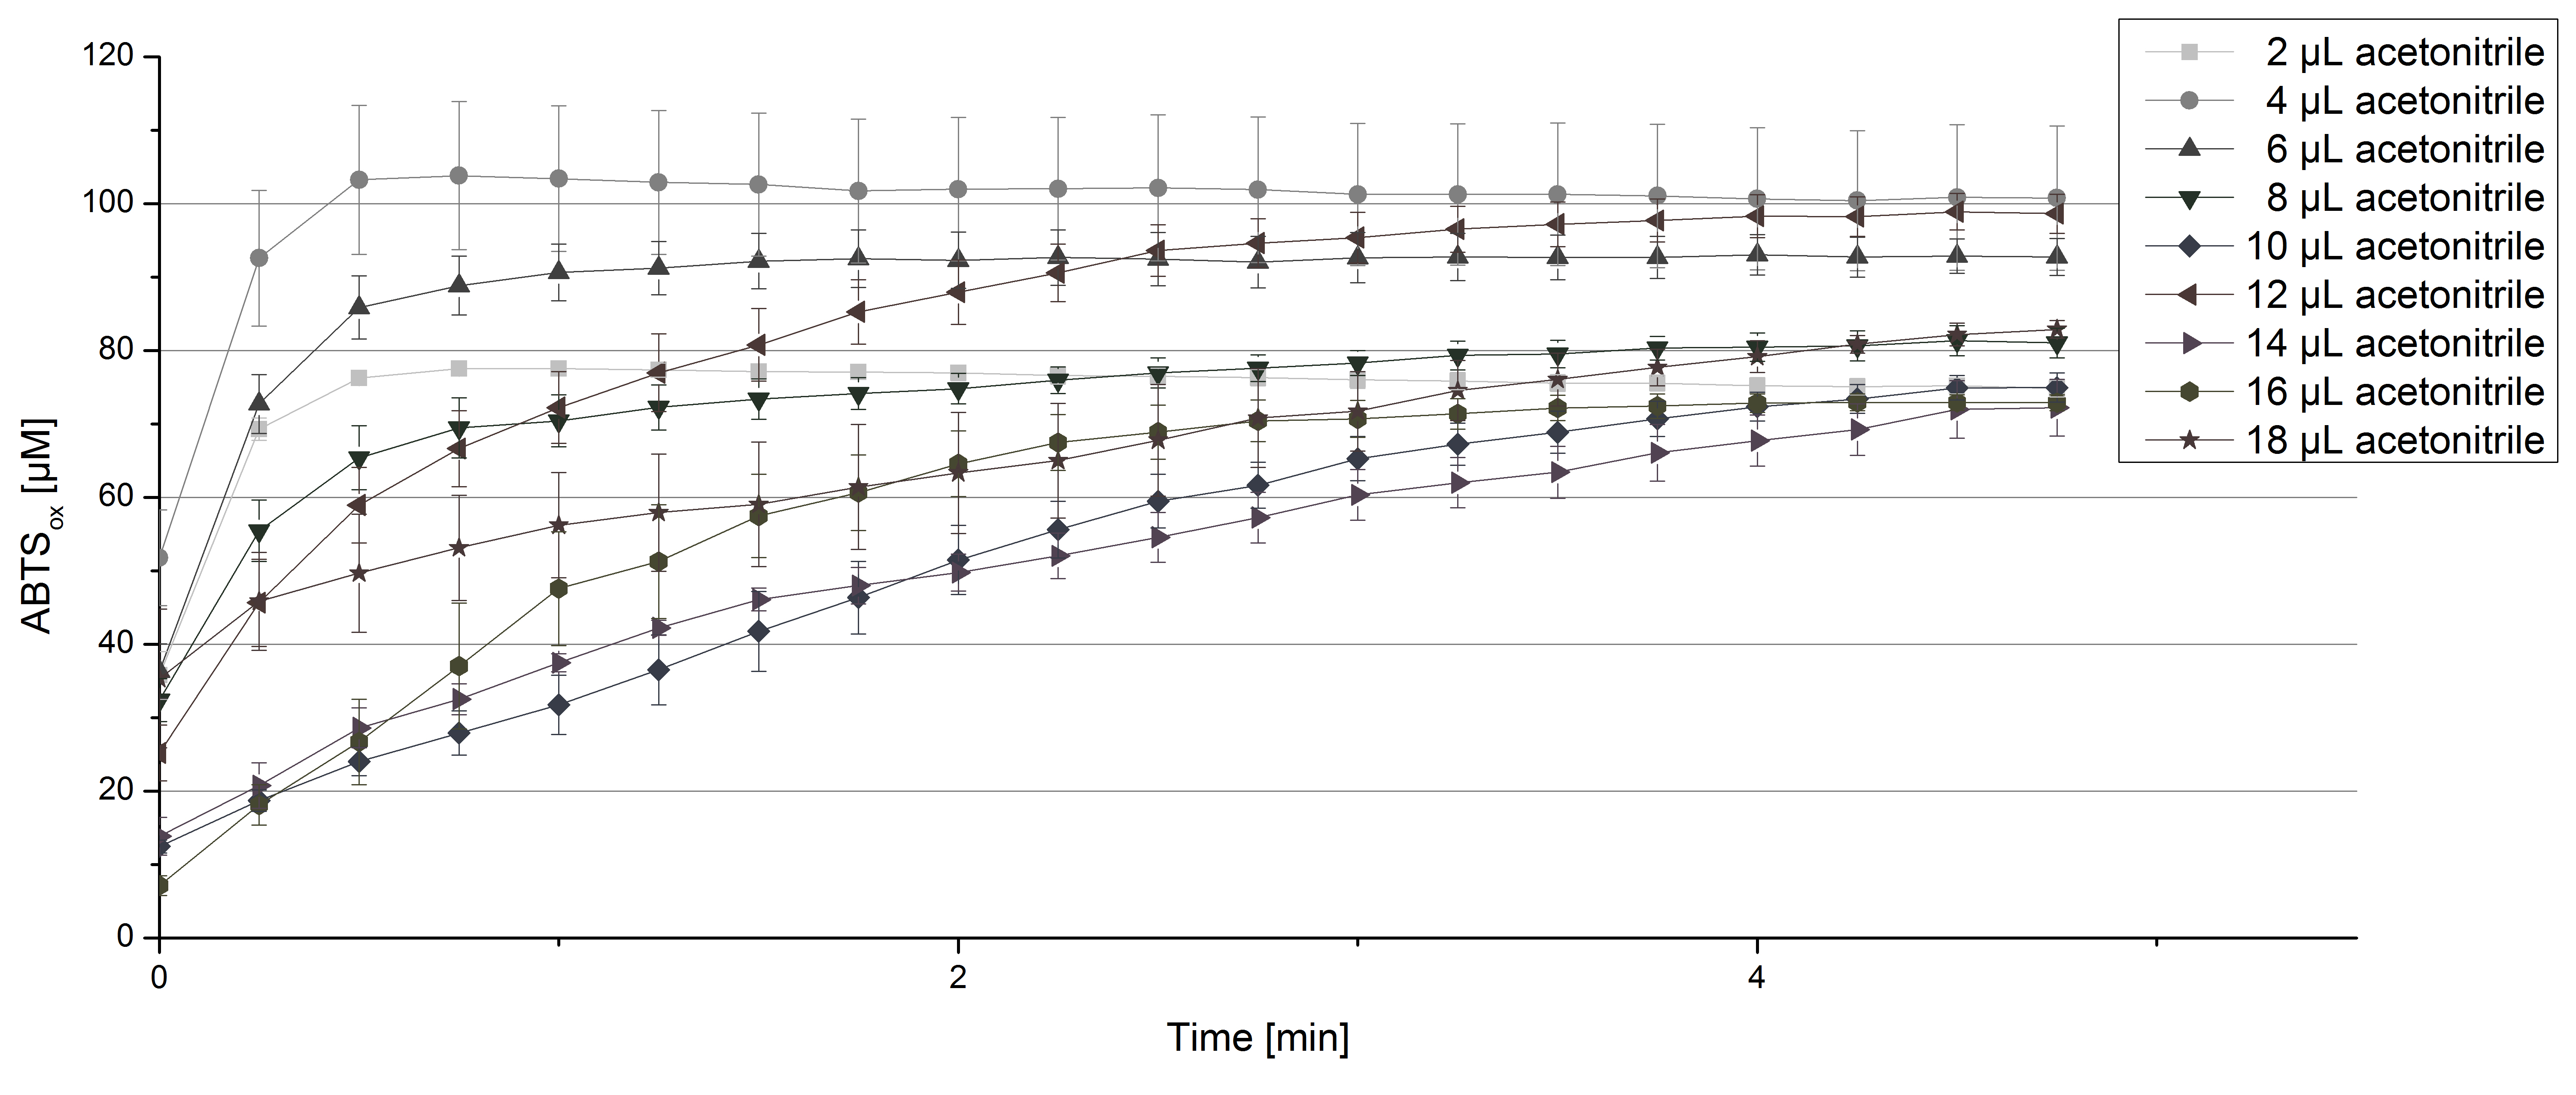
[[File:Bielefeld2012_TVEL0_acetonitrile1.jpg|thumbnail|600px|center|'''Figure 5:''' Activity test of 140 µL of 0.03 mg mL<sup>-1</sup> concentrated TVEL0 laccase solution, 0.1 mM ABTS and 100 mM sodium acetate buffer to a final volume of 200 µL and different amounts of acetonitrile. (n=4)]] | [[File:Bielefeld2012_TVEL0_acetonitrile1.jpg|thumbnail|600px|center|'''Figure 5:''' Activity test of 140 µL of 0.03 mg mL<sup>-1</sup> concentrated TVEL0 laccase solution, 0.1 mM ABTS and 100 mM sodium acetate buffer to a final volume of 200 µL and different amounts of acetonitrile. (n=4)]] | ||
| - | |||
=== Since Regionals: TVEL0 pH optimum === | === Since Regionals: TVEL0 pH optimum === | ||
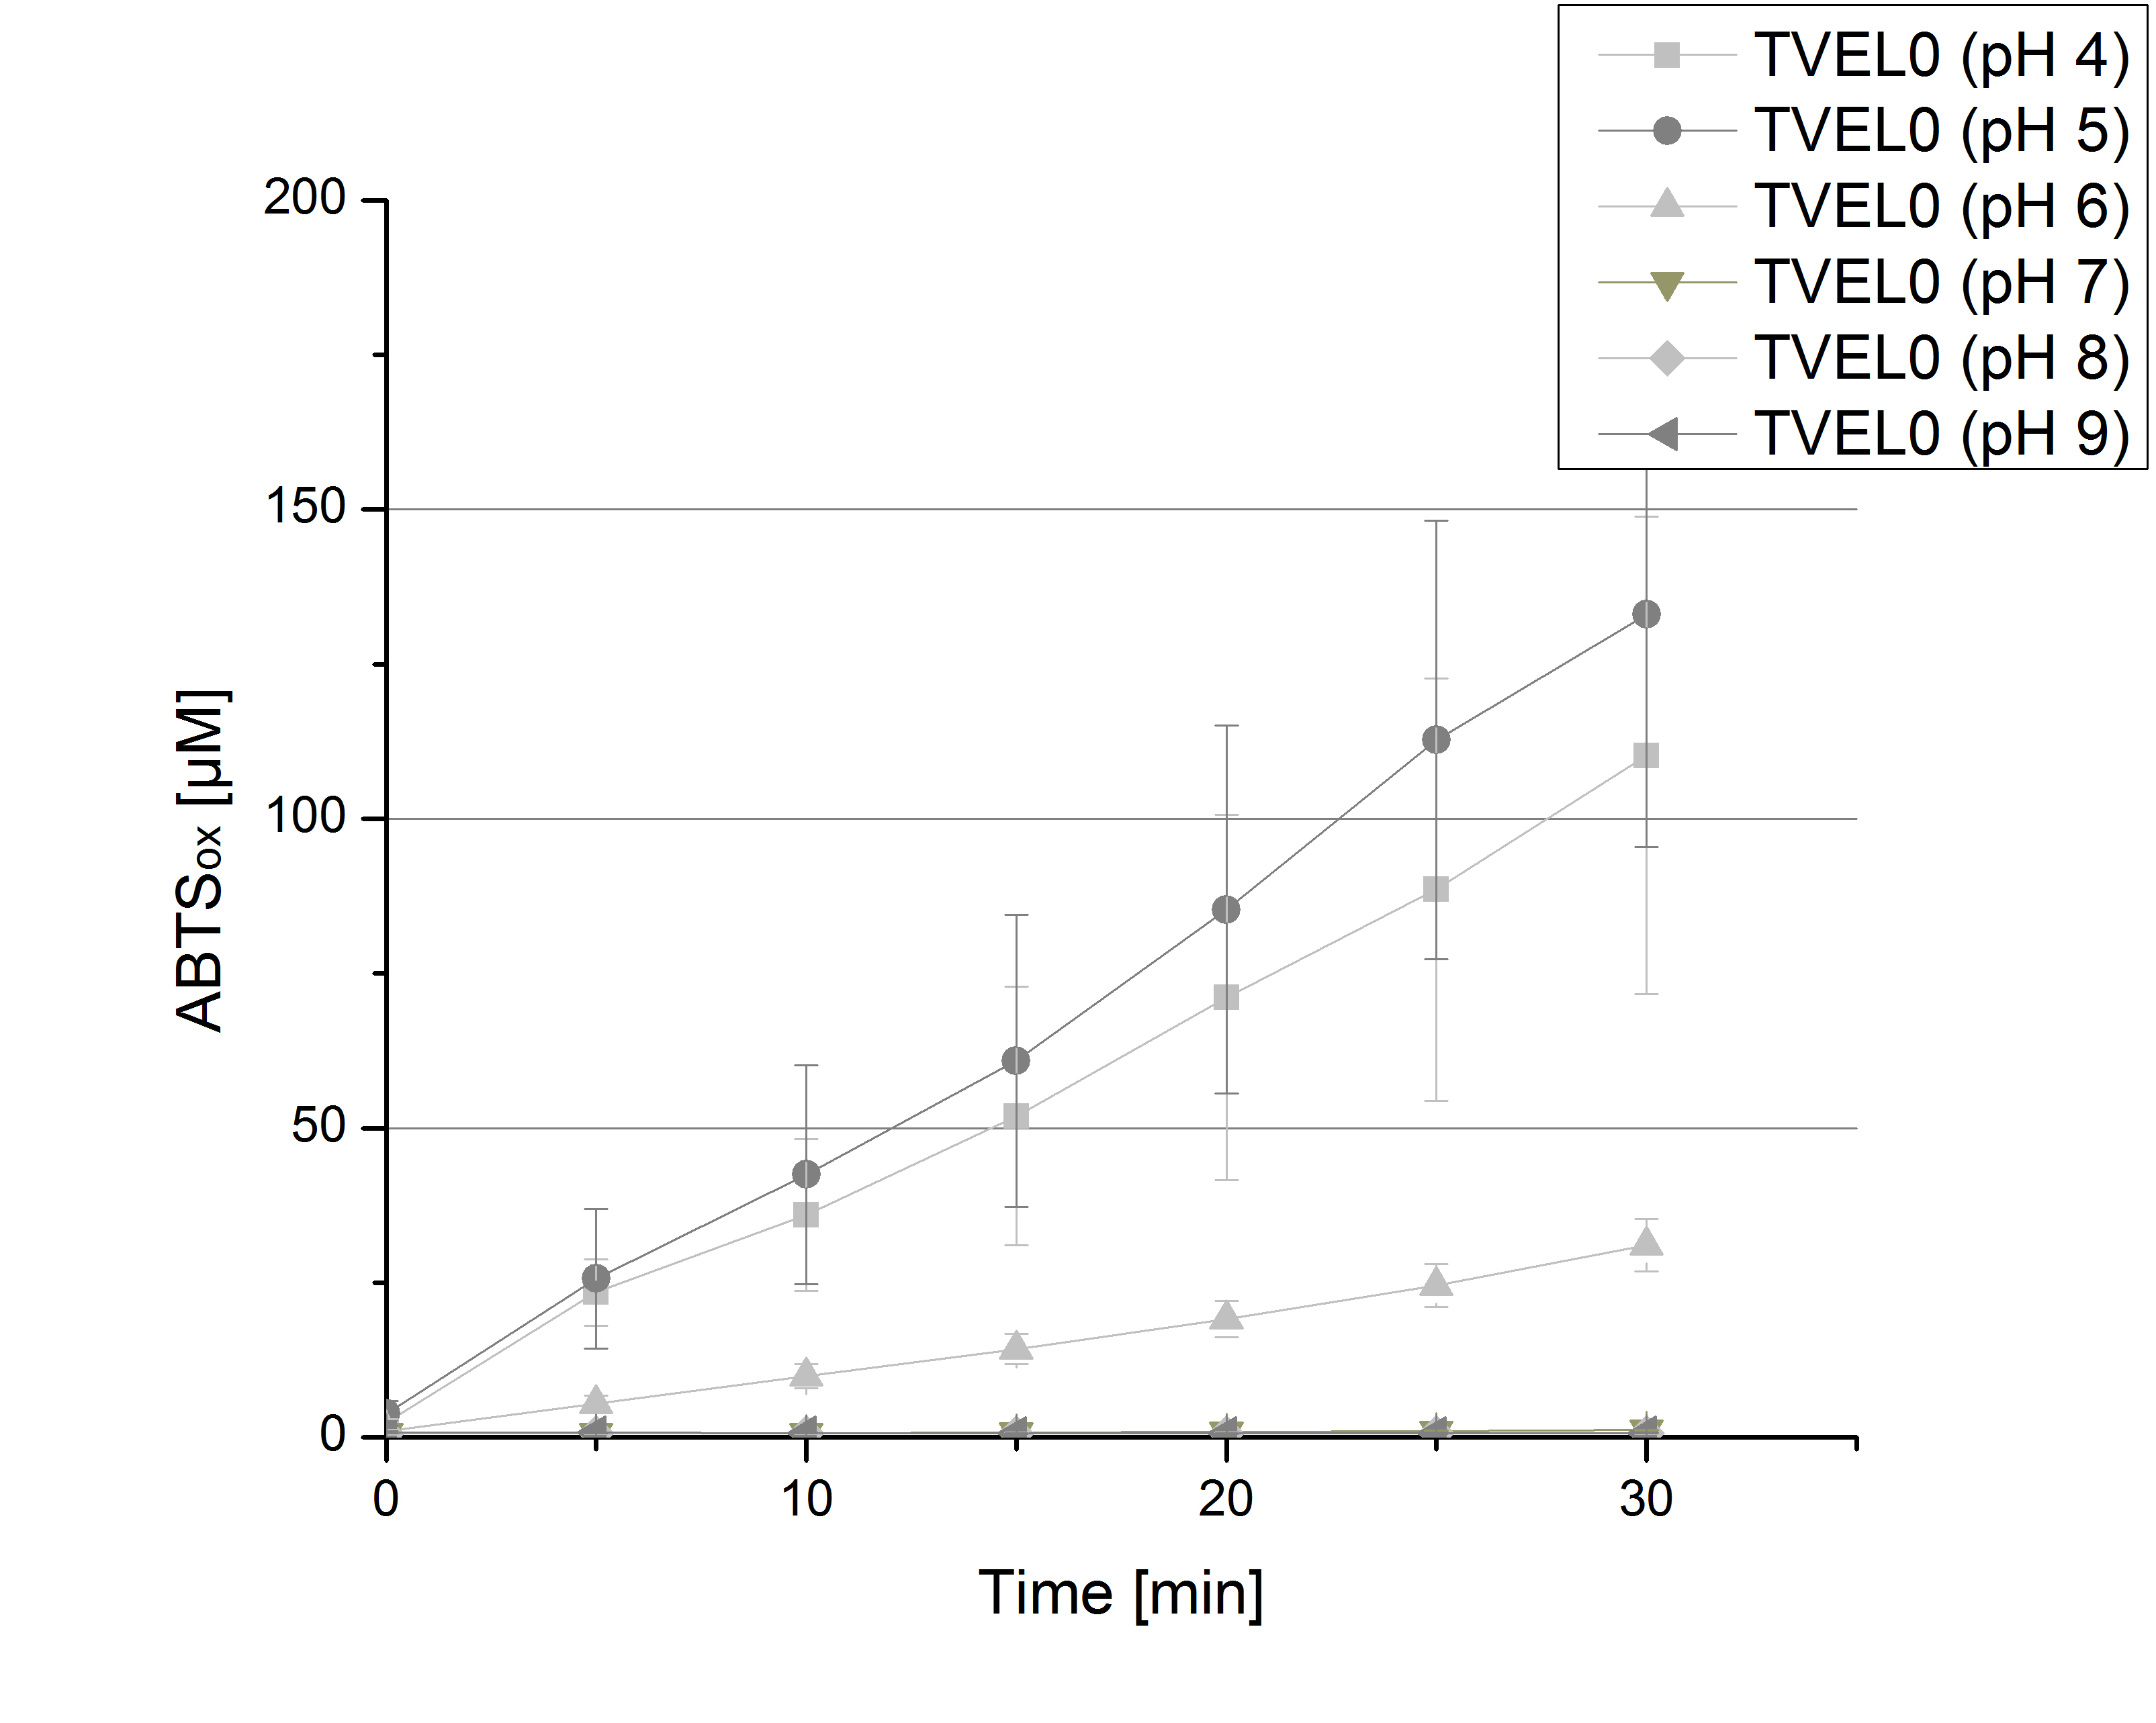
| - | [[File:Bielefeld2012 TVEL0 pH.jpg|thumb|left|200px|'''Figure | + | [[File:Bielefeld2012 TVEL0 pH.jpg|thumb|left|200px|'''Figure 6:''' Oxidized ABTS by TVEL0 at different pH adjustments. The experimental setup included CuCl<sub>2</sub> TVEL0 (308 ng), Britton Robinson buffer adjusted to the tested pHs and 5 mM ABTS. Measurements were done at 25 °C for 30 minutes. The highest amount of oxidized ABTS could be detected at pH 5.]] |
| - | [[File:Bielefeld2012 TVEL0 pH Units.jpg|thumb|200px|right|'''Figure | + | [[File:Bielefeld2012 TVEL0 pH Units.jpg|thumb|200px|right|'''Figure 7:''' Calculated specific enzyme activity of TVEL0 at different pH conditions. The highest specific enzyme activity for ABTS was under pH 4 and pH 5 conditions. The higher the pH, the less ABTS got oxidized. One unit is defined as the amount of laccase that oxidizes 1 μmol of ABTS substrate per minute.]] |
| - | To determine the optimal experimental setup for TVEL0 activity measurements, the best pH had to be determined. Using Britton-Robinson buffer pHs between pH 4 and pH 9 had been adjusted. 308 ng TVEL0 per well had been tested under these pH conditions using 5 mM ABTS. TVEL0 showed a high activity at pH 4 and pH 5, where most of ABTS was oxidized (compared to Fig. | + | To determine the optimal experimental setup for TVEL0 activity measurements, the best pH had to be determined. Using Britton-Robinson buffer pHs between pH 4 and pH 9 had been adjusted. 308 ng TVEL0 per well had been tested under these pH conditions using 5 mM ABTS. TVEL0 showed a high activity at pH 4 and pH 5, where most of ABTS was oxidized (compared to Fig. 6 and 7). The calculated specific enzyme activity of TVEL0 showed high activity at both mentioned pHs (Fig. 7). While TVEL0 had an activity of ~12 U mg<sup>-1</sup> at pH 4 and pH 5, the enzyme activity decreased at higher pHs. At a pH of 6 only 1/4 of enzyme activity could be detected compared to the activity at pH 4 and pH 5. This results help us to compare our produced enzymes with TVEL0 as a standard. |
| + | <br><br><br><br> | ||
=== Since Regionals: TVEL0 activity at different temperatures === | === Since Regionals: TVEL0 activity at different temperatures === | ||
| - | [[File:Bielefeld2012 TVEL0 Temp ABTSox.jpg|left|200px|thumb|'''Figure | + | [[File:Bielefeld2012 TVEL0 Temp ABTSox.jpg|left|200px|thumb|'''Figure 8:''' Standard activity test for TVEL0 measured at 10 °C and 25 °C resulting in a slighty decreased activity at 10 °C. As a negative control the impact of 0.4 mM CuCl<sub>2</sub> in oxidizing ABTS at 10 °C and 25 °C was analyzed.]] |
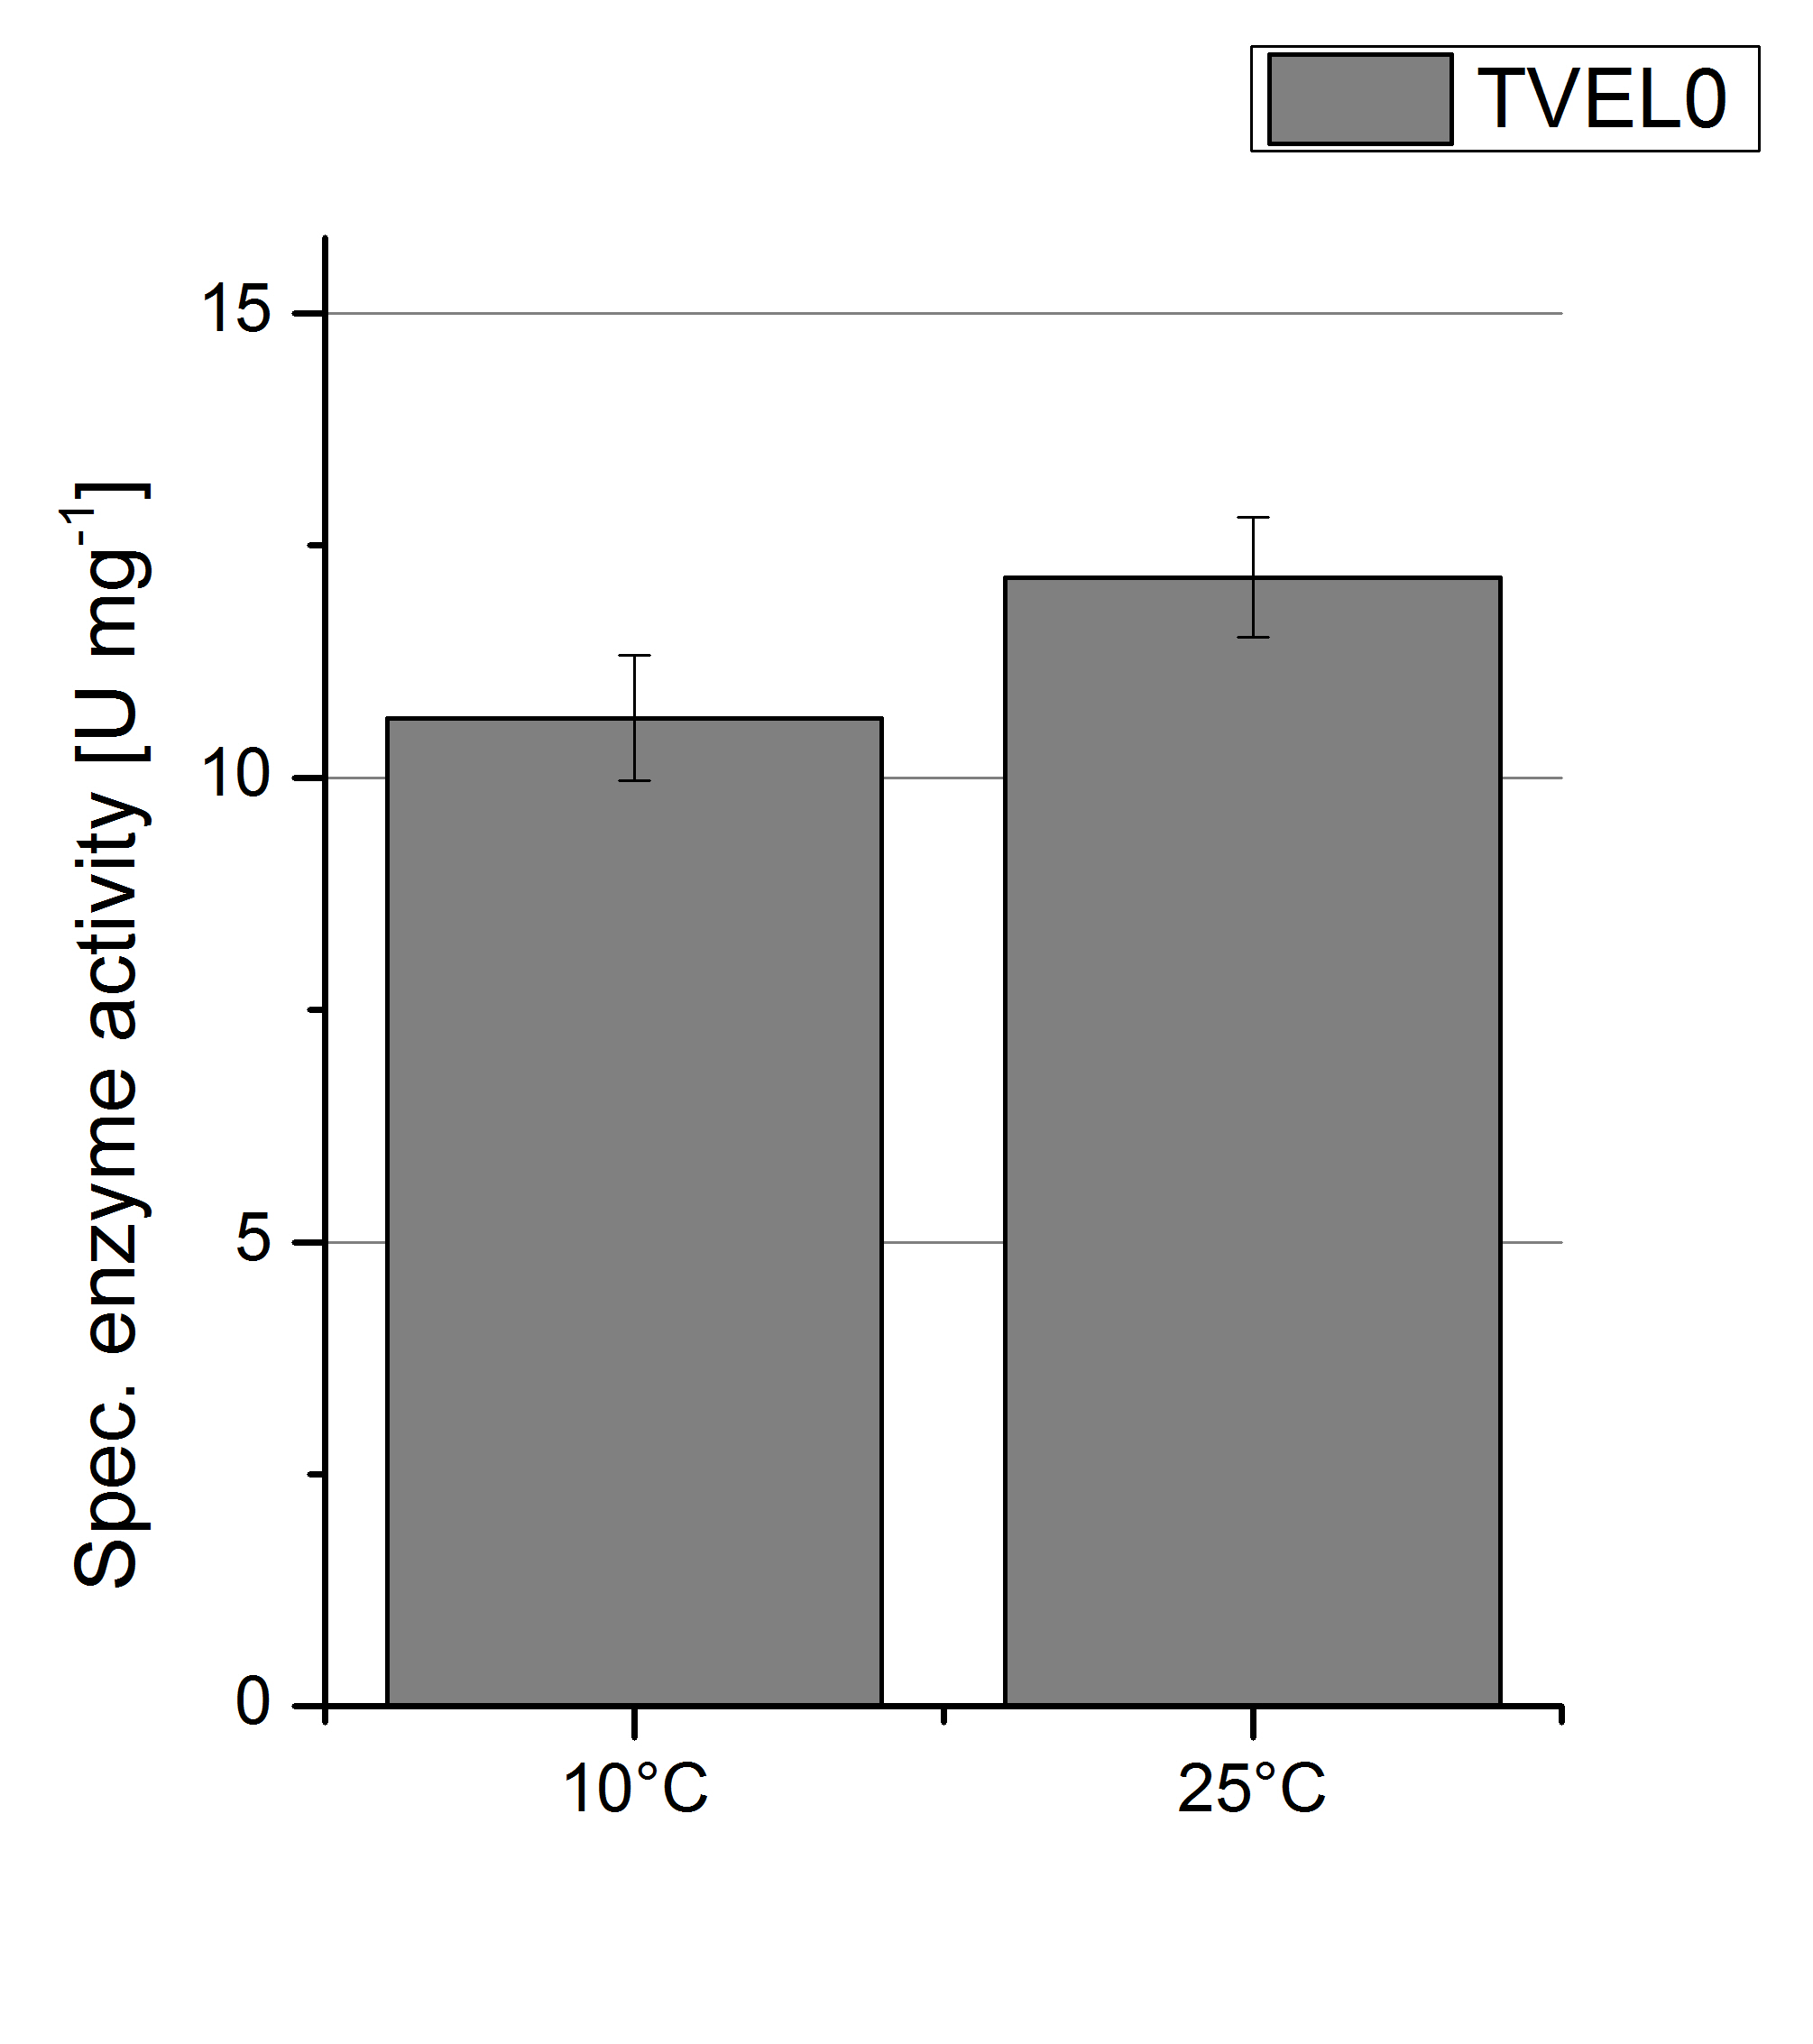
| - | [[File:Bielefeld2012 TVEL0 Temp Units.jpg|right|200px|thumb|'''Figure | + | [[File:Bielefeld2012 TVEL0 Temp Units.jpg|right|200px|thumb|'''Figure 9:''' Deriving from the obtained values of oxidized ABTS in time at 10 °C and 25 °C the specific enzyme activity was calculated. For the temperatures a difference of only 2 U mg<sup>-1</sup> could be detected. One unit is defined as the amount of laccase that oxidizes 1 μmol of ABTS substrate per minute.]] |
| - | To investigate the activity of TVEL0 at temperatures that will apply at a waste water treatment plant throughout the year, activity tests were performed at 10 °C and 25 °C as described above. The measurements were conducted for 30 minutes. The obtained results revealed a lower activity of TVEL0 at 10 °C in comparison to 25 °C (see Fig. | + | To investigate the activity of TVEL0 at temperatures that will apply at a waste water treatment plant throughout the year, activity tests were performed at 10 °C and 25 °C as described above. The measurements were conducted for 30 minutes. The obtained results revealed a lower activity of TVEL0 at 10 °C in comparison to 25 °C (see Fig. 8). The obtained results were used to calculate the specific enzyme activity which was at 11 and 13 U mg<sup>-1</sup>, respectively (see Figure 9). The negative control without TVEL0 but 0.4 mM CuCl<sub>2</sub> at 10 °C and 25 °C showed a negligible oxidation of ABTS. The activity of TVEL0 was increased to about 84 % at 10 °C. |
<br><br><br><br> | <br><br><br><br> | ||
<br style="clear: both" /> | <br style="clear: both" /> | ||
| Line 67: | Line 67: | ||
===Immobilisation=== | ===Immobilisation=== | ||
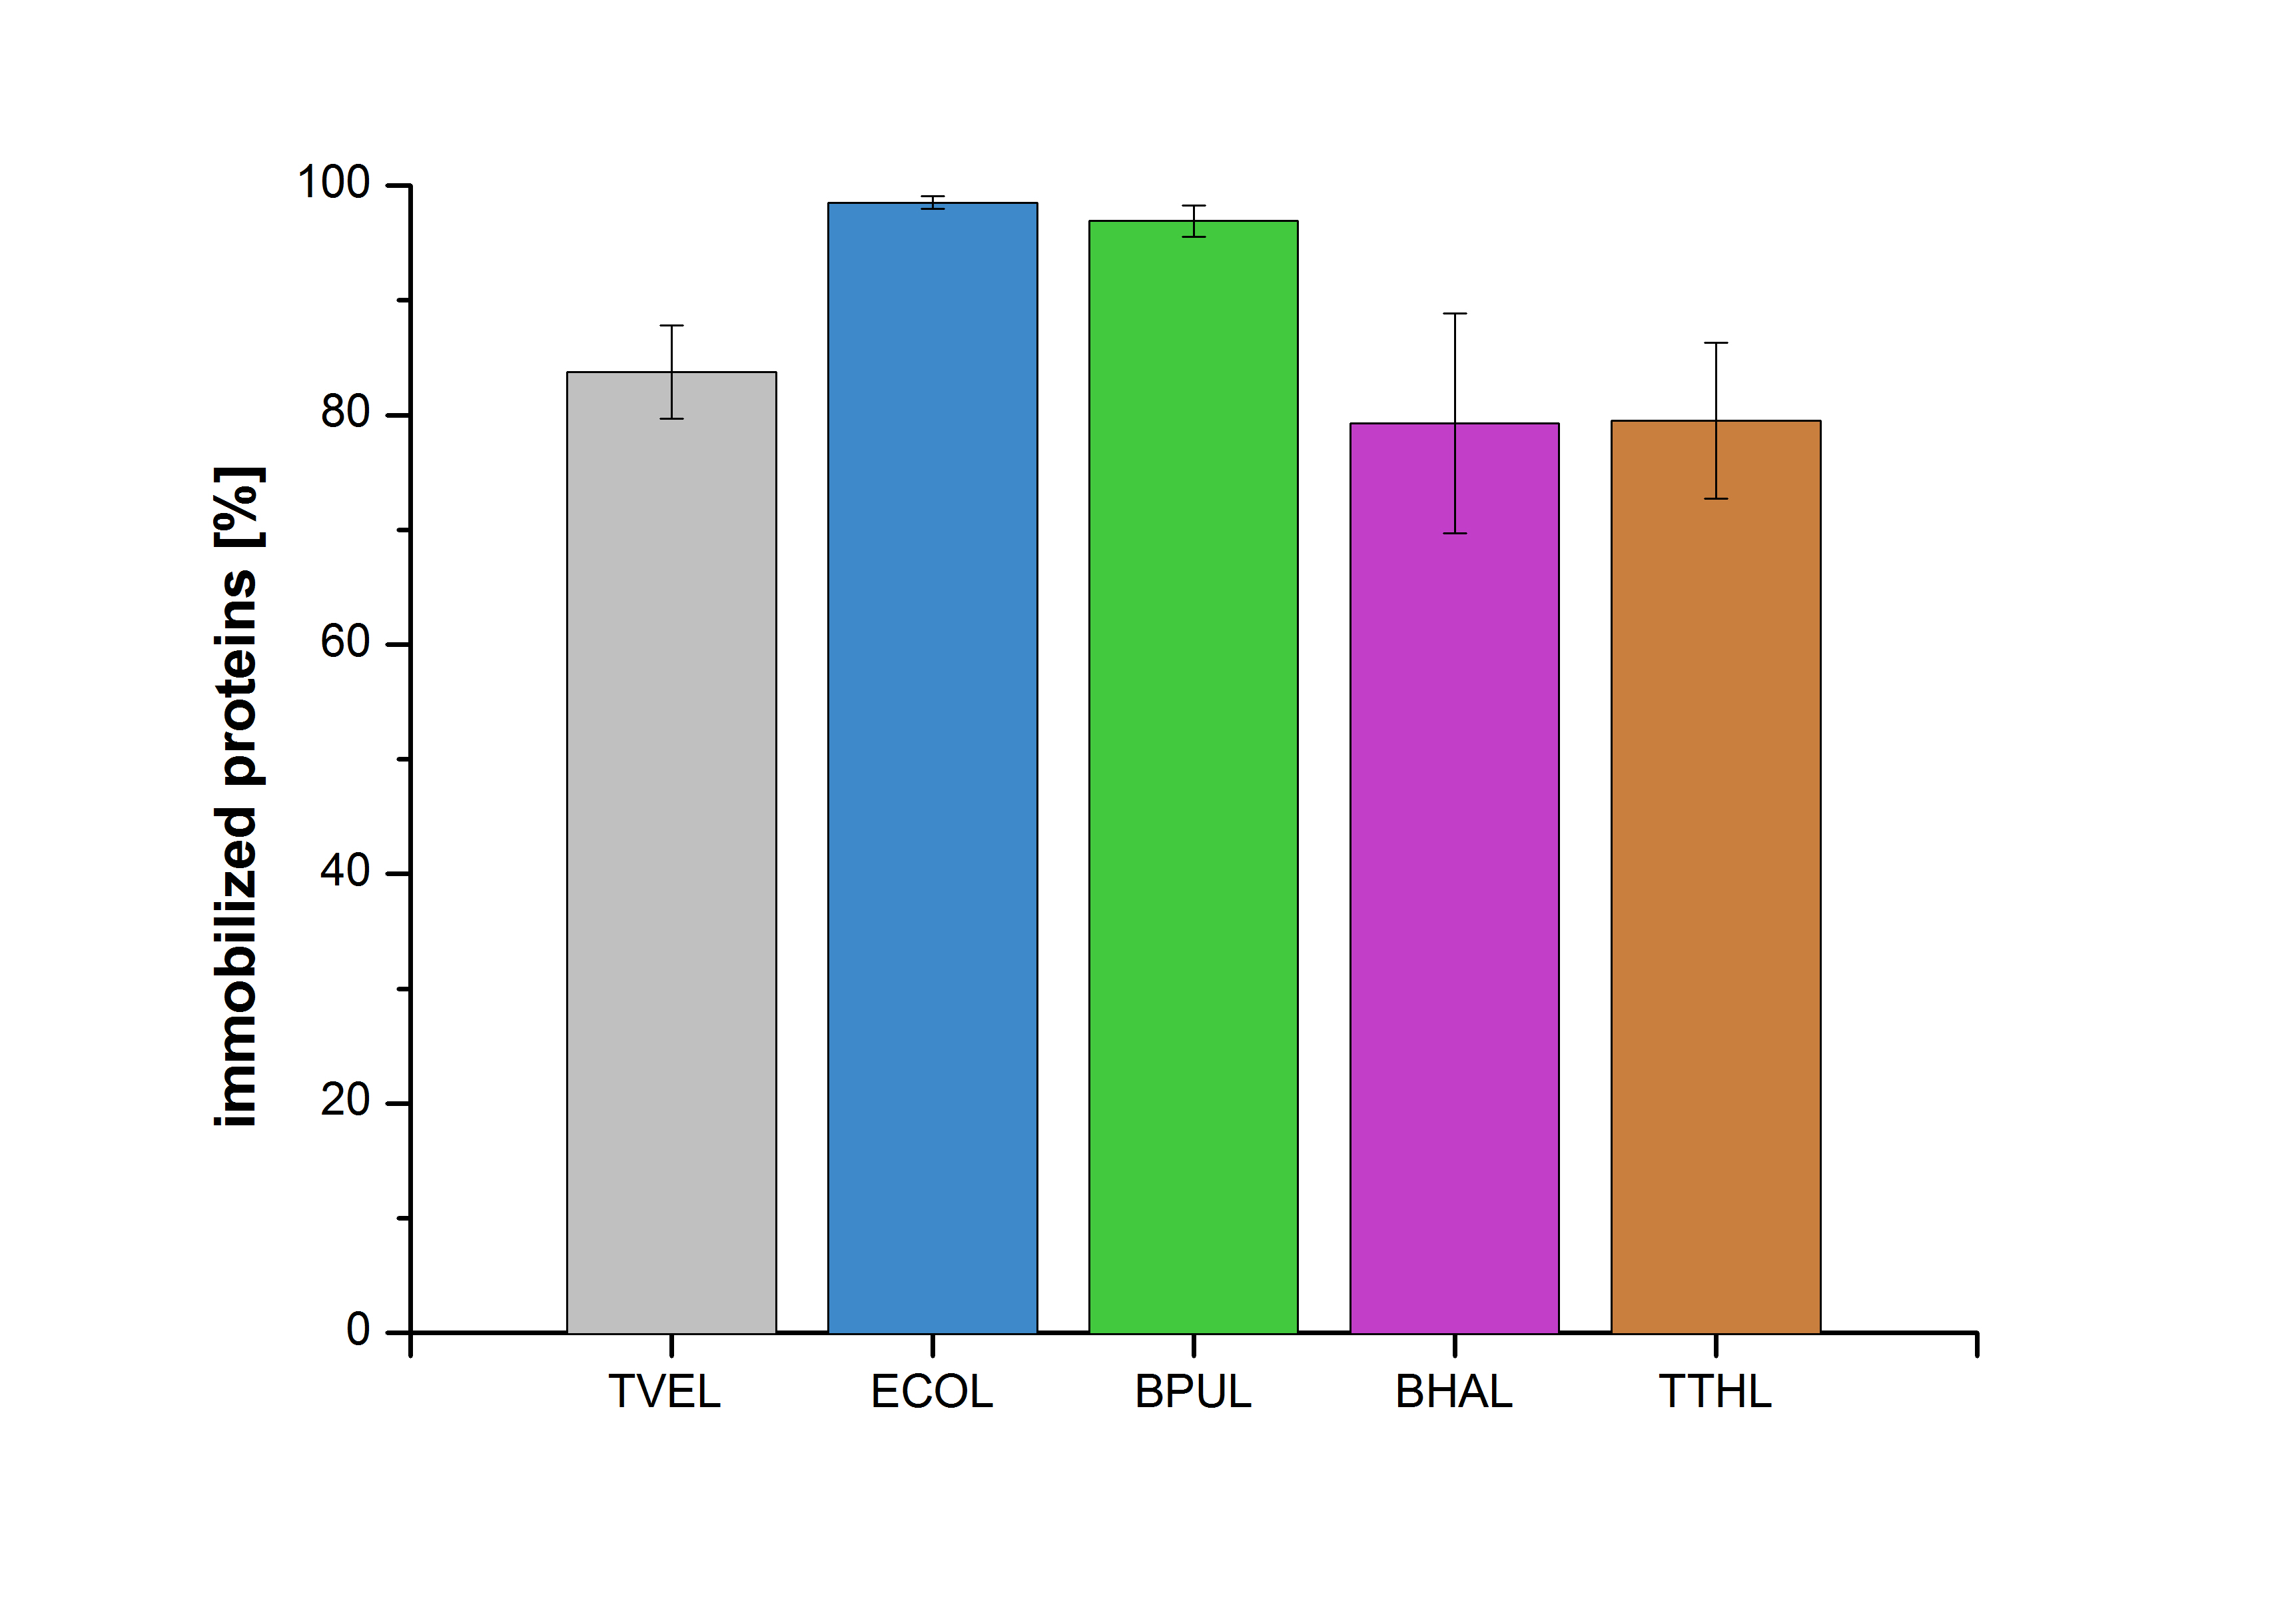
| + | [[File:Bielefeld2012-Immobilized_proteins.jpg|500px|left|thumb|'''Figure 10''': The percentage of laccases immobilized to CPC-Beads. 99 % of ECOL, 97 % of BPUL and 79 % of BHAL and TTHL laccases were bound to the beads.]] | ||
| - | + | <div style="text-align:justify;"> | |
| - | + | Figure 10 shows the percentage of laccases bound after incubation with CPC-beads, relative to the original concentration. The concentration of laccases in the supernatant after incubation was measured using Roti®-Nanoquant. The results showed that only 18 % of TVEL0 laccases was still present in the supernatant. This illustrates that TVEL0 was successfully immobilized on the CPC-beads. | |
| - | Figure | + | </div> |
| - | + | <br style="clear: both" /> | |
| - | + | ||
| - | + | ||
| - | + | ||
| - | + | ||
| - | + | ||
| - | + | ||
| - | + | ||
| - | + | ||
| + | <br style="clear: both" /> | ||
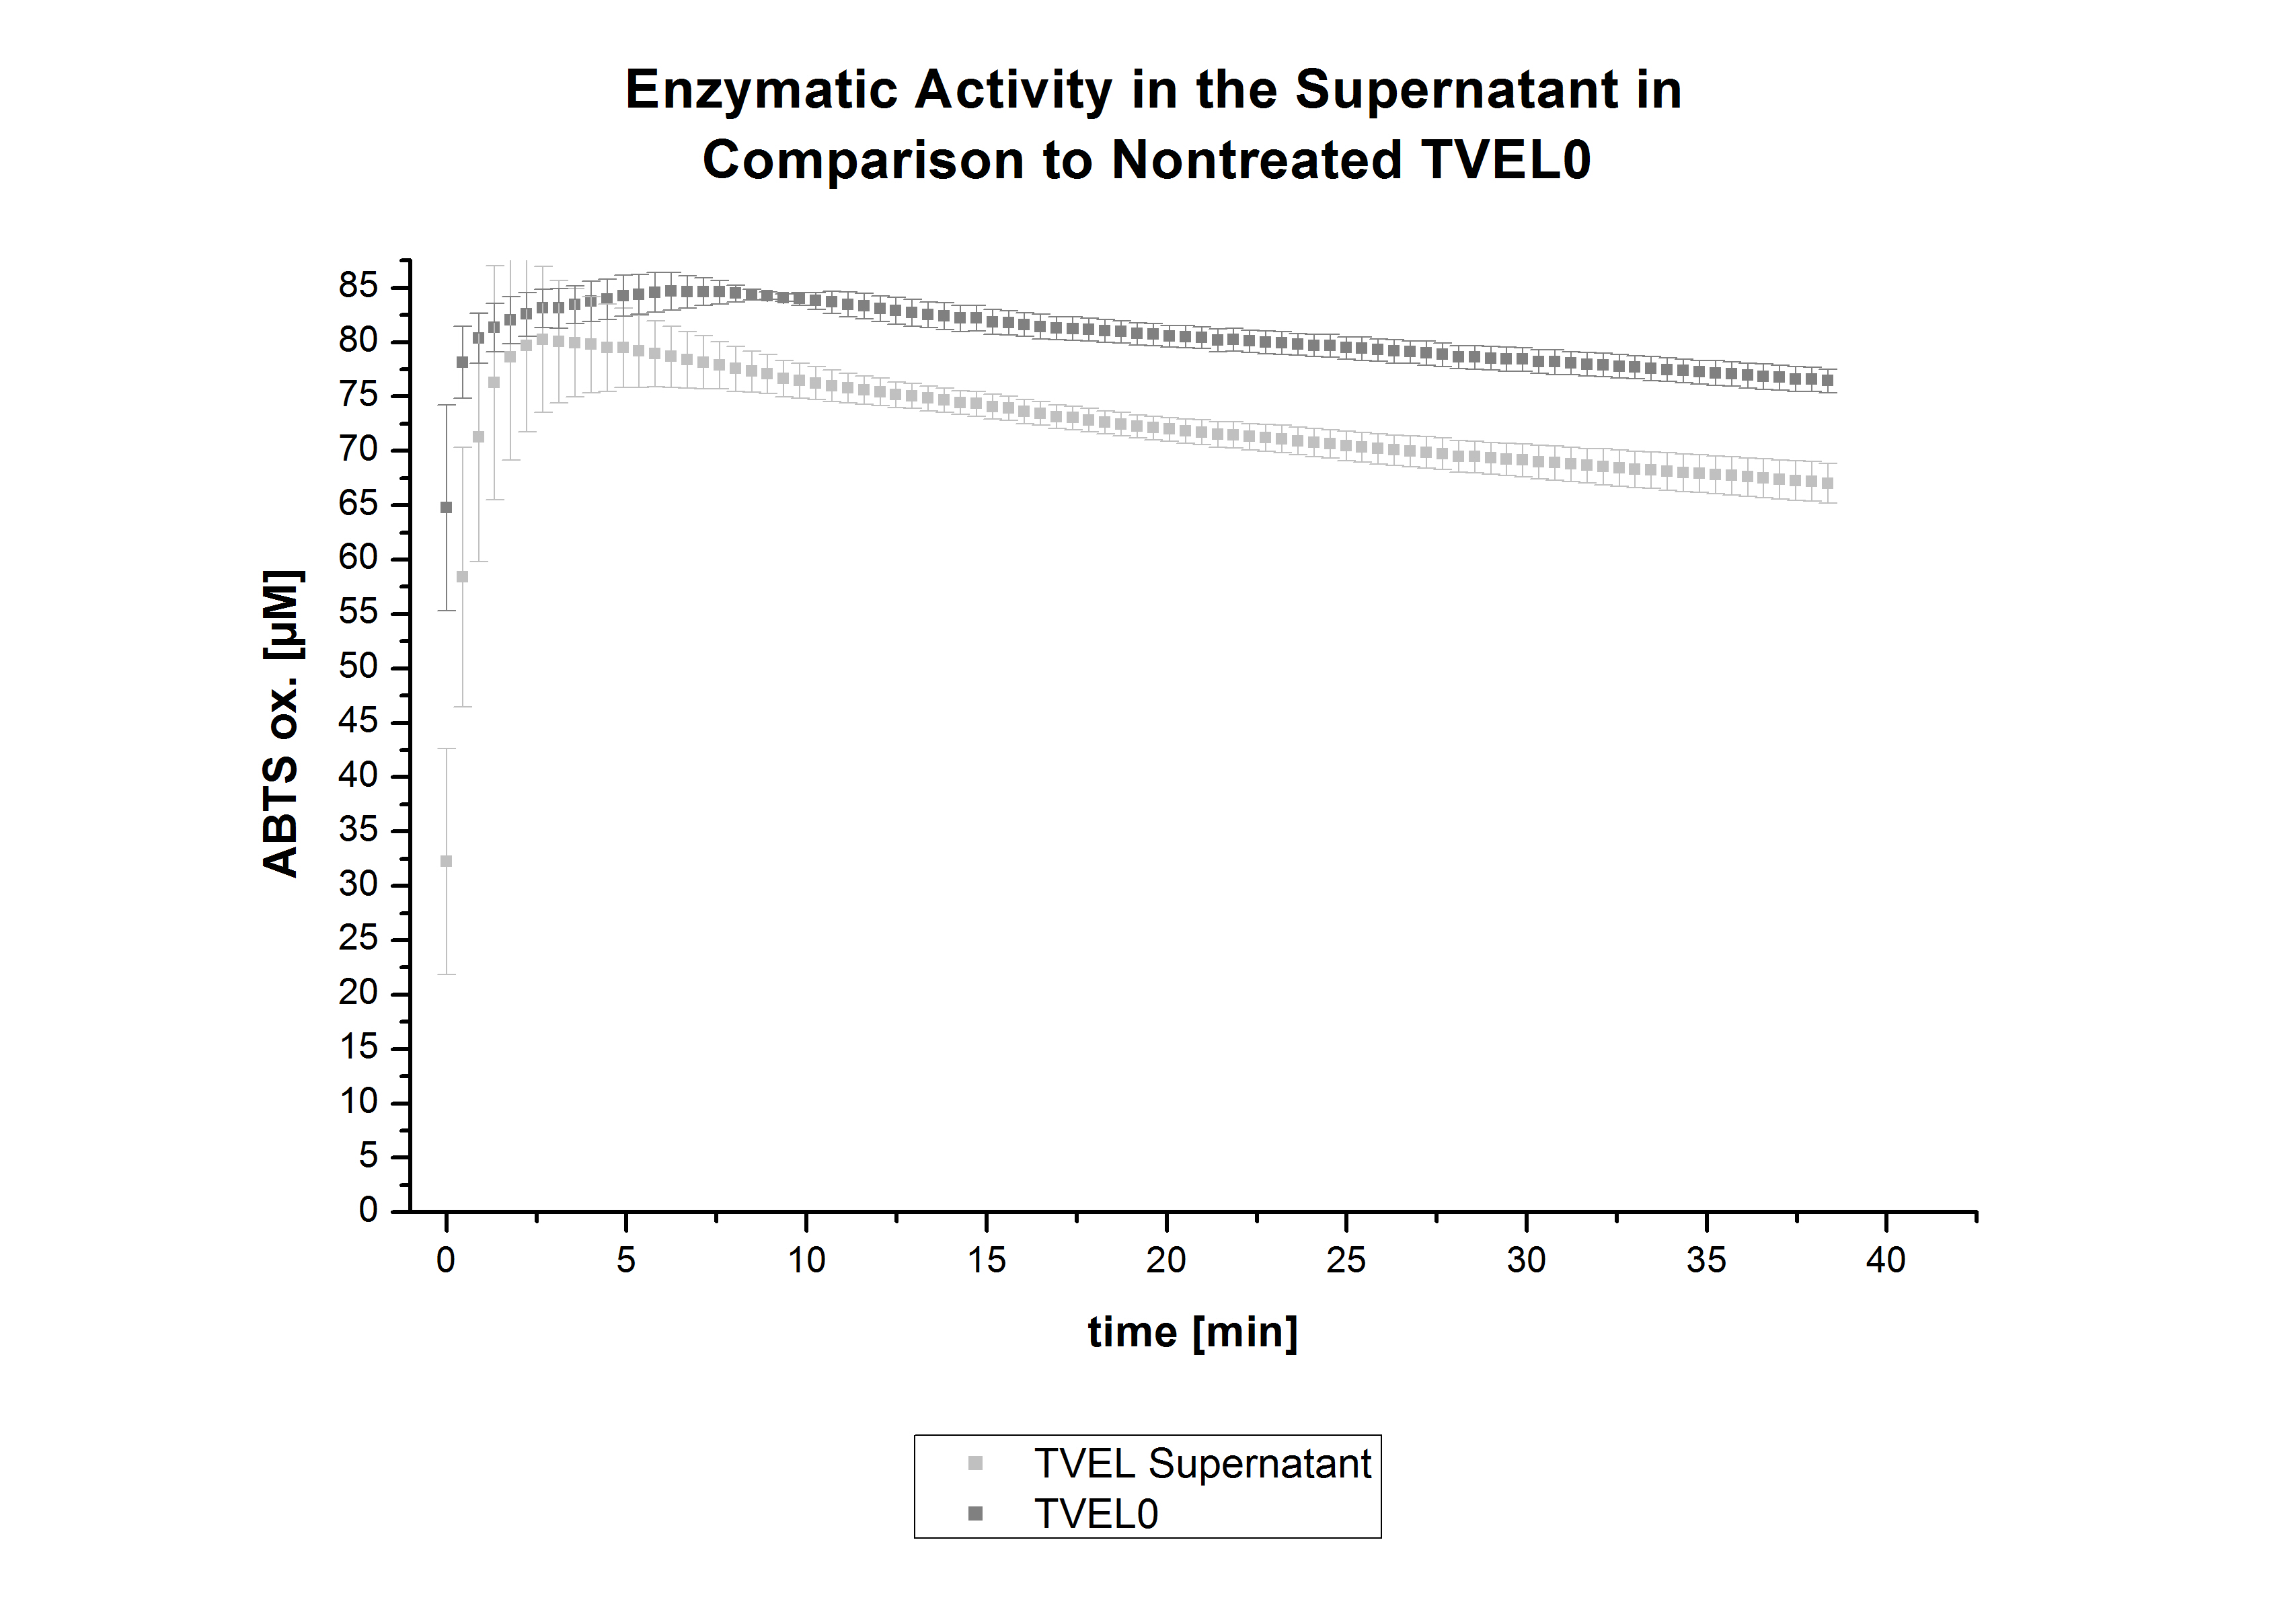
| + | [[File:Bielefeld2012_trametes.jpg|500px|left|thumb|'''Figure 11''': Enzymatic activity of TVEL0 supernatant compared to the activity of nontreated laccases, measured using 0.1 mM ABTS at 25°C over a time period of 12hours. The results show a dramatic decrease of TVEL0 in the Supernatant.]] | ||
| + | <div style="text-align:justify;"> | ||
| + | In figure 11, the enzymatic activity of TVEL0 in the supernatant is compared to the activity of nontreated TVEL0. Although an activity can already be detected in the supernatant, this activity is low compared to the original. | ||
| + | <br style="clear: both" /> | ||
| + | </div> | ||
| + | [[File:Bielefeld2012-Graphen_Bead_TVEL0.jpg|500px|left|thumb|'''Figure 12''': Illustration of ABTS oxidation by TVEL0 with time compared to the negative control. The increase in ABTS oxidized proves laccase activity.]] | ||
| + | <div style="text-align:justify;"> | ||
| + | Figure 12 shows the illustration of ABTS oxidation by TVEL0 with time compared to the negative control. The increase in ABTS oxidized proves laccase activity even if a direct comparison with the original and not immobilized laccase solution was not possible due to the very high activity of TVEL0, which could not be measured properly. | ||
| + | <br style="clear: both" /> | ||
| + | </div> | ||
| Line 95: | Line 99: | ||
| - | |||
<br style="clear: both" /> | <br style="clear: both" /> | ||
Latest revision as of 03:27, 27 October 2012

Summary
TVEL0 was acquired commercially from [http://www.sigmaaldrich.com/catalog/product/sigma/53739?lang=de®ion=DE Sigma-Aldrich] for creating a standard in enzyme activity and further comparisons to the produced recombinant laccases. TVEL0 was characterized in terms of it´s activity under different pH, CuCl2 ABTS, MEOH and acetonitrile concentrations. The protein concentrations of all purified laccases were adjusted to the amount of diluted TVEL0 in each sample, respectively.
Contents |
TVEL0 Activity Tests
Initial Activity Test
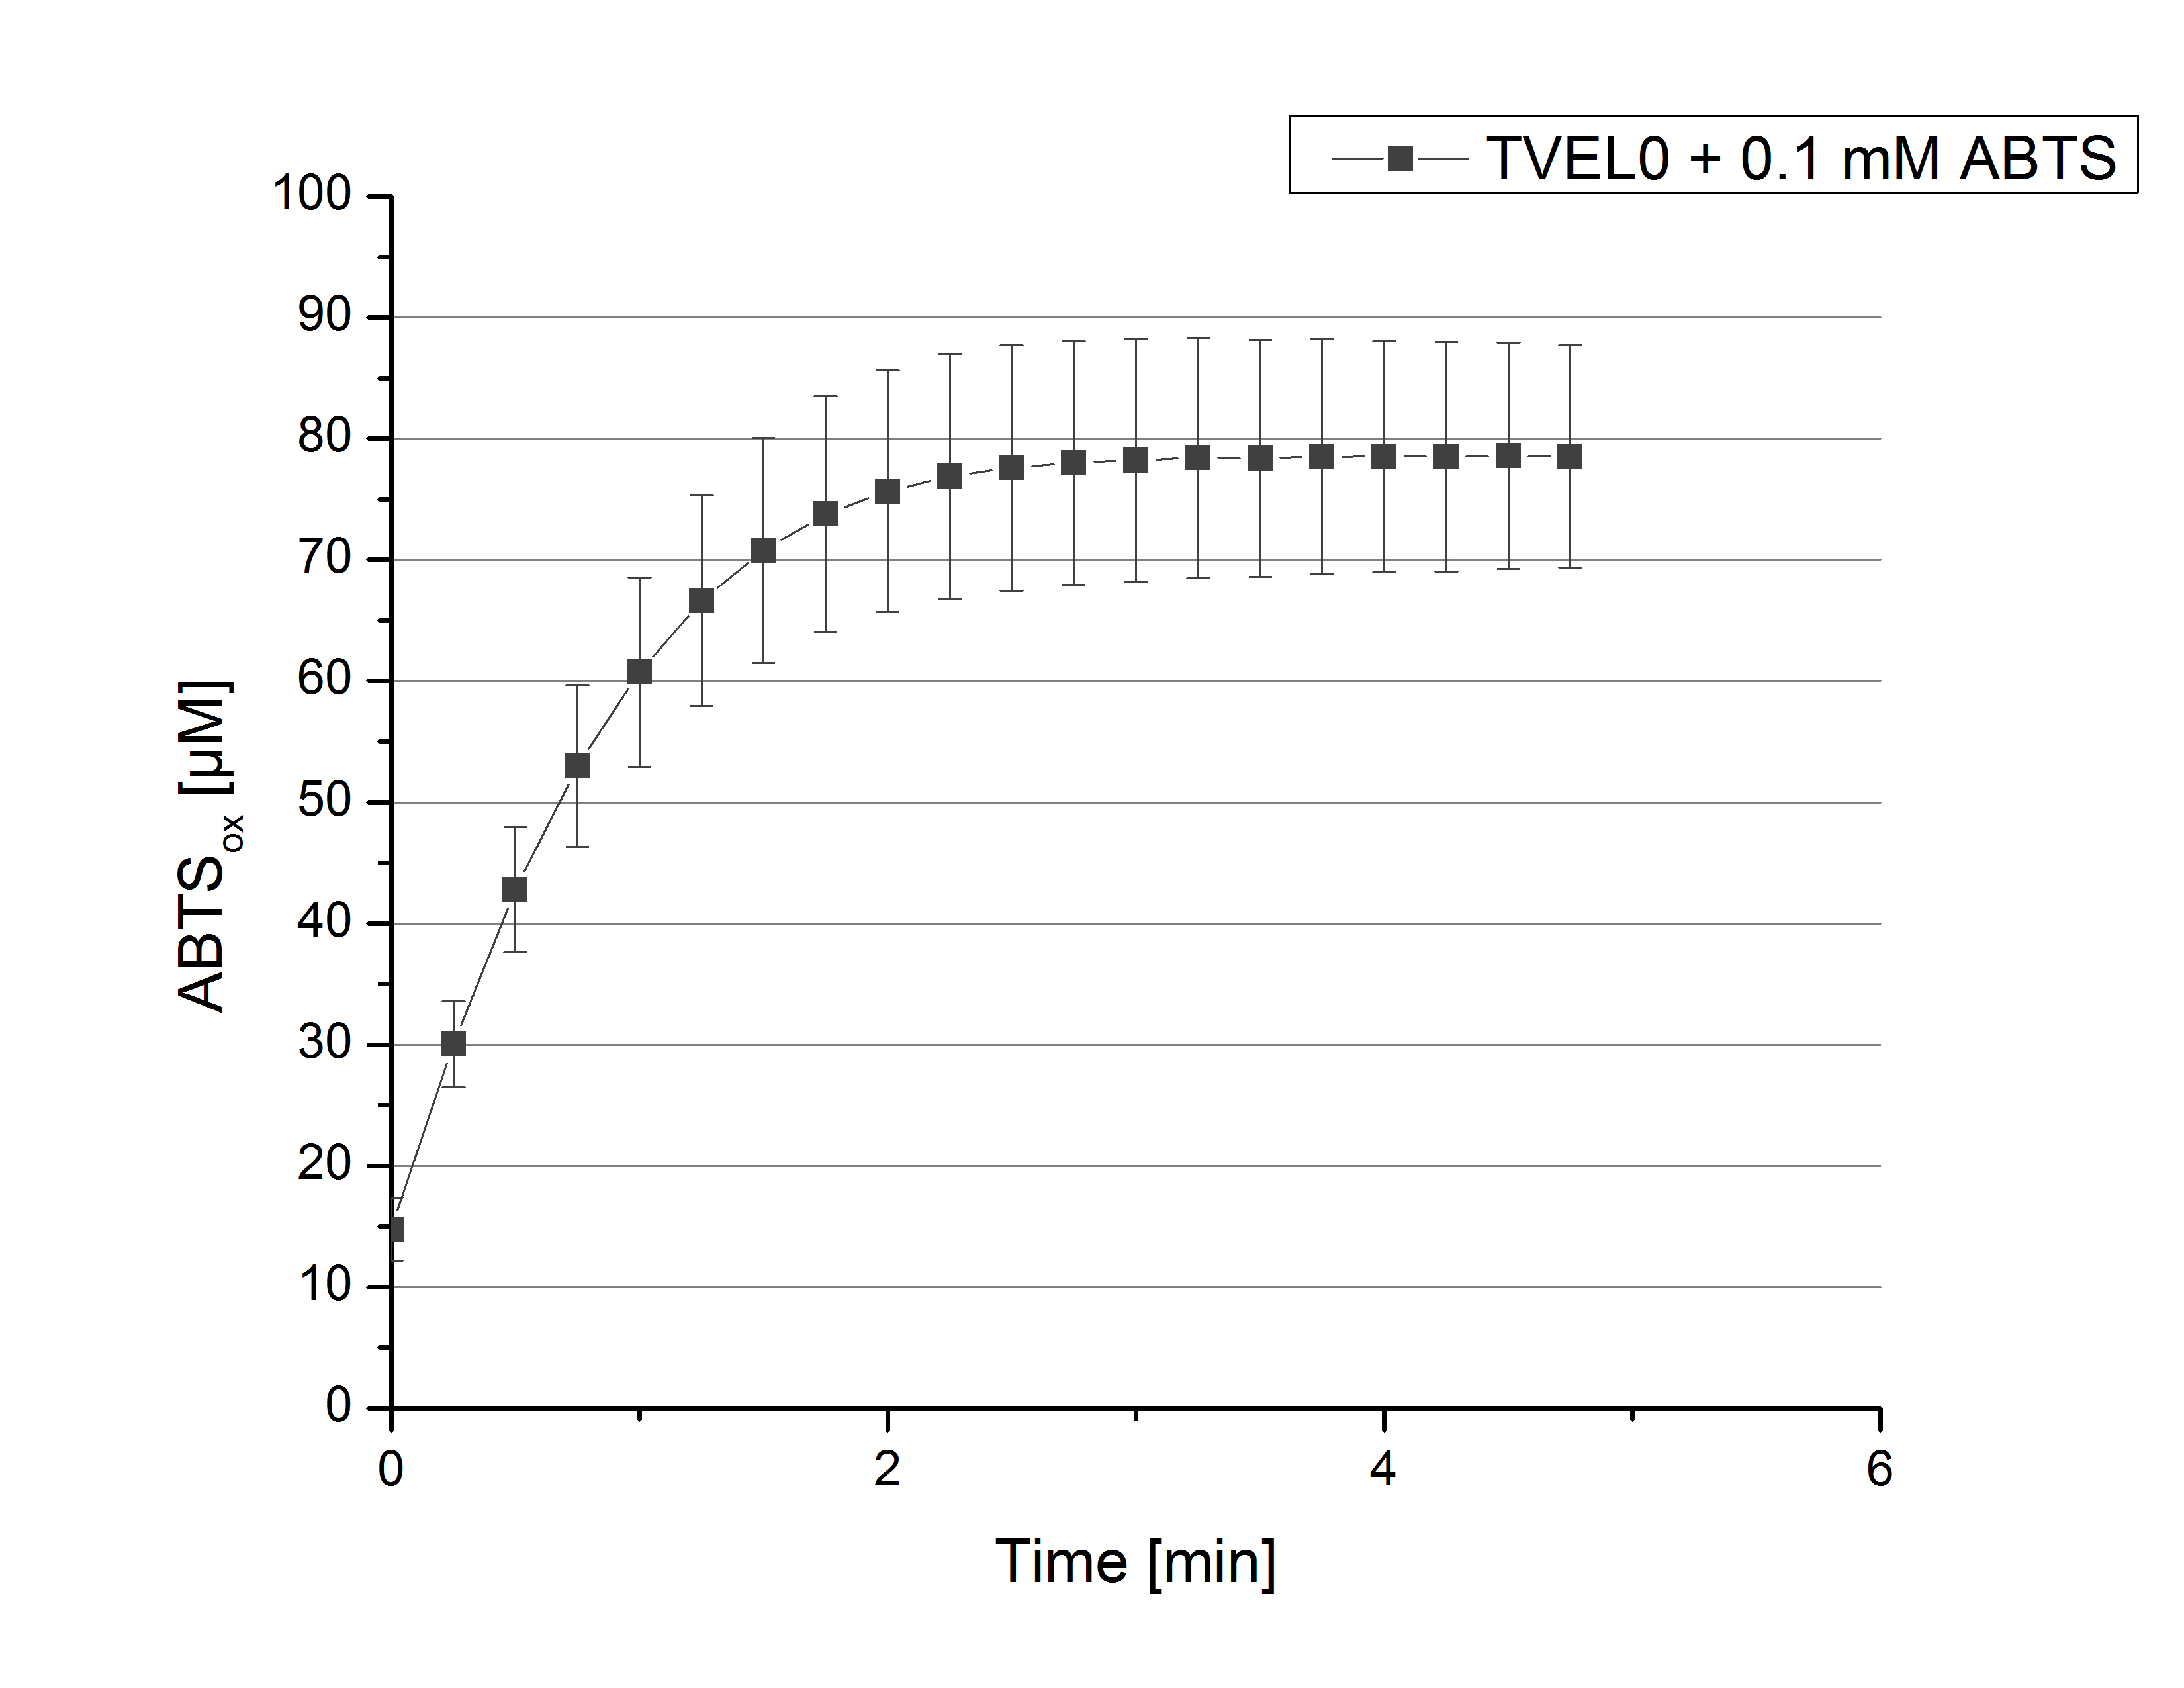
To standardize activity test methods used for this project, a [http://www.sigmaaldrich.com/catalog/product/sigma/51639?lang=de®ion=DE laccase from Trametes versicolor] (TVEL0) was used. The optimal composition for activity measurements contains 140 µL of 0.03 mg mL-1 concentrated TVEL0 laccase solution, 0.1 mM ABTS and 100 mM sodium acetate buffer to a final volume of 200 µL. With this approach ABTS oxidation activity of TVEL0 was measured over a time period of 5 minutes at 25°C. The saturation of the reaction was reached after 3 minutes when ~80% ABTS got oxidized (see Figure 1). This result proved the activity measurement method and can therefore be used as a positive control.
Optimal pH of TVEL0
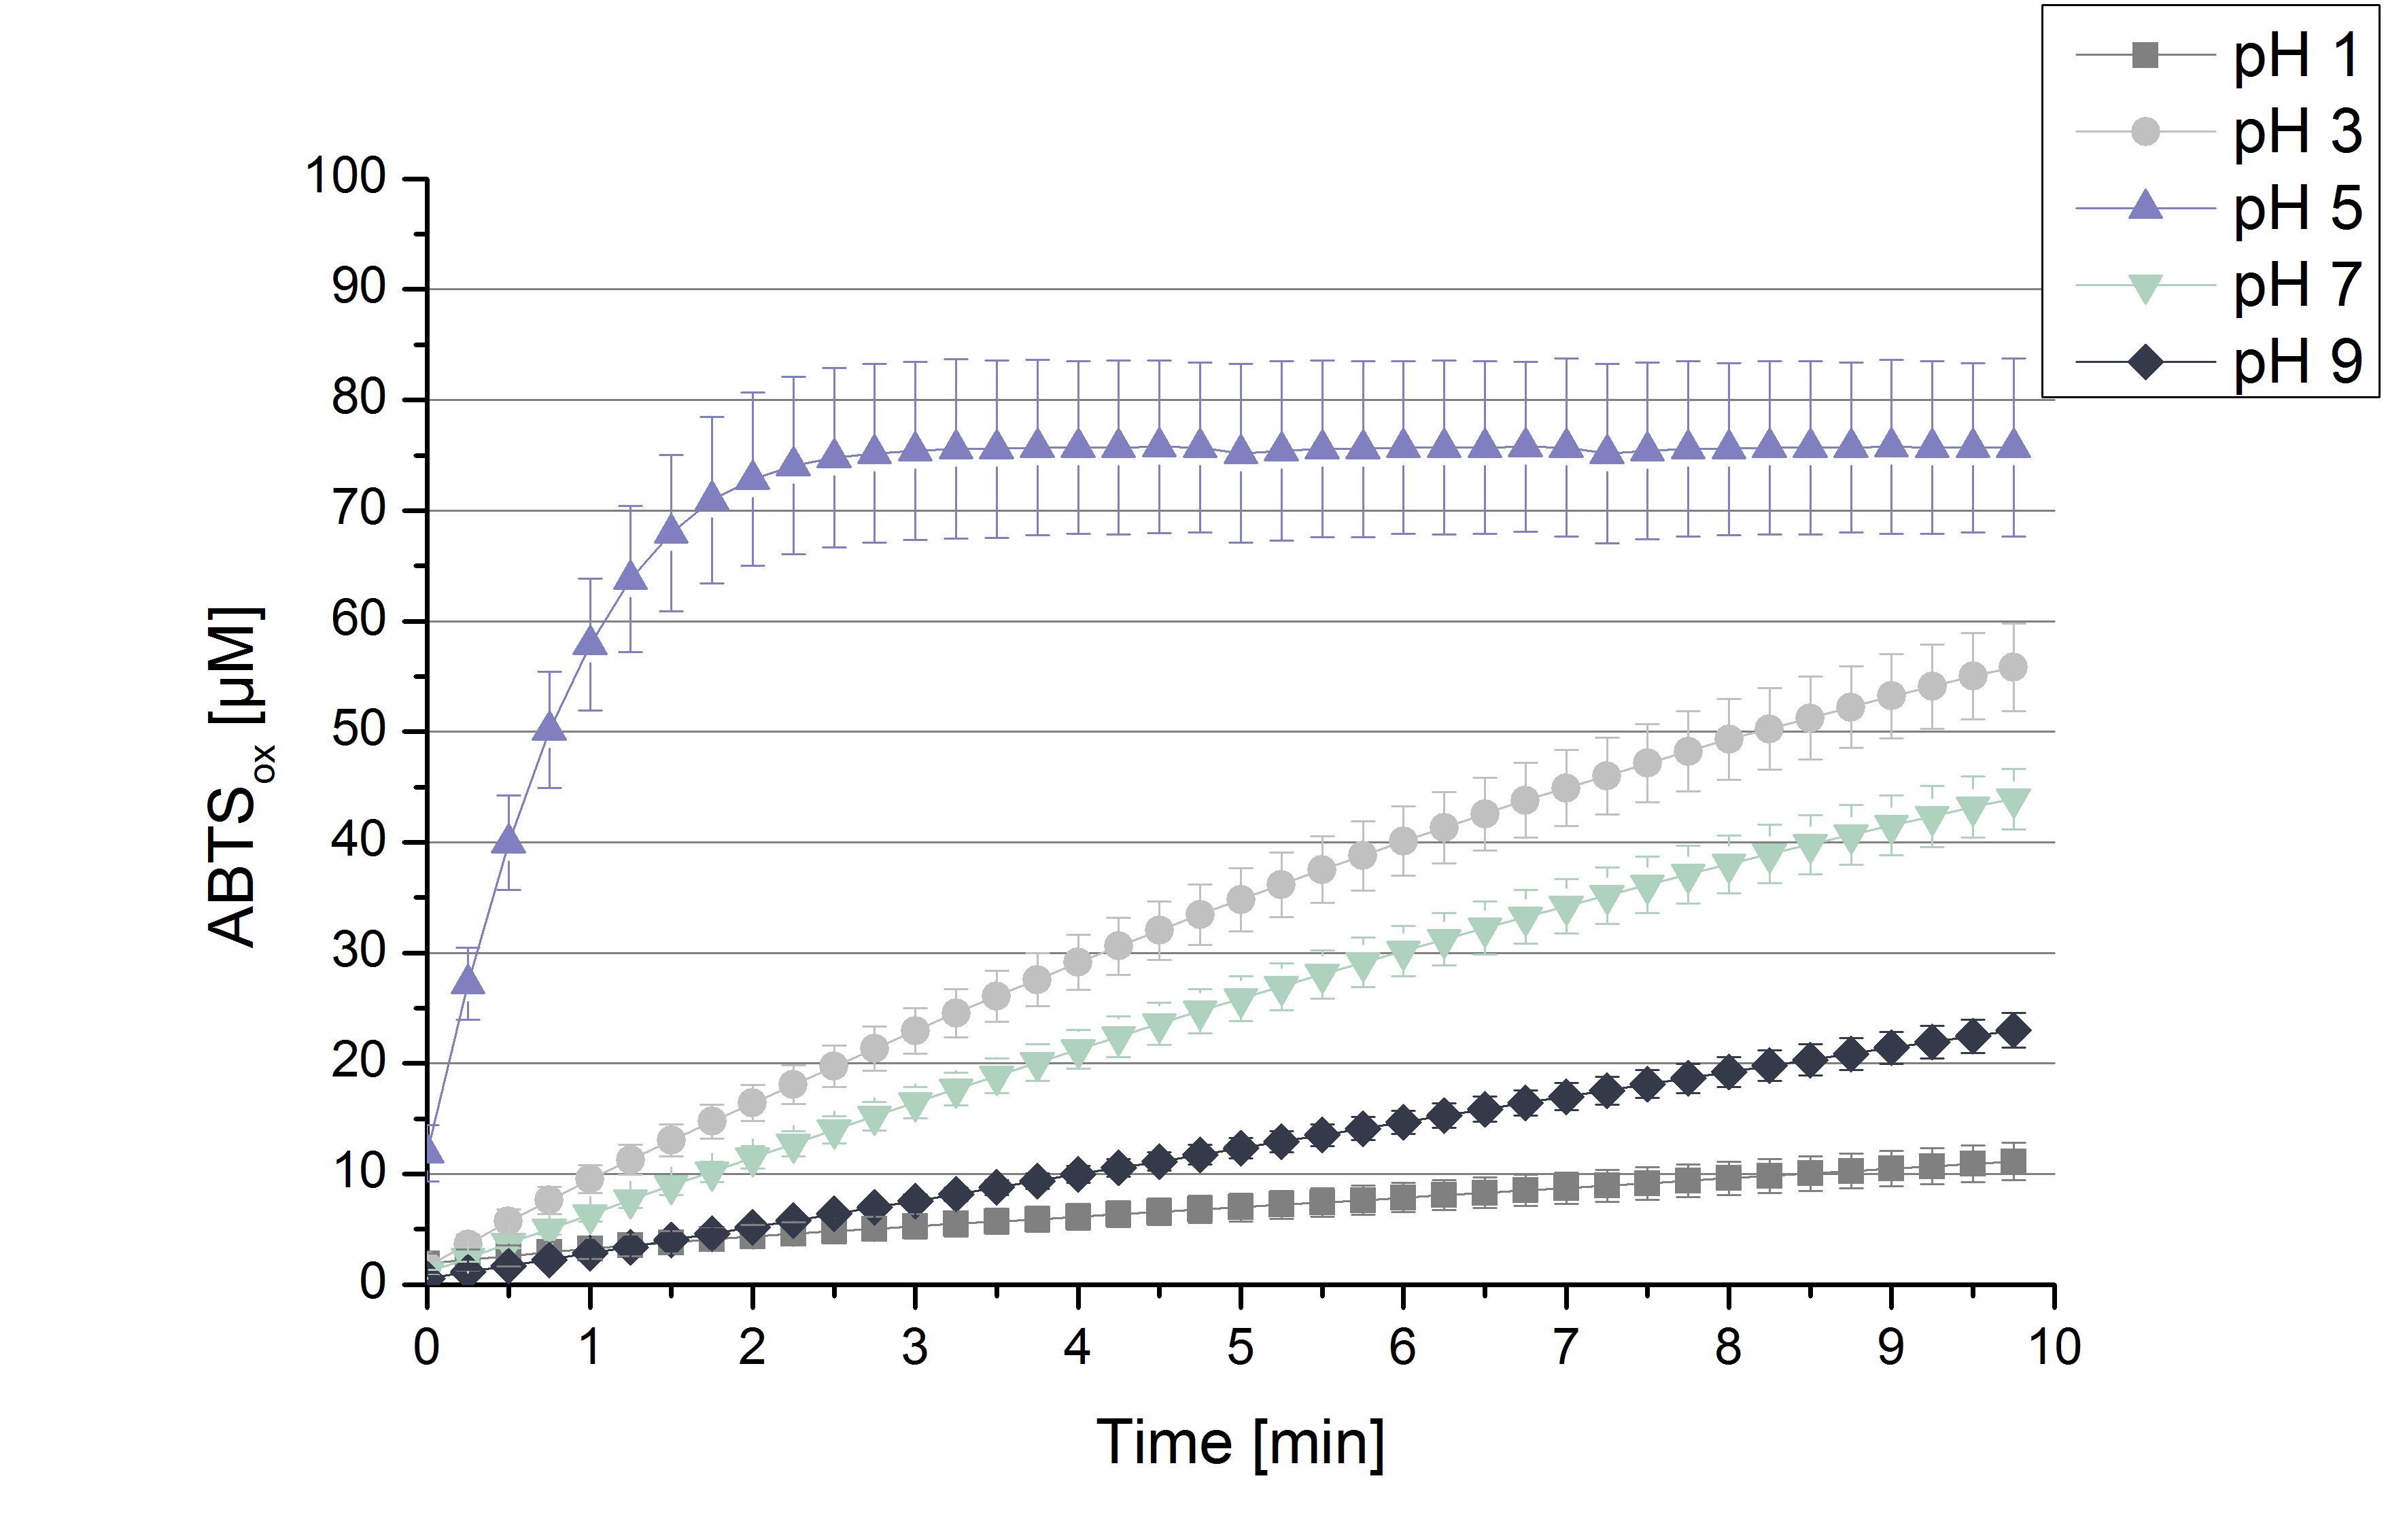
To determine the activity of TVEL0 in regard of optimal pH conditions different sodium acetate buffer pHs were under consideration for activity tests. Ranging from pH 1 to pH 9 the standardized activity setup of 140 µL of 0.03 mg mL-1 concentrated TVEL0 laccase solution, 0.1 mM ABTS and 100 mM sodium acetate to a final volume of 200 µL was used. Only at pH 5 a saturation in ABTSox can be reached (see Figure 2). As in the initial activity test above the maximal amount of ABTSox accounts ~80%. In summary the optimal pH for TVEL0 activity to oxidize ABTS is pH 5.
TVEL0 activity depending on different ABTS concentrations
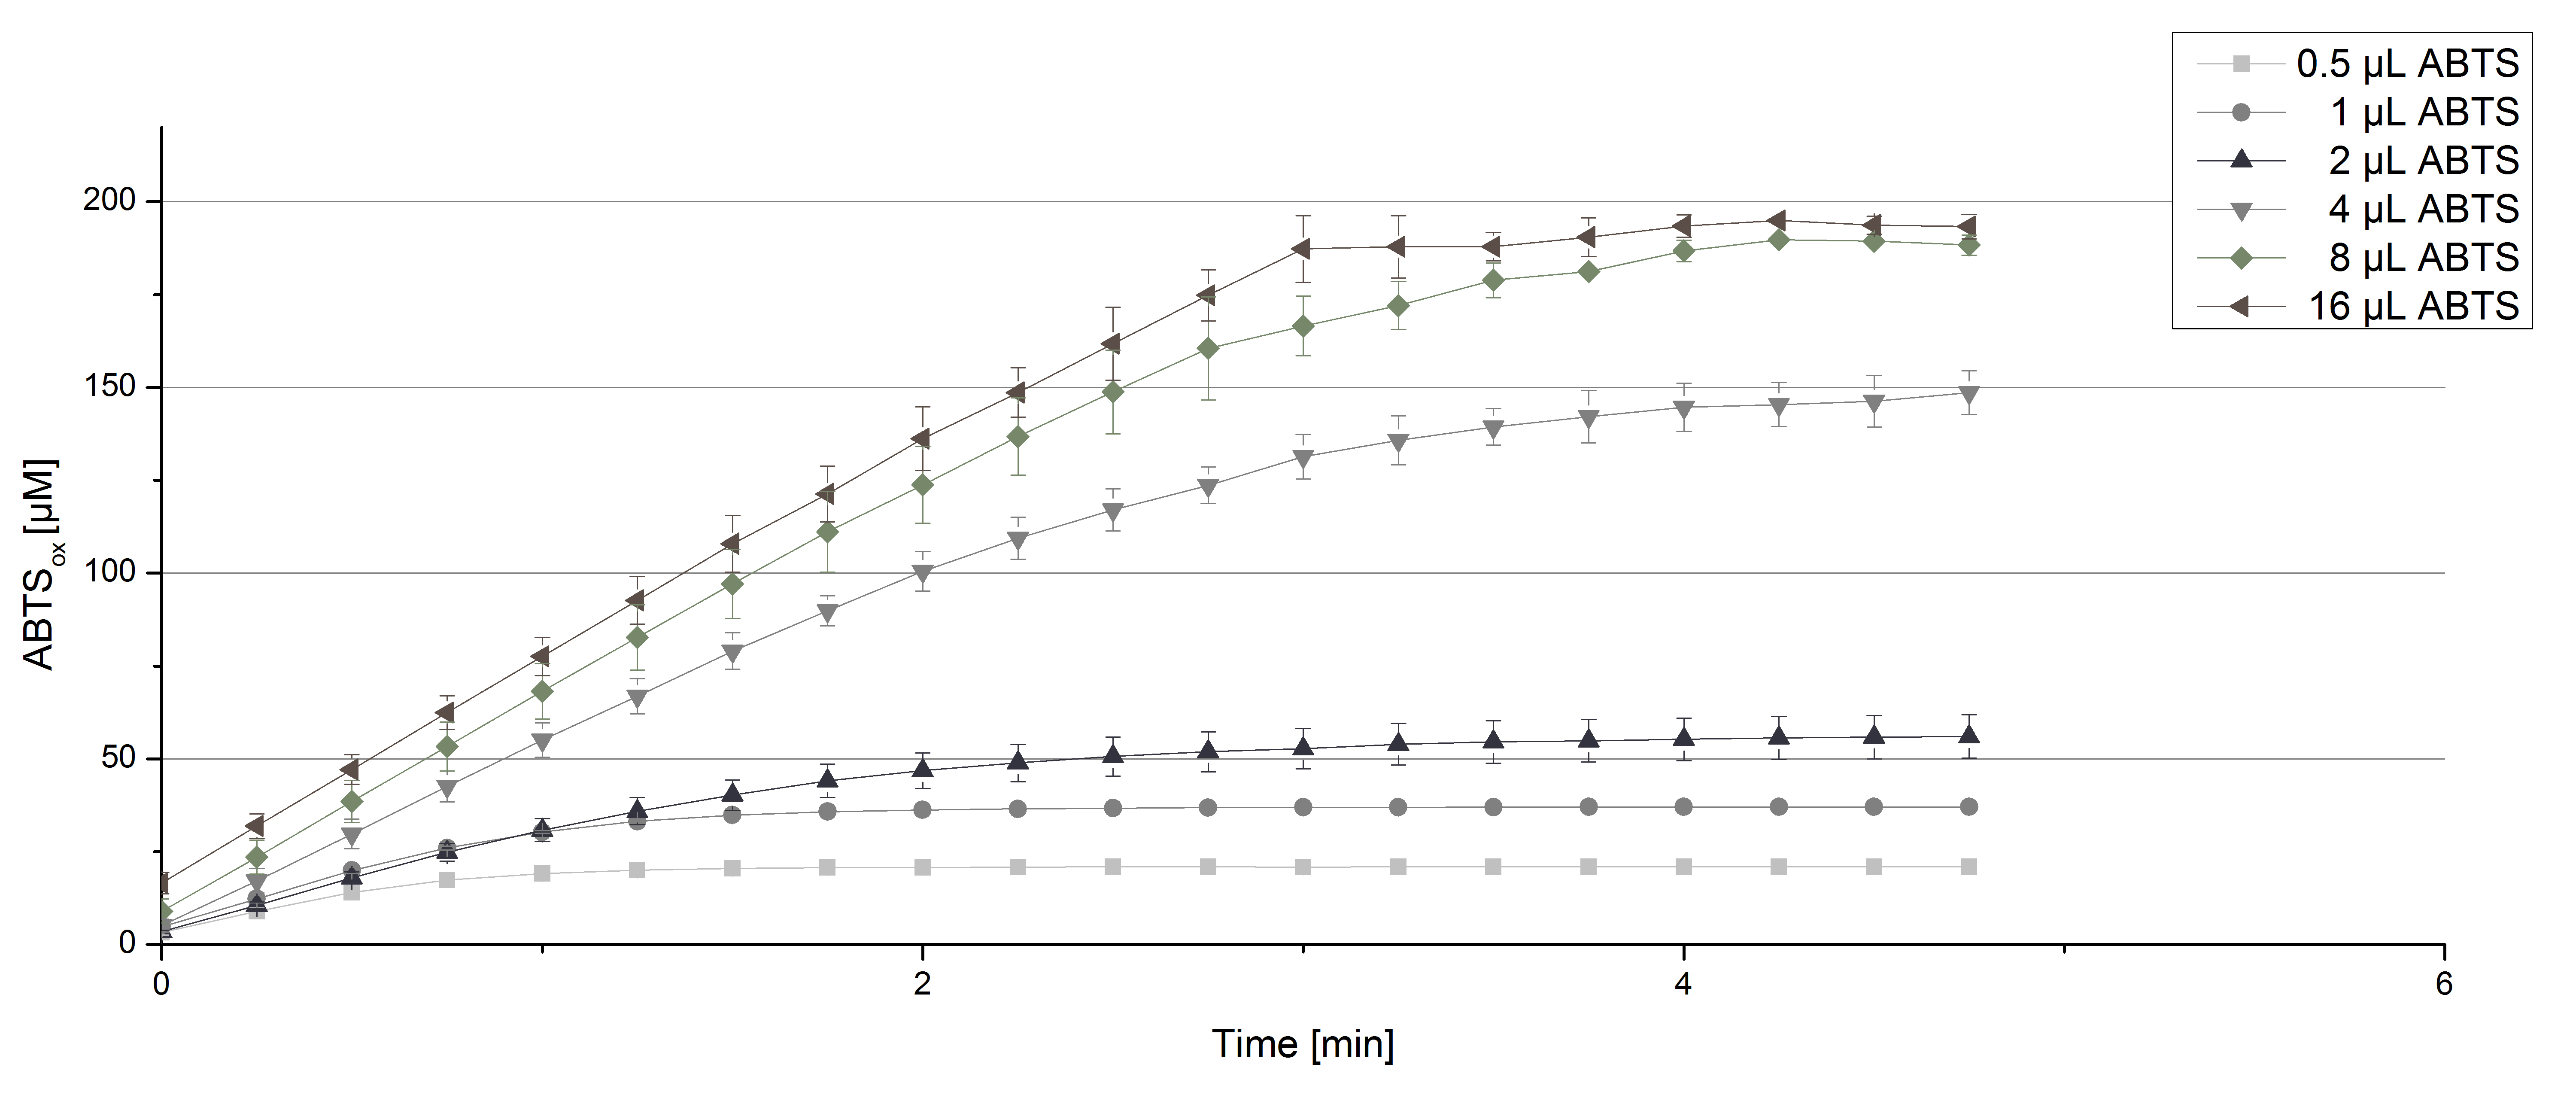
TVEL0 laccase were tested using different amounts of ABTS to calculate KM and Kcat values. Instead of using 140 µL of a 0.03 mg mL-1 TVEL0 protein solution, the amount was quartered to 35 µL of this solution. Reducing the enzyme concentration was necessary to detect the change in OD420 at the beginning of the reaction. The standardized measurement setup as described above was used only with different amounts of ABTS. As expected, the amount of oxidized ABTS increased in dependence of the amount of ABTS used (Figure 3).
Impact of MeOH and acteonitrile on TVEL0
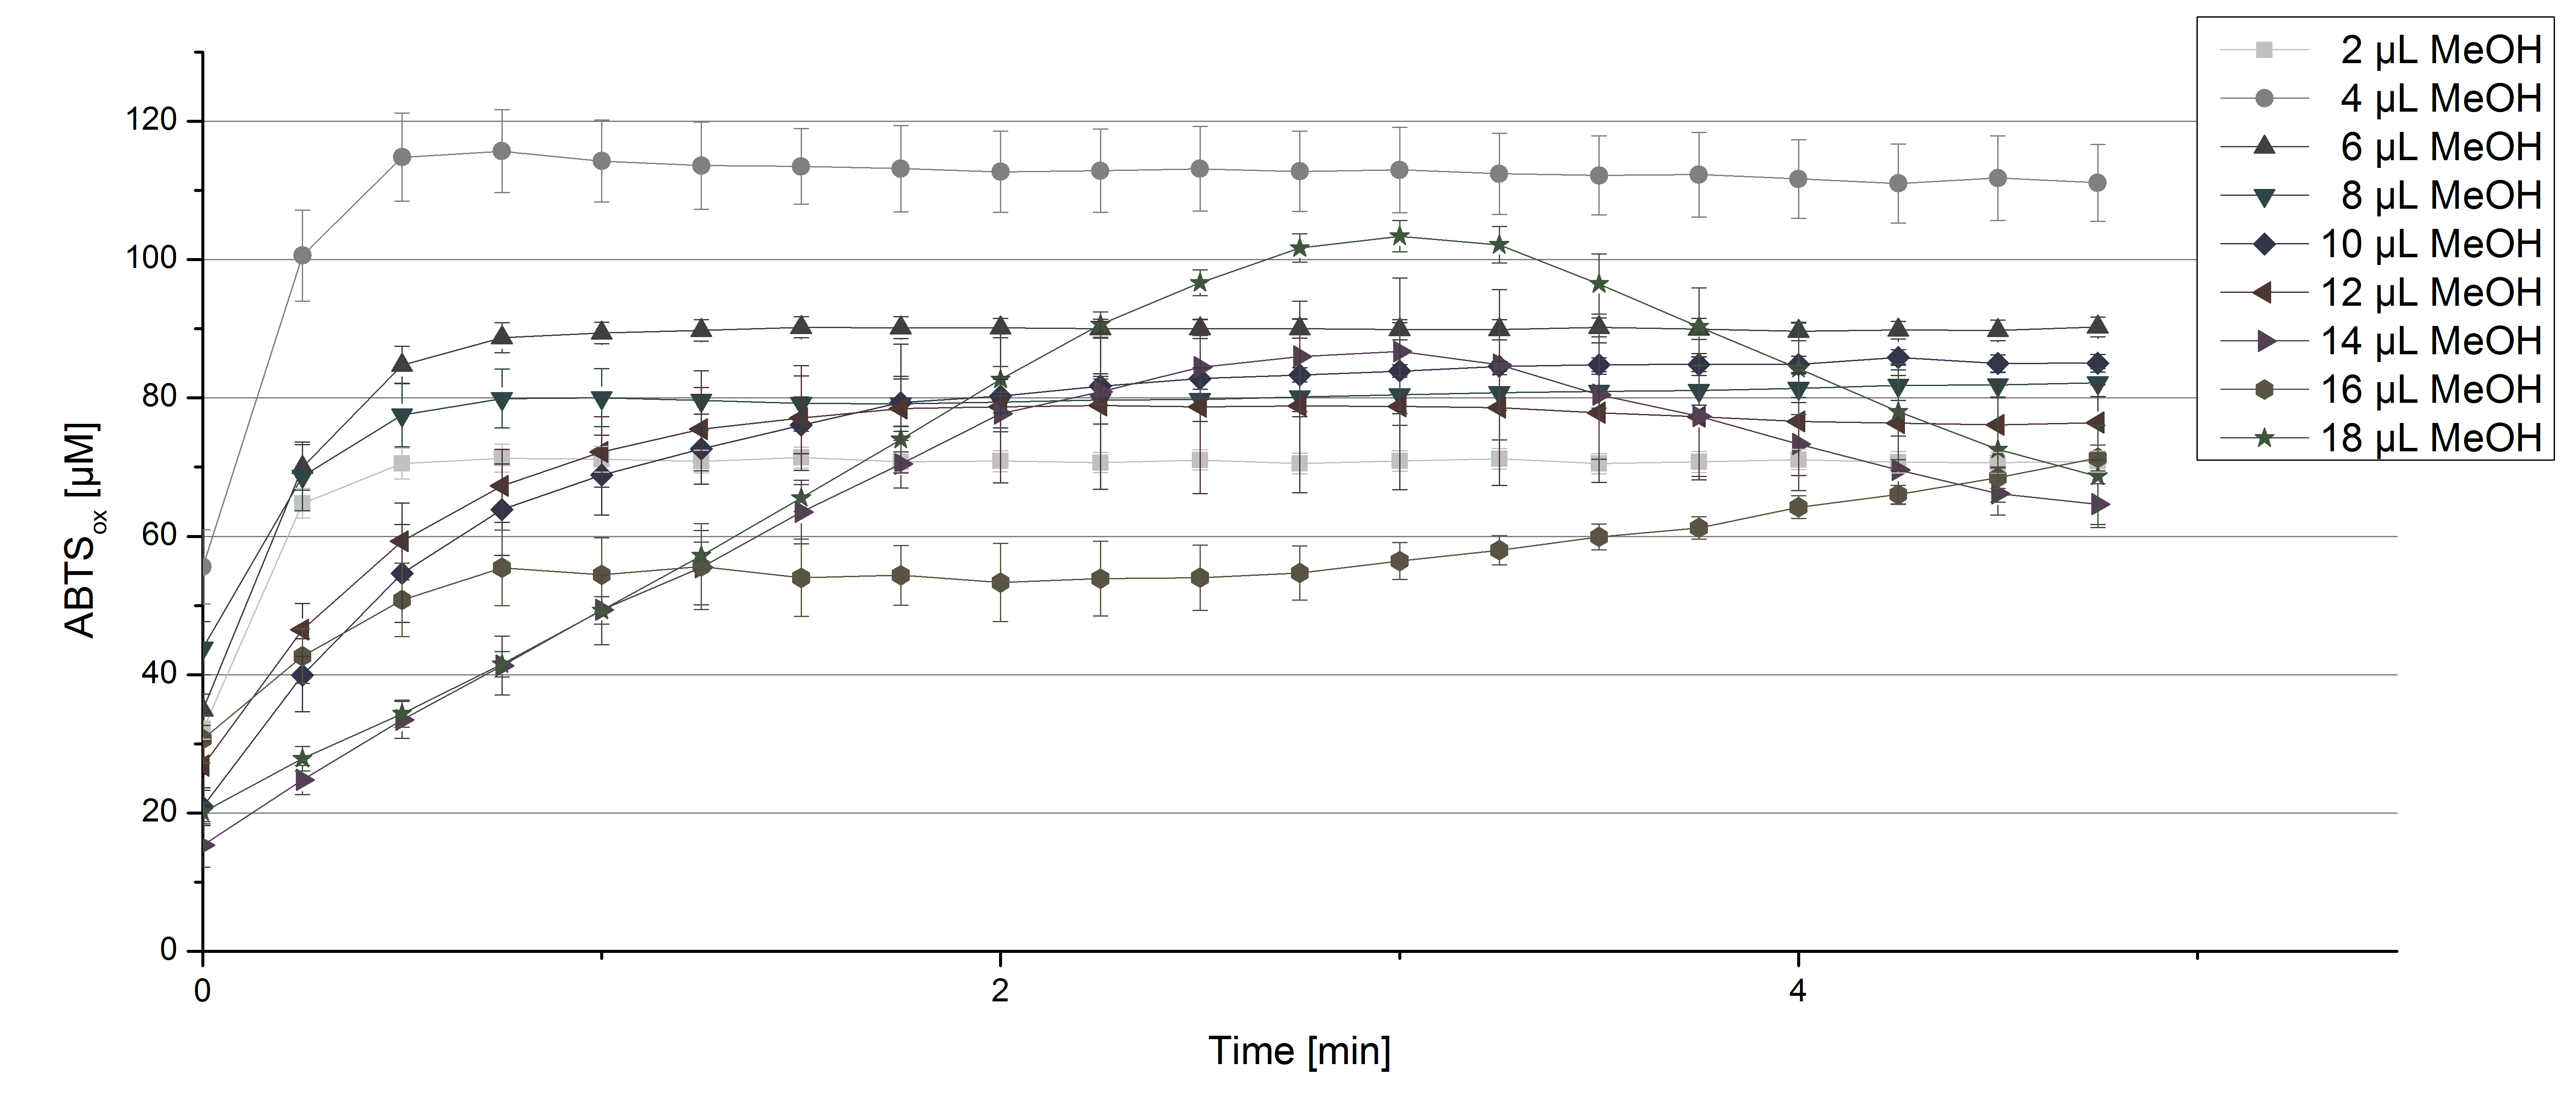
For substrate analysis the usage of MeOH and acetonitrile is necessary to dissolve the substrates. To make sure TVEL0 laccase activity is not affected by these solvents activity tests using different amounts of MeOH and acetonitrile were done. An increase in MeOH or acetonitrile amount affects the activity of TVEL0, but leads to a saturation curve in most cases. Regarding tests with MeOH an addition of 14 µL of MeOH or more causes a loss of saturation (see Figure 4). Usage of 12 µL acetonitrile or more results in the saturation curves getting disordered (see Figure 5). Still, activity is detectable in all cases, thus usage of MeOH and acetonitrile for substrate analysis is possible.
Since Regionals: TVEL0 pH optimum
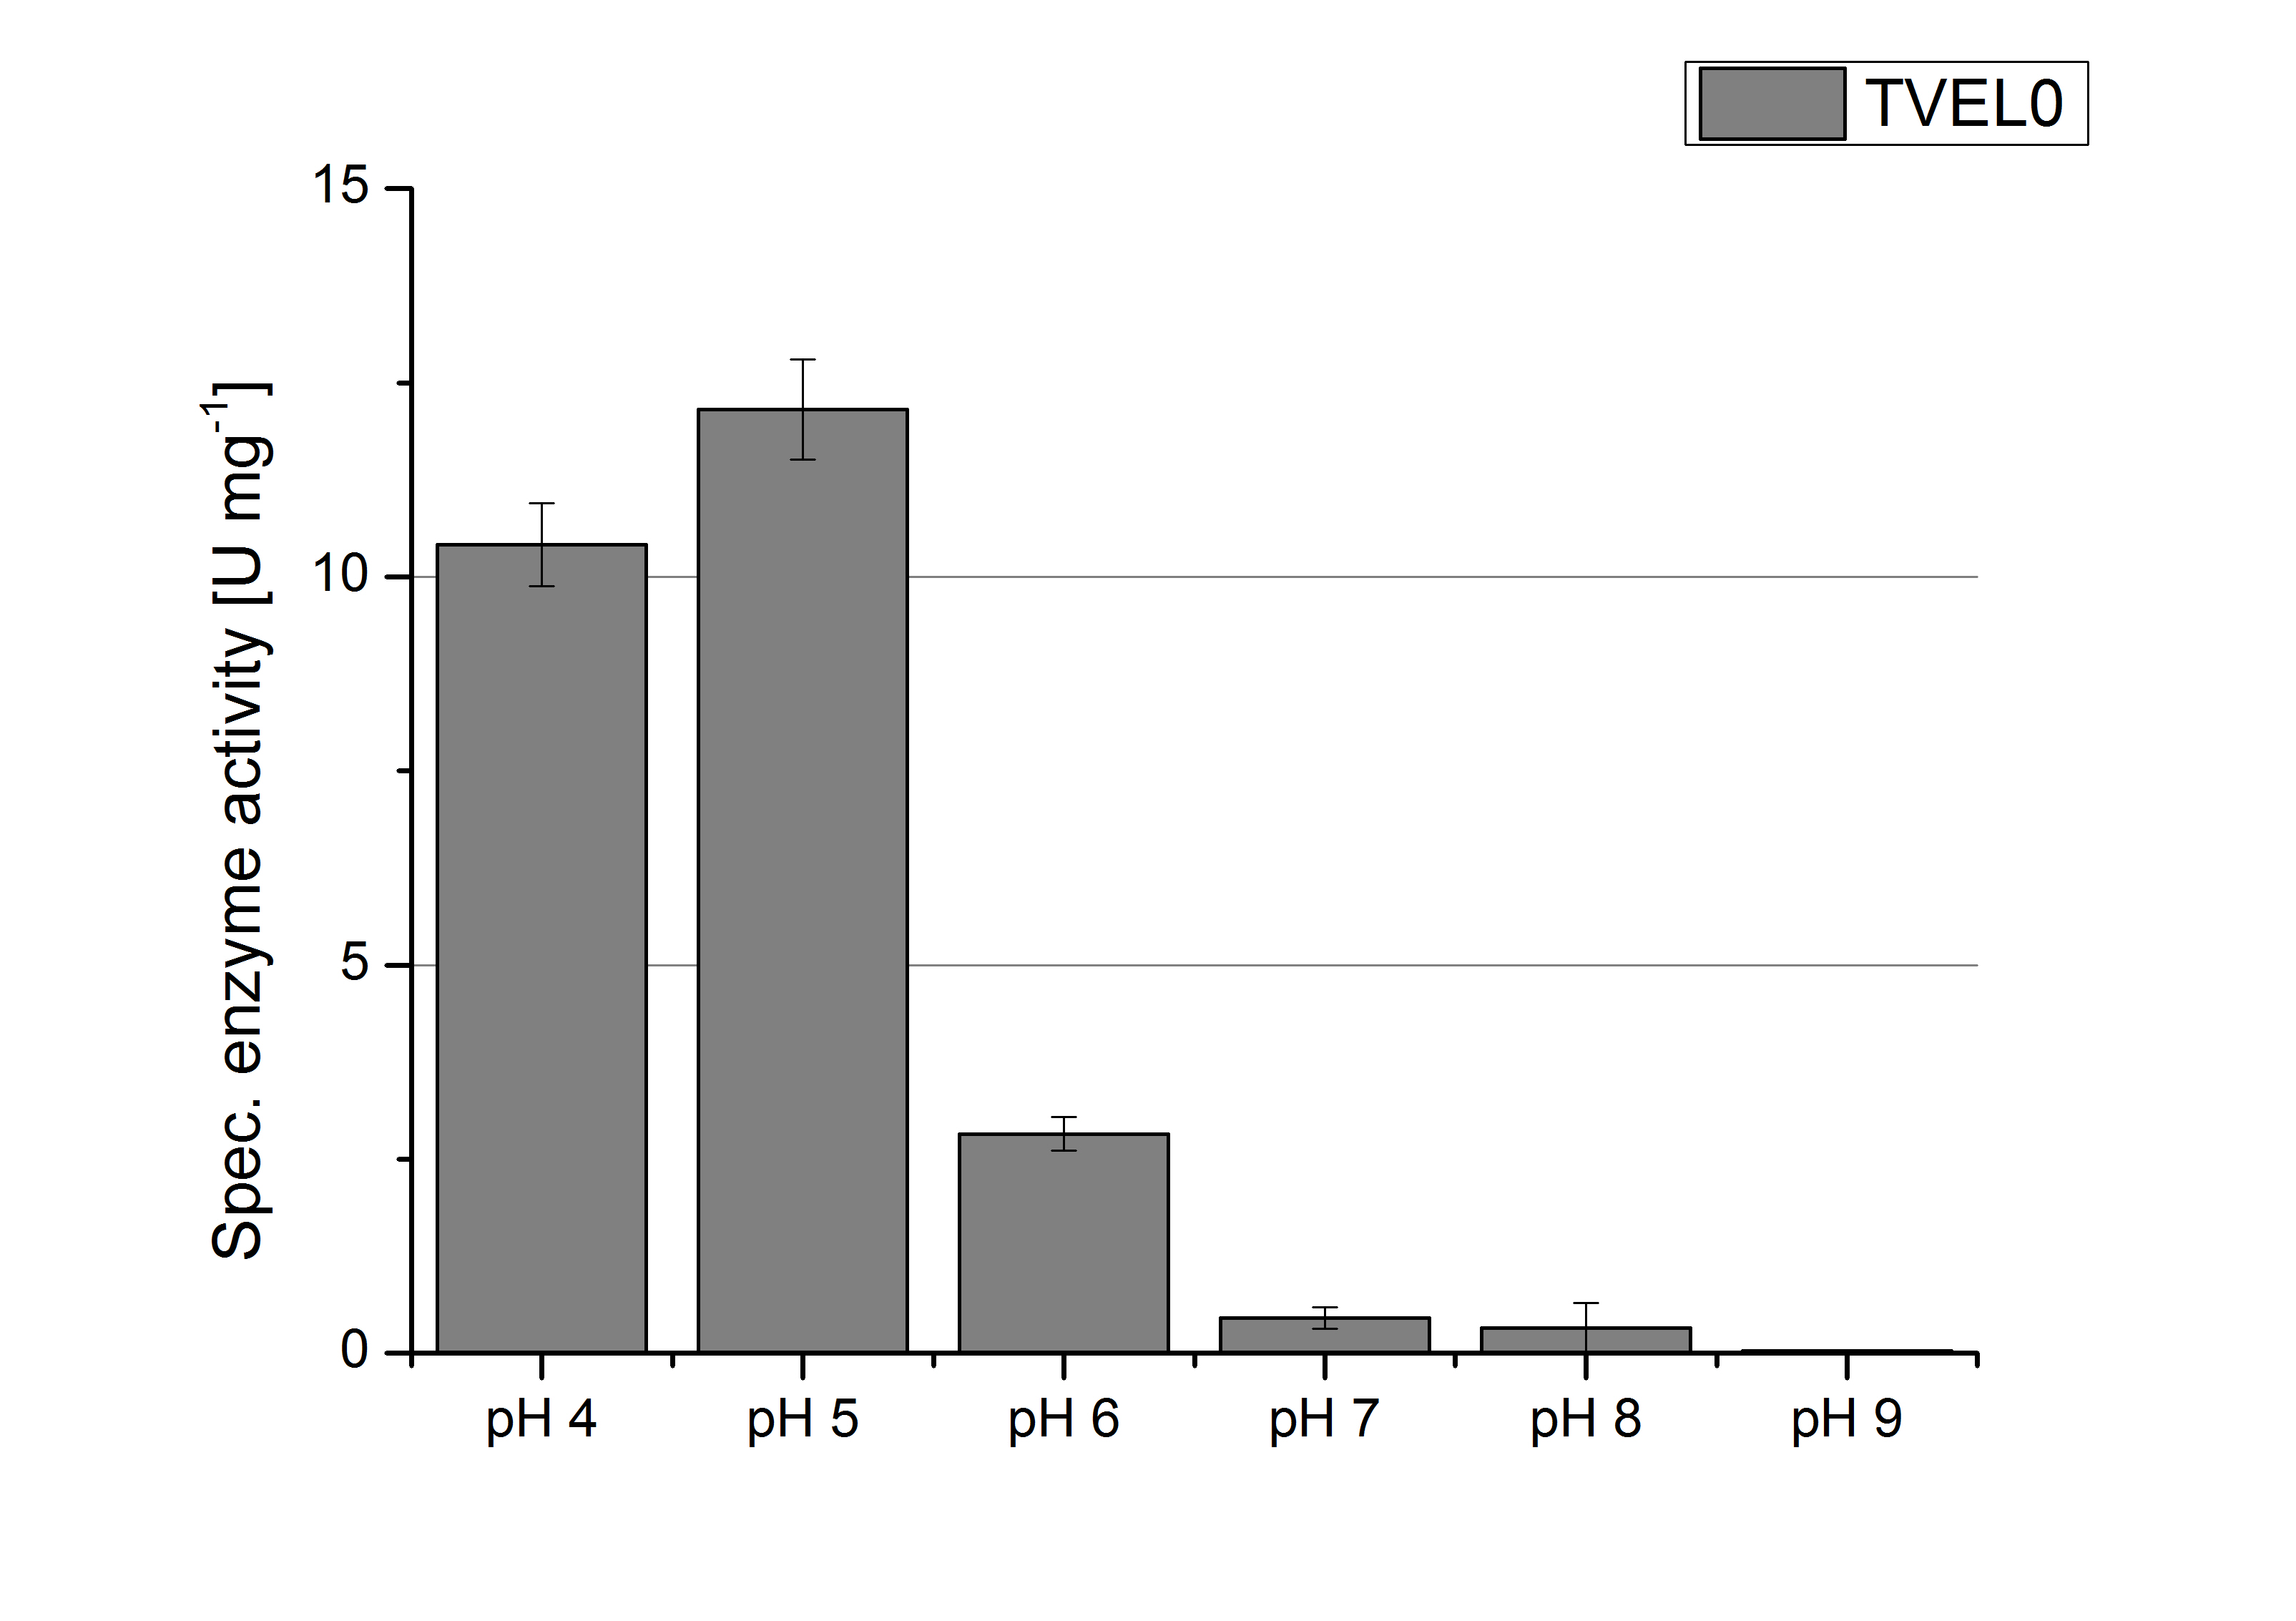
To determine the optimal experimental setup for TVEL0 activity measurements, the best pH had to be determined. Using Britton-Robinson buffer pHs between pH 4 and pH 9 had been adjusted. 308 ng TVEL0 per well had been tested under these pH conditions using 5 mM ABTS. TVEL0 showed a high activity at pH 4 and pH 5, where most of ABTS was oxidized (compared to Fig. 6 and 7). The calculated specific enzyme activity of TVEL0 showed high activity at both mentioned pHs (Fig. 7). While TVEL0 had an activity of ~12 U mg-1 at pH 4 and pH 5, the enzyme activity decreased at higher pHs. At a pH of 6 only 1/4 of enzyme activity could be detected compared to the activity at pH 4 and pH 5. This results help us to compare our produced enzymes with TVEL0 as a standard.
Since Regionals: TVEL0 activity at different temperatures
To investigate the activity of TVEL0 at temperatures that will apply at a waste water treatment plant throughout the year, activity tests were performed at 10 °C and 25 °C as described above. The measurements were conducted for 30 minutes. The obtained results revealed a lower activity of TVEL0 at 10 °C in comparison to 25 °C (see Fig. 8). The obtained results were used to calculate the specific enzyme activity which was at 11 and 13 U mg-1, respectively (see Figure 9). The negative control without TVEL0 but 0.4 mM CuCl2 at 10 °C and 25 °C showed a negligible oxidation of ABTS. The activity of TVEL0 was increased to about 84 % at 10 °C.
Immobilisation
Figure 10 shows the percentage of laccases bound after incubation with CPC-beads, relative to the original concentration. The concentration of laccases in the supernatant after incubation was measured using Roti®-Nanoquant. The results showed that only 18 % of TVEL0 laccases was still present in the supernatant. This illustrates that TVEL0 was successfully immobilized on the CPC-beads.
In figure 11, the enzymatic activity of TVEL0 in the supernatant is compared to the activity of nontreated TVEL0. Although an activity can already be detected in the supernatant, this activity is low compared to the original.
Figure 12 shows the illustration of ABTS oxidation by TVEL0 with time compared to the negative control. The increase in ABTS oxidized proves laccase activity even if a direct comparison with the original and not immobilized laccase solution was not possible due to the very high activity of TVEL0, which could not be measured properly.
| 55px | | | | | | | | | | |
 "
"


