Team:University College London/Module 5/Results
From 2012.igem.org
Sednanalien (Talk | contribs) (→Characterisation of BBa_K729005 (IrrE)) |
(→Characterisation of BBa_K398108 for Comparison) |
||
| (35 intermediate revisions not shown) | |||
| Line 6: | Line 6: | ||
== Characterisation of BBa_K729005 (IrrE) == | == Characterisation of BBa_K729005 (IrrE) == | ||
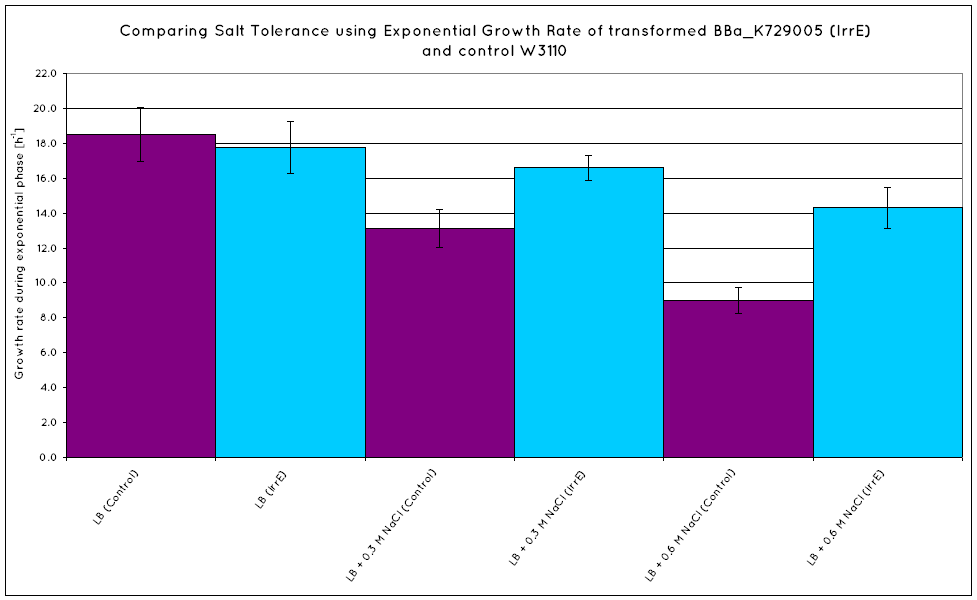
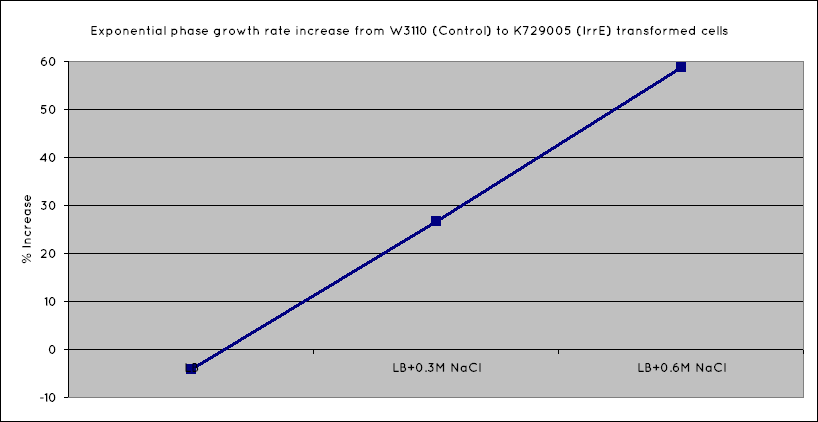
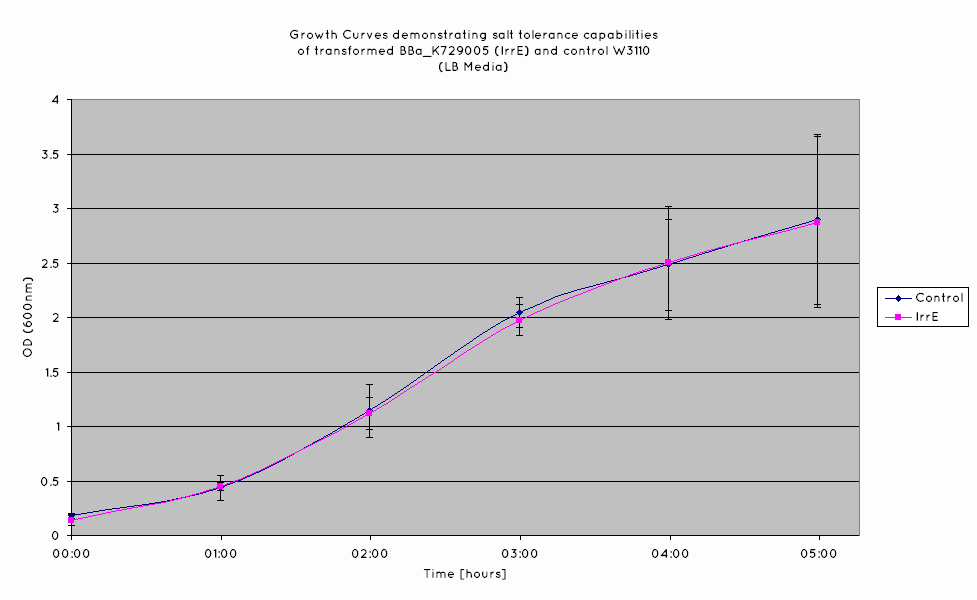
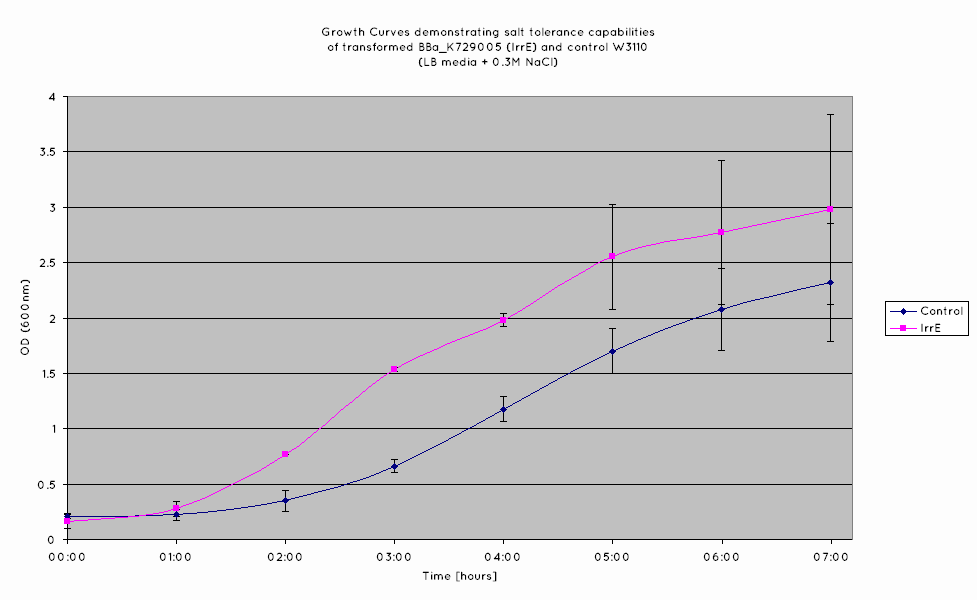
| - | From our results, we observed that ''E. | + | From our results, we observed that ''E. coli'' transformed with the IrrE gene exhibits greater salt tolerance than their non-transformed counterparts. This is revealed in the greater optical density (OD) the cells grow to in high salt media, as well as their increased growth rates in the exponential growth phase. Our results are consistent with the results obtained in the original <span class="footnote" title="Pan">paper</span>, establishing the fact that our cells are indeed expressing the IrrE global regulator. |
| - | + | [[File:UniversityCollegeLondon_IrrE_Growth_Rate.png|475px]] | |
| + | [[File:UniversityCollegeLondon_IrrE_Growth_Rate_%_Increase.png|475px]] | ||
| + | [[File:UniversityCollegeLondon_IrrE_LB1.png|475px]] | ||
| + | [[File:UniversityCollegeLondon_IrrE_0.3M_NaCl1.png|475px]] | ||
| + | [[File:UniversityCollegeLondon_IrrE_0.6M_NaCl1.png|475px|centre]] | ||
| - | + | == Characterisation of BBa_K398108 for Comparison == | |
| - | |||
| - | + | We have observed that the results we have obtained for the characterisation of BBa_K398108 are consistent with those of the TU Delft '10 iGEM team. From the growth curves obtained (see graph below), an increase growth rate during the exponential phase is observed in ''E. Coli'' expressing BBa_K398108 as opposed to the wild type when the salt concentration of the media is elevated. | |
| - | + | However, while we have managed to replicate the results of the TU Delft '10 iGEM team, we question the viability of this BioBrick for conferring salt tolerance in ''E. coli''. While the growth rate is improved for the cells expressing the BioBrick, the overall cell density is not - from our results, the final OD of the cells in the stationary phase is not higher than that of the wild-type. | |
| + | Examining the <span class="footnote" title="Pan">literature</span>, a better gauge of salt tolerance can be found via an increase in OD over the wild type cells in increased salt concentrations, which this BioBrick has not been shown to do. As such, the choice to use K398108 to confer salt tolerance on our cells would remain questionable at best. | ||
| - | + | [[File:UniversityCollegeLondon Salt Tolerance K398108 Growth Curve.png|470px]] | |
| + | [[File:UniversityCollegeLondon_Salt_Tolerance_K398108_Growth_rate.png|470px]] | ||
| - | + | As the only available evidence for the function of the TU Delft ’10 Salt Tolerance BioBrick (K398108) comes from analysis of the growth rate during the exponential phase, this is used to draw direct performance comparison with the UCL ’12 BioBrick (K729005) (NB: TU Delft '10 data approximate and based on info taken from the team's wiki) which it has already been shown provides this role. The plot below highlights the impressive performance advantage that the UCL construct has over the previous BioBrick for enduring a high salinity environment. | |
| - | + | ||
| - | + | ||
| - | + | [[File:UniversityCollegeLondon_Salt_Tolerance_Growth_Comp.png|650px|centre]] | |
| + | We also wanted to investigate if irrE has any effect on W3110 growth in marine broth. From the graph bellow it is evident that irrE presence improves W3110 growth in marine broth. ''(For the measurements' data please see week 17 on our lab book).'' | ||
| - | + | [[File:Growth_of_W3110_W3110%26irrE_indolifex_in_LB_and_M.png]] | |
Latest revision as of 01:34, 27 October 2012
Module 5: Salt Tolerance
Description | Design | Construction | Characterisation | Modelling | Results | Conclusions
Characterisation of BBa_K729005 (IrrE)
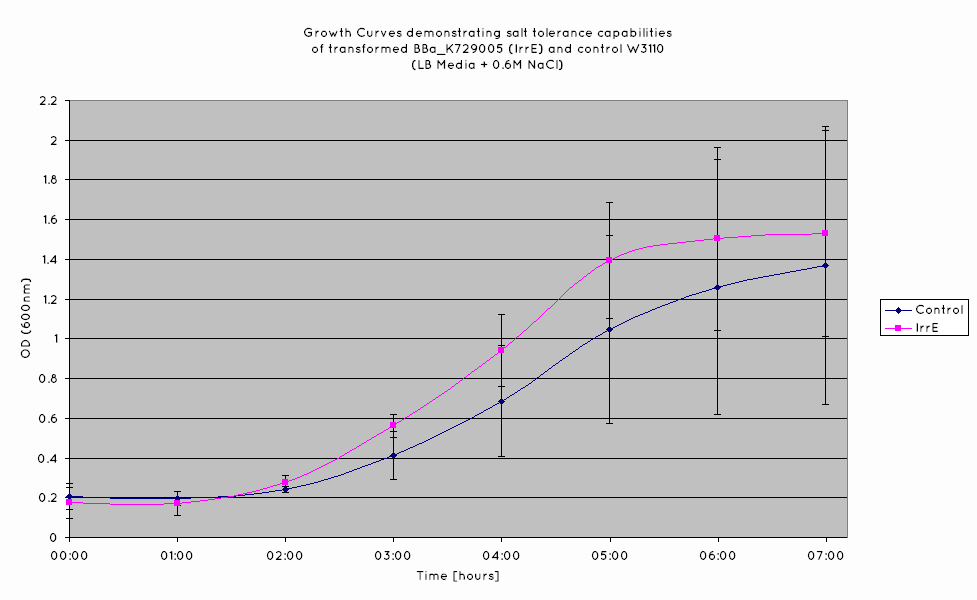
From our results, we observed that E. coli transformed with the IrrE gene exhibits greater salt tolerance than their non-transformed counterparts. This is revealed in the greater optical density (OD) the cells grow to in high salt media, as well as their increased growth rates in the exponential growth phase. Our results are consistent with the results obtained in the original paper, establishing the fact that our cells are indeed expressing the IrrE global regulator.
Characterisation of BBa_K398108 for Comparison
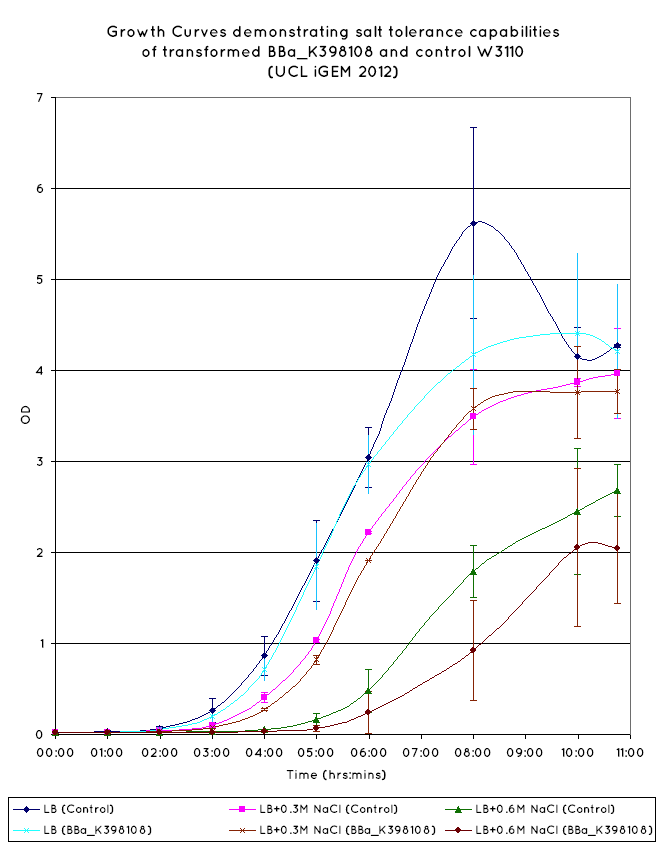
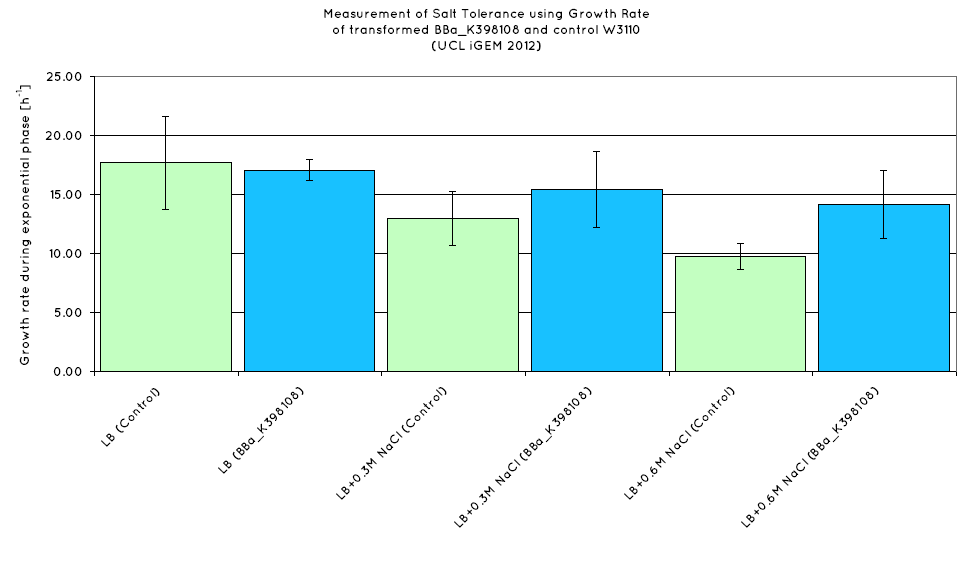
We have observed that the results we have obtained for the characterisation of BBa_K398108 are consistent with those of the TU Delft '10 iGEM team. From the growth curves obtained (see graph below), an increase growth rate during the exponential phase is observed in E. Coli expressing BBa_K398108 as opposed to the wild type when the salt concentration of the media is elevated.
However, while we have managed to replicate the results of the TU Delft '10 iGEM team, we question the viability of this BioBrick for conferring salt tolerance in E. coli. While the growth rate is improved for the cells expressing the BioBrick, the overall cell density is not - from our results, the final OD of the cells in the stationary phase is not higher than that of the wild-type.
Examining the literature, a better gauge of salt tolerance can be found via an increase in OD over the wild type cells in increased salt concentrations, which this BioBrick has not been shown to do. As such, the choice to use K398108 to confer salt tolerance on our cells would remain questionable at best.
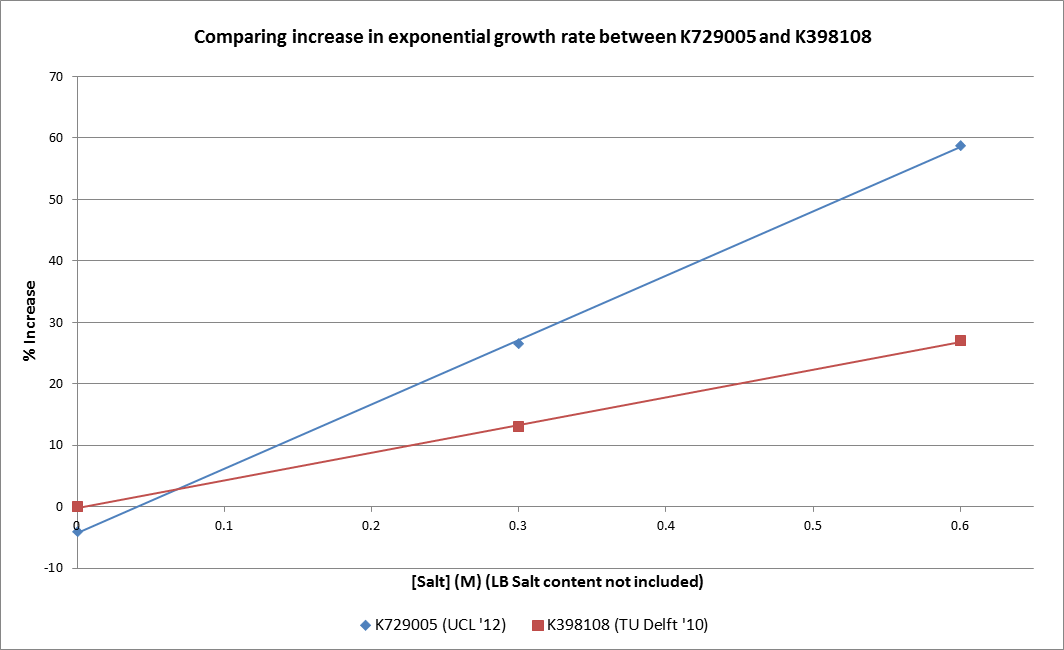
As the only available evidence for the function of the TU Delft ’10 Salt Tolerance BioBrick (K398108) comes from analysis of the growth rate during the exponential phase, this is used to draw direct performance comparison with the UCL ’12 BioBrick (K729005) (NB: TU Delft '10 data approximate and based on info taken from the team's wiki) which it has already been shown provides this role. The plot below highlights the impressive performance advantage that the UCL construct has over the previous BioBrick for enduring a high salinity environment.
We also wanted to investigate if irrE has any effect on W3110 growth in marine broth. From the graph bellow it is evident that irrE presence improves W3110 growth in marine broth. (For the measurements' data please see week 17 on our lab book).
 "
"
