Team:University College London/Module 6/Modelling
From 2012.igem.org
(→Modelling) |
(→Modelling) |
||
| (2 intermediate revisions not shown) | |||
| Line 31: | Line 31: | ||
[[File:nucleasegraph.jpg]] | [[File:nucleasegraph.jpg]] | ||
| + | |||
| + | |||
By plotting the graph in Microsoft Excel, we obtain a logarithmic graph with the equation: | By plotting the graph in Microsoft Excel, we obtain a logarithmic graph with the equation: | ||
| - | [[File:nucleaseexcel.jpg]] | + | [[File:nucleaseexcel.jpg|center]] |
| + | |||
| + | |||
| + | By plotting the graph in Microsoft Excel, we obtain a logarithmic graph with the equation: | ||
| + | |||
| + | [[File:nuclease4.jpg]] | ||
| + | |||
| + | The equation can be used to inform experiments on the relationship between colony mass and halo diameter by predicting d_h given M and vice versa. | ||
{{:Team:University_College_London/templates/foot}} | {{:Team:University_College_London/templates/foot}} | ||
Latest revision as of 02:52, 27 September 2012
Module 6: Containment
Description | Design | Construction | Characterisation | Modelling | Results | Conclusions
Modelling
Aim
For our containment module, we’ve created a model that shows how widespread the activity of nuclease would be given a certain colony. This would allow predictions to be made on how large a cell colony will be required to generate a halo diameter (indicating a DNA-free zone where the nuclease has digested the DNA in the agar) of desired size.
Methods
From the DNase agar test, the colony diameter,d, halo diameter,d_h, and absorbance at 600 OD were measured. From the absorbance values, we work out the cell concentration in cell per litres. This is done using a [http://www.genomics.agilent.com/CalculatorPopupWindow.aspx?CalID=7 third party calculator generated by Aligent Technologies].
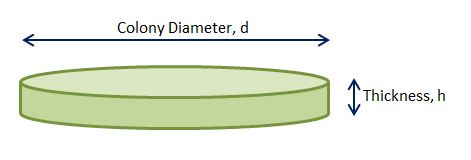
By assuming that the whole colonies are in some sort of cylindrical form, we can calculate their total volume using the colony diameter that is measured. The following figure depicts this.
Thus, the volume,V, of the cell colonies in cubic meters would be:
We can then calculate the number of cells, n, using information from absorbance and cell concentration, C, and hence the mass of the colony, M.
We’ve measured the thickness of the colonies to be about 1µm. Results obtained were:
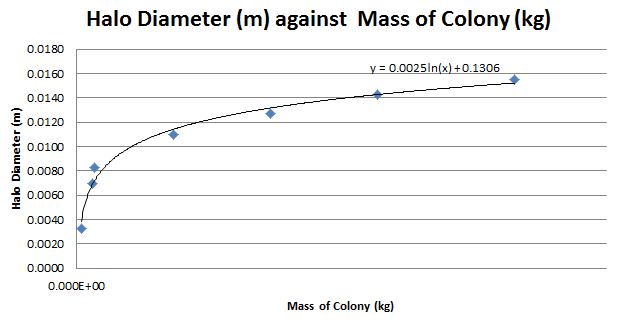
By plotting the graph in Microsoft Excel, we obtain a logarithmic graph with the equation:
By plotting the graph in Microsoft Excel, we obtain a logarithmic graph with the equation:
The equation can be used to inform experiments on the relationship between colony mass and halo diameter by predicting d_h given M and vice versa.
 "
"


