"
"
Team:TU-Delft/Modeling/Diffusion
From 2012.igem.org
| (152 intermediate revisions not shown) | |||
| Line 1: | Line 1: | ||
| - | {{:Team:TUDelft/Scripts}}{{:Team:TUDelft/ | + | {{:Team:TUDelft/Scripts}}{{:Team:TUDelft/CSS}}{{:Team:TUDelft/menu}} |
<html> | <html> | ||
<head><title>Diffusion Model</title></head> | <head><title>Diffusion Model</title></head> | ||
| Line 6: | Line 6: | ||
<img src="https://static.igem.org/mediawiki/igem.org/7/74/Background_greenlamp.jpg" class="bg_team"></img> | <img src="https://static.igem.org/mediawiki/igem.org/7/74/Background_greenlamp.jpg" class="bg_team"></img> | ||
<div id="logo_ed"><a href="https://2012.igem.org/Team:TU-Delft" 'onfocus=this.blur()'><img src="https://static.igem.org/mediawiki/igem.org/8/88/Logoigemklein.png" border="0" width="100" height="100"></a></div> | <div id="logo_ed"><a href="https://2012.igem.org/Team:TU-Delft" 'onfocus=this.blur()'><img src="https://static.igem.org/mediawiki/igem.org/8/88/Logoigemklein.png" border="0" width="100" height="100"></a></div> | ||
| + | <div id="contentbox" style="text-align:justify;"> | ||
| - | <img src="https://static.igem.org/mediawiki/igem.org/8/ | + | <img src="https://static.igem.org/mediawiki/igem.org/8/81/Diffusionmodel.jpg" align="middle" width="100%"> |
| - | </body></html> | + | |
| + | </div> | ||
| + | </body> | ||
| + | </html> | ||
<div id="contentbox" style="text-align:justify;"> | <div id="contentbox" style="text-align:justify;"> | ||
| - | One of the main objectives of the project was to synthesize a practical device, the '''Snifferometer''' for tuberculosis detection. As a first step towards | + | One of the main objectives of the project was to synthesize a practical device, the '''Snifferometer''' for tuberculosis detection. As a first step towards this, we built a spatio temporal 2D reaction-diffusion system which was implemented in COMSOL multiphysics. Combining the behaviours of the diffusion and the pathway model, helped us get a better understanding of how such a device could be implemented and the response times involved in such a process. |
| - | = | + | = The device set up = |
| - | + | The device at the bottom has a membrance preventing the yeast coming in direct contact with [[File:SnifferometerCAD.png|200px|left|thumb|'''Figure 5''': Computer aided design of the Snifferometer]]external substances, above which is a layer of agar in which yeast is placed,the nutrients for it's growth is fed in through a channel along the sides of the tube using which the yeast cells can also be replaced as and when needed. A micro-optrode is then used to sense the photons emitted by the fluoroscent proteins. A key question was the time it took for the ligand to diffuse into the layer of yeast. To answer this question, the System was modeled as a 1D diffusion problem using PDE’s. | |
| - | [ | + | The values for various dimensions of the model were chosen using an iterative approach of design and analysis which would yield an optimal response. The model dimensions can be obtained from the code in the codes section. Once the structure of the device was designed, a simple reaction model assuming linear kinetics was implemented in the agar layer using the results of the single cell pathway model([https://2012.igem.org/Team:TU-Delft/Modeling/SingleCellModel#Results '''Results''']) |
| + | </div> | ||
| + | <div id="contentbox" style="text-align:justify;"> | ||
| + | |||
| + | = Modeling Approach = | ||
| + | == PDEs == | ||
| + | The diffusion phenomenon is modelled by '''Fick's second law'''. | ||
| + | https://static.igem.org/mediawiki/igem.org/8/83/DiffusionFormula1.PNG | ||
| + | |||
| + | where C represents the ratio of the pressure between gasphase and atmosphere, x is the distance from the surface of petridish to the agar layer, and D is the diffusion coefficient, the value of which is calculated from [1]. | ||
| + | |||
| + | In order to solve PDEs, numerical methods are used as approximation. | ||
| + | |||
| + | On the left side of the equation, the Euler forward method is taken: | ||
| + | |||
| + | https://static.igem.org/mediawiki/igem.org/1/1a/DiffusionFormula2.PNG | ||
| + | |||
| + | On the right side of the equation, the central differential method is used: | ||
| + | |||
| + | https://static.igem.org/mediawiki/igem.org/b/b6/DiffusionFormula3.PNG | ||
| + | |||
| + | It can be noticed that the equations both to the right and left of the equality are the same. | ||
| + | |||
| + | https://static.igem.org/mediawiki/igem.org/3/35/DiffusionFormula4.PNG | ||
| + | |||
| + | Therefore, the PDEs can be numerically replaced by the equation: | ||
| - | + | https://static.igem.org/mediawiki/igem.org/4/4c/DiffusionFormula5.PNG | |
| - | + | where https://static.igem.org/mediawiki/igem.org/b/b8/DiffusionFormula6.PNG. In the implementation by MATLAB, dx is taken as the interval of x. | |
| - | |||
== Boundary conditions == | == Boundary conditions == | ||
| - | Two boundary conditions are set for these two surfaces of petridish- | + | In order to solve this equation, boundary conditions are required. Two boundary conditions are set for these two surfaces of petridish-air and air-agar. |
*At x=0, the Dirichlet boundary condition was placed: | *At x=0, the Dirichlet boundary condition was placed: | ||
| - | https://static.igem.org/mediawiki/igem.org/b/b8/ | + | https://static.igem.org/mediawiki/igem.org/archive/b/b8/20120926220011%21DirichletBC.PNG |
| - | with | + | with Csat being the pressure ratio with respect to the saturation pressure of the specific compound being IsoAmylAcetate as an example in our model. For IsoAmylAcetate this value is 533.3 Pa at room temperature. Thus Csat is equal to 0.05333. |
| - | *One can take Neumann boundary condition at x=l, where l is the distant between petridish and agar and assumed to be 0.01 meter. | + | *One can take Neumann boundary condition at x=l, where l is the distant between petridish and agar and assumed to be 0.01 meter in the model. The reason we can use Neumann boundary is because the molecules bounce back into the gasphase against the agar surface. |
https://static.igem.org/mediawiki/igem.org/e/ea/NeumannBC.PNG | https://static.igem.org/mediawiki/igem.org/e/ea/NeumannBC.PNG | ||
| - | + | The model was the simulated in matlab, the results of which are below | |
| - | + | ||
| - | + | ||
| - | + | ||
| - | + | </div> | |
| - | + | <div id="contentbox" style="text-align:justify;"> | |
| - | + | = Results = | |
| + | [[File:output of diffusionNew.png|320px|middle|thumb|'''Figure 2''': Simulation of diffusion model.(in 3D Cartesian coordinate, X axis is time, Y axis is the distance from the petridish, Z axis is the pressure ratio)]]Figures 2 and 3 depict the results of the simulation with distance dimension 0 - 0.01 meter and the time dimension 0 - 100 seconds. Two key observations were drawn from this model | ||
| + | *The results suggest that at approximately two minutes, there is steady state concentration at the agar layer | ||
| + | *The input to the single cell pathway model can be considered a step function, if we assume that the Ligand is not degraded by yeast. | ||
| + | |||
| - | + | *Matlab script for diffusion model can be found [https://static.igem.org/mediawiki/igem.org/c/c2/IGEM_Model_Pertidish.txt'''here''']. | |
| + | </div> | ||
| - | |||
| - | + | <div id="contentbox" style="text-align:justify;"> | |
| - | + | ||
| - | + | ||
| - | + | = Comsol Spatio-Temporal Model = | |
| - | + | A spatio temporal 2D reaction-diffusion system which was implemented in COMSOL multiphysics. Combining the behaviours of the diffusion and the pathway model.The simulation of which is shown below. | |
| - | + | ||
| - | + | ||
| - | + | ||
| - | + | ||
| - | + | ||
| - | + | ||
| + | <html> | ||
| + | <center> | ||
| + | <iframe width="560" height="315" src="http://www.youtube.com/embed/qoObgkd4tsY" frameborder="0" allowfullscreen></iframe> | ||
| + | <h6>In case the place seems to be blank, zoom into the page by using Ctrl + Mouse-wheel and hit F5.</h6> | ||
| + | </center> | ||
| + | </html> | ||
</div> | </div> | ||
| + | |||
<div id="contentbox" style="text-align:justify;"> | <div id="contentbox" style="text-align:justify;"> | ||
| - | = | + | = Conclusion = |
| + | From the simulations and analysis it can be concluded that the response of the system can be improved by improving the kinetics of the signalling pathway and the diffusion has a limited influence on the system response. | ||
| - | + | </div> | |
| - | + | ||
| - | + | <div id="contentbox" style="text-align:justify;"> | |
| + | = Comsol Code = | ||
| + | === Final Model === | ||
| + | [[File:TUD-Download.png|50px|link=http://thenewview.eu/igem/feromone.mph|left]] | ||
| + | <br clear="all" /> | ||
</div> | </div> | ||
| + | |||
<div id="contentbox" style="text-align:justify;"> | <div id="contentbox" style="text-align:justify;"> | ||
| - | |||
| - | |||
= References = | = References = | ||
| - | Chen, N. H. (1962). New Generalized Equation for Gas Diffusion Coefficient. J. Chem. Eng. Data, 37–41. | + | <h6> |
| - | + | 1. Chen, N. H. (1962). New Generalized Equation for Gas Diffusion Coefficient. J. Chem. Eng. Data, 37–41. | |
| + | </h6> | ||
| + | <h6> | ||
| + | 2. Comsol Multiphysics. | ||
| + | </h6> | ||
</div> | </div> | ||
<html><img src="https://static.igem.org/mediawiki/igem.org/3/37/Footer_2.jpg" align="middle" width="690"> | <html><img src="https://static.igem.org/mediawiki/igem.org/3/37/Footer_2.jpg" align="middle" width="690"> | ||
<a href='https://2012.igem.org/Main_Page' target="_blank"><div id='logo_igem2'></div><a/></body></html> | <a href='https://2012.igem.org/Main_Page' target="_blank"><div id='logo_igem2'></div><a/></body></html> | ||
Latest revision as of 01:46, 27 October 2012

One of the main objectives of the project was to synthesize a practical device, the Snifferometer for tuberculosis detection. As a first step towards this, we built a spatio temporal 2D reaction-diffusion system which was implemented in COMSOL multiphysics. Combining the behaviours of the diffusion and the pathway model, helped us get a better understanding of how such a device could be implemented and the response times involved in such a process.
Contents |
The device set up
The device at the bottom has a membrance preventing the yeast coming in direct contact with
The values for various dimensions of the model were chosen using an iterative approach of design and analysis which would yield an optimal response. The model dimensions can be obtained from the code in the codes section. Once the structure of the device was designed, a simple reaction model assuming linear kinetics was implemented in the agar layer using the results of the single cell pathway model(Results)
Modeling Approach
PDEs
The diffusion phenomenon is modelled by Fick's second law.
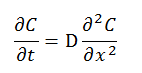
where C represents the ratio of the pressure between gasphase and atmosphere, x is the distance from the surface of petridish to the agar layer, and D is the diffusion coefficient, the value of which is calculated from [1].
In order to solve PDEs, numerical methods are used as approximation.
On the left side of the equation, the Euler forward method is taken:
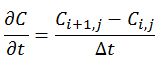
On the right side of the equation, the central differential method is used:
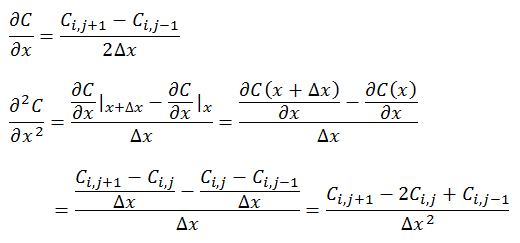
It can be noticed that the equations both to the right and left of the equality are the same.
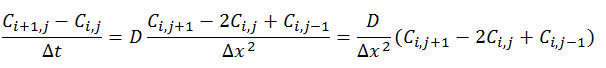
Therefore, the PDEs can be numerically replaced by the equation:
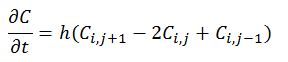
where  . In the implementation by MATLAB, dx is taken as the interval of x.
Boundary conditions
In order to solve this equation, boundary conditions are required. Two boundary conditions are set for these two surfaces of petridish-air and air-agar.
- At x=0, the Dirichlet boundary condition was placed:
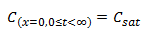
with Csat being the pressure ratio with respect to the saturation pressure of the specific compound being IsoAmylAcetate as an example in our model. For IsoAmylAcetate this value is 533.3 Pa at room temperature. Thus Csat is equal to 0.05333.
- One can take Neumann boundary condition at x=l, where l is the distant between petridish and agar and assumed to be 0.01 meter in the model. The reason we can use Neumann boundary is because the molecules bounce back into the gasphase against the agar surface.
The model was the simulated in matlab, the results of which are below
Results

- The results suggest that at approximately two minutes, there is steady state concentration at the agar layer
- The input to the single cell pathway model can be considered a step function, if we assume that the Ligand is not degraded by yeast.
- Matlab script for diffusion model can be found here.
Comsol Spatio-Temporal Model
A spatio temporal 2D reaction-diffusion system which was implemented in COMSOL multiphysics. Combining the behaviours of the diffusion and the pathway model.The simulation of which is shown below.
In case the place seems to be blank, zoom into the page by using Ctrl + Mouse-wheel and hit F5.
Conclusion
From the simulations and analysis it can be concluded that the response of the system can be improved by improving the kinetics of the signalling pathway and the diffusion has a limited influence on the system response.
Comsol Code
Final Model