 "
"
Team:Slovenia/Notebook
From 2012.igem.org

- Home
- Idea
- The switch
- Overview
- Designed TAL regulators
- Mutual repressor switch
Positive feedback loop switch 
Controls
- Safety mechanisms
- Overview
- Escape tag
- Termination
Microcapsule degradation
- Implementation
- Modeling
- Overview
Pharmacokinetics - Modeling methods
- Mutual repressor switch
- Positive feedback loop switch
Experimental model Interactive simulations
- Parts
- Notebook
- Experimental methods
Lablog - Lab safety
- Society
- Team
- Team members
- Attributions
Collaborations - Gallery
- Sponsors
Experimental methods
- Cloning
- Cell cultures
- Induction systems
- Effectors
- Microscopy
- Flow cytometry
- Microencapsulation
- Protein detection

|
| Figure 1. Schematic presentation of methods used for cloning and culturing eukaryotic cells. |
 |
 |
 |
 |
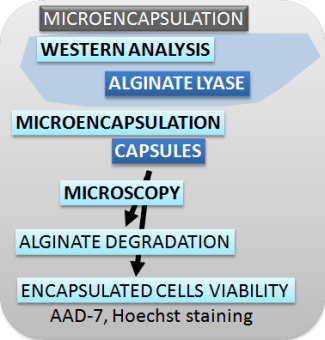
| Figure 2. Schematic presentation of methods used for characterizing the switch, safety mechanisms, microencapsulation and effectors. |
Cloning
Plasmid DNA isolation
MINI PREPs for analysis and sequencing
- A single colony was picked from a LB-agar plate or glycerol stock and inoculated in 10 mL of LB-medium with the appropriate antibiotic for selection (100 mg/L ampicillin, 50 mg/L kanamycin, 35 mg/L chloramphenicol).
- Bacteria were grown over night at 37 °C with agitation.
- Plasmid DNA was isolated from 6-10 mL of over-night culture with GeneJET plasmid miniprep kit according to the manufacturer's protocol.
- Amounts ranging from 6-10 µg of plasmid DNA were obtained.
- The purity and concentration of the isolated DNA was analysed using NanoDrop.
Fragment DNA isolation from agarose gel
AGAROSE ELECTROPHORESIS
- A mixture of different sized DNA fragments was separated on an agarose gel (from 0.7 to 2% agarose in 1x TAE buffer and 0.1 µg/ml ethidium bromide) at a constant voltage of 100 V.
- UV light (λ = 254 nm) was used to visualize DNA with intercalated ethidium bromide
FRAGMENT ISOLATION from agarose gel
- The band with the desired DNA fragment was excised from the gel, using a clean scalpel.
- DNA was isolated from the gel slice with GeneJet Gel Extraction Kit according to the manufacturer’s protocol.
- Purity and amount of DNA was determined using NanoDrop.
Restriction digest
- To digest the desired DNA restriction reactions were prepared as follows:
- 2µl of the appropriate restriction buffer (10X)
- 0.5 µL restriction enzyme
- Bring volume to 20 µL with nuclease-free water.
- 2µl of the appropriate restriction buffer (10X)
- up to 2 µL restriction enzyme
- Bring volume to 50 µL with nuclease-free water.
- The sample was incubated at optimal temperature for the restriction enzymes.
- Analysis of fragmented DNA was done by gel electrophoreses.
- Desired DNA fragment was excised and purified using suitable DNA purification kit.
- for analysis of cloned DNA
- for isolation of specific DNA
PCR reaction
AccuPrime and Phusion DNA polymerase were used for DNA amplification. Colony PCR was performed with Taq DNA polymerase.
- The master mix for reactions with Phusion DNA polymerase contained:
- DNA (1-10 ng)
- both primers (0,4 pmol/µl )
- 1x Phusion HF buffer
- 0,2 µM dNTPs
- Phusion polymerase (0,02 U/ µl) and
- MQ up to final volume of 25 µl
-
The master mix for reactions with AccuPrime DNA polymerase contained:
- DNA (10 ng),
- both primers (0,4 pmol/µl ),
- 1xRnx mix,
- enzyme (0,05 U/ µl) and
- MQ up to final volume of 50 µl.
-
The master mix for reactions with Taq DNA polymerase contained:
- both primers (0,4 pmol/µl),
- 1x Taq PCR buffer II,
- 0,2 µM dNTPs,
- 5mM MgSO4,
- enzyme (0,125 U/ µl) and
- MQ up to total volume of 20 µl.
- Then the bacterial colony was added to the reaction mix.
- All temperature profiles were optimized according to manufacturer’s protocol,the melting temperature of primers, and the length of the desired PCR products. Reactions were performed in the Applied Biosystems Veriti 96 well thermal cycler.
PCR product purification. Desired PCR products were purified by GeneJet Gel Extraction Kit according to the manufacturer's protocol.
DNA concentration. An aliquot of the isolated DNA was analyzed using NanoDrop.
Gibson assembly
Gibson assembly master mix was prepared according to the protocol published in Gibson et al., 2009.
- 50 ng of each PCR product was added to the Gibson assembly master mix and incubated at 50 °C 1h.
- After incubation, the entire master mix volume was transformed into competent bacterial cells.
Ligation
T4 ligase ligates the 5' phosphate and the 3'-hydroxyl groups of DNA.
- Vector and insert concentrations were estimated and insert and vector fragments joined in a molar ratio of 3:1 (100-150ng Vector DNA).
- A ligation mixture was prepared:
- Blunt-end ligation reactions were incubated at 17 °C for 4 to 18 hours.
- After incubation part of the ligation mixture was used for the transformation of bacterial cells (see: transformation of bacteria).
1X ligase buffer (10X)
1 µL T4 ligase (3 U/µL)
Bring volume to 10 or 20 µL with nuclease-free water. or
Culturing bacteria
For plasmid DNA propagation two bacterial strains were used: DH5alpha [fhuA2Δ(argF-lacZ)U169 phoA glnV44 Φ80 Δ(lacZ)M15 gyrA96 recA1 relA1 endA1 thi-1 hsdR17] and TOP10 [mcrA, Δ(mrr-hsdRMS-mcrBC), Phi80lacZ(del)M15, ΔlacX74, deoR, recA1, araD139, Δ(ara-leu)7697, galU, galK, rpsL(SmR), endA1,nupG].
Growth media for bacteria
Luria Broth (LB) : 10 g/L tryptone, 5 g/L yeast extract, 10 g/L NaCl, media is supplemented with suitable antibiotics depending on the selection marker on the transfected plasmid: ampicilin 100 mg/L or kanamycin 50 mg/L.
LB agar plates: LB with 1.5% agar, media is supplemented with suitable antibiotics depending on the selection marker on the transfected plasmid.
Transformation of bacteria
E. coli DH5alpha and TOP10 competent cells were used for the propagation of plasmid DNA.
- 100 µL of competent cells were thawed on ice.
- 50 – 400 ng DNA solution was added to competent bacterial cells (depending on the concentration of the DNA solution).
- A mixture of cells and DNA solution was incubated on ice for 30-60 minutes.
- The mixture was heat-shocked for 3 minutes at 42 °C.
- Cooled for 3 minutes on ice.
- 500 µL of preheated antibiotic free LB-medium was added and incubated for one hour at 37 °C with agitation for the purpose of inducing antibiotic resistance.
- The selection for plasmid containing and therefore antibiotic resistant bacteria was conducted by plating them on antibiotic containing LB-agar plates.
Glycerol stock for long term storage of bacteria
- 1 mL of an overnight culture was added to 150 µL of 80% glycerol into a cryo-tube.
- Mixed and incubated at room temperature for 30 minutes.
- Afterwards the glycerol stock was stored at -80 °C.
Cell cultures
Eucaryotic cell lines and cultivation
HEK293 is a human cell line derived from kidney cells and grows in a monolayer culture. Cells were grown in DMEM medium supplemented with 10% FBS.
HEK293T cell line is derived from HEK293 cells. HEK293T cells express the SV40 large T-antigen that enables episomal replication of plasmids containing the SV40 origin of replication in transfected cells. Cells were grown in DMEM medium supplemented with 10% FBS.
NK-92 is an interleukin-2 (IL-2) dependent natural killer cell line derived from peripheral blood mononuclear cells from patient with non-Hodgkin's lymphoma. The cell line is cytotoxic to a wide range of malignant cells. Cells were grown in RPMI medium supplemented with 20% FBS and 100 U/ml IL-2.
Subculturing monolayer cell cultures
- Remove and discard culture medium from a T-75 flask containing a monolayer of HEK293 or HEK293T cells.
- Rinse the T-75 flask with 10 ml of PBS buffer to remove all traces of growth medium (DMEM + 10% FBS) which otherwise inhibits trypsin function. Remove and discard the PBS buffer.
- Add 2-3 ml of trypsine solution and gently tilt the flask to ensure the trypsine solution covers all the cells. Incubate the cells in trypsin for 0,5 - 3 minutes.
- When the cells start to detach from the surface, add 7 ml of growth medium to the trypsin solution. Resuspend all remaining cells from the bottom of the T-75 flask by pipetting.
- Transfer the cell suspension to a 15 ml centrifuge tube.
- Centrifuge the cell suspension for 5 minutes at 1200 rpm.
- Remove the trypsin-containing medium from the centrifuge tube.
- Resuspend the cell pellet in fresh medium.
- Take as much cells as you need and add fresh medium to a total volume of 10 ml.
- Return the cells in a T-75 flask to the incubator (37 °C, 5 % CO2).
Cell plating
- Count cells.
- Calculate the desired number of cells per well. Dilute cells in DMEM with 10% FBS.
- Transfer the cells into an appropriate plate and place in a cell culture incubator.
Media and buffers
DMEM supplemented with: 1 % L-Glutamine (GlutaMax), 10 % FBS, Optionally: 1% Pen/Strep.
RPMI supplemented with: 1 % L-Glutamine (GlutaMax), 20 % FBS.
Transfection
TABLE: Transfection mixtures for different culture format| Culture format | jetPEI reagent per µg of DNA (µL) | Typical amount of DNA (ng) | Volume of 150 mM NaCl solution for DNA and jetPEI (µL) | Total transfection mixture volume (µL) |
|---|---|---|---|---|
| 96-well | 2 | 200 | 10 | 20 |
| 24-well and 8-well microscope chamber | 2 | 500 | 50 | 100 |
| 12-well | 2 | 1000 | 50 | 100 |
| 6-well | 2 | 2000 | 100 | 200 |
| 10 cm | 2 | 15000 | 250 | 500 |
- Dilute plasmid DNA to desired concentration in 150 mM NaCl, vortex gently and spin down briefly.
- Dilute jetPEI (PolyPlus) in 150mM NaCl, vortex gently and spin down briefly.
- Add the jetPEI solution to the DNA solution.
- Vortex the solution immediately and spin down briefly.
- Incubate for 15 to 30 minutes at room temperature.
- Add the jetPEI/DNA mix to the cells in and gently swirl the plate.
- Return the plate to a cell culture incubator.
Induction systems
Induction systems
To control our switch we needed a way to affect it from the outside. For this purpose we chose several inducible transcription systems where the controlled gene is expressed when a small molecule inducer (such as tetracycline) is present and is not expressed when the inducer is absent. We chose specific systems which do not cross react and whose inducers are orally bioavailable and safe for human use (Clackson, 2000). We decided for the systems based on tetracycline, pristinamycin, erythromycin and rapamycin analogs, as inducers. We then adapted these systems by cloning TAL regulators under their control to make them compatible with our genetic circuits.
Tetracycline, erythromycin and pristinamycin systems
The tetracycline, erythromycin and pristinamycin system all function in a similar manner. They are composed of a DNA binding protein (such as TetR) fused to a KRAB domain which reversibly binds a specific DNA sequence (TRE for example) and silences transcription from nearby promoters. The addition of an inducer causes the DNA binding domain to dissociate from the DNA and allows transcription to start. (Deuschle et al., 1995; Kramer et al., 2004)

Figure 1: Induced expression of TAL.
TABLE
| System | Tetracycline | Erythromycin | Pristinamycin |
|---|---|---|---|
| Regulating protein | TetR:KRAB | E:KRAB | PIP:KRAB |
| DNA sequence | TRE | ETR | PIR |
| Inducer | Tetracycline or doxycycline | Erythromycin | Pristinamycin |
| Constructs | pCMV_TRE_TAL-A:KRAB | pCMV_ETR_TAL-A:KRAB | pCMV_PIR_TAL-B:KRAB |
| pCMV_TRE_TAL-B:VP16 | pCMV_ETR_TAL-B:VP16 | pCMV_PIR_TAL-A:VP16 | |
| TRE_CMV_TAL-A:KRAB | pCMV_ETR_TAL-B:KRAB | pSV40_PIR_TAL-B:KRAB | |
| TRE_CMV_PEST-CL1:TAL-A:KRAB | pCMV_ETR_TAL-A:VP16 | PIR_CMV_TAL-B:KRAB | |
| TRE_CMV_TAL-B:VP16 | pSV40_ETR_TAL-B:KRAB | PIR_CMV_PEST-CL1:TAL-B:KRAB | |
| TRE_CMV_PEST-CL1:TAL-B:VP16 | ETR_CMV_TAL-A:KRAB | TRE_CMV_TAL-A:VP16 | |
| ETR_CMV_PEST-CL1:TAL-A:KRAB | TRE_CMV_PEST-CL1:TAL-A:VP16 | ||
| ETR_CMV_TAL-B:VP16 | |||
| ETR_CMV_PEST-CL1:TAL-B:VP16 |
Rapamycin system
In the rapamycin system the gene of interest is under the control of a minimal promoter. The gene's transcription rate is regulated by two proteins that consist of a drug binding domain and either a DNA binding domain or an activation domain. When rapamycin is added both drug binding domains bind to it, consequently joining the activation domain with the DNA binding domain, resulting in a functional transcription factor, which activates the gene of interest. Instead of rapamycin a rapamycin analogue (rapalogue), which is a 1000-fold less imunosupressive than rapamycin, but activates the inducible system like rapamycin, is usually used as the inducer. (Pollock et al., 2002)
| Regulating vector | HetAct |
|---|---|
| DNA sequence | ZFHD |
| Constructs | ZFHD_pMIN_TAL-A:KRAB |
| ZFHD_pMIN_TAL-B:VP16 |
Induction of cells
- Transfect HEK293 or HEK293T cells with plasmids using JetPei transfection reagent (Polyplus transfection), following the manufacturers protocol (see cell culturing for details).
- Two hours post transfection change media and stimulate the cells by adding dilutions of appropriate inductors to the medium in a 1:10 (v:v).
| Inductor | Stock solution (solvent) | Dilution (solvent) | Concentration in cell medium (% solvent) |
|---|---|---|---|
| Rapalogue (AP21967) | 1 mM (100% ethanol) | 10 µM (1% ethanol) | 1 µM (0,1% ethanol) |
| Doxycyclin | 1 g/L (MQ) | 10 mg/L (MQ) | 1 mg/L (MQ) |
| Pristinamycin | 50 g/L (100% DMSO) | 20 mg/L (1% DMSO) | 2 mg/L (0,1% DMSO) |
| Erythromycin | 50 g/L (100% ethanol) | 20 mg/L (1% ethanol) | 2 mg/L (0,1% ethanol) |
Effectors
Biological assay-anakinra
- HEK293T cells, seeded in 6-well plate, were transfected with anakinra downstream of constitutive promoter.
- Transfected cells were incubated for 48 h.
- To detect anakinra's effect on NF-κB signalling pathway, other HEK293T cells were transfected with plasmid coding for Renilla luciferase and plasmid reporter with NF-κB-inducible firefly luciferase expression. HEK293T cells express IL-1R, so additional transfection with a receptor gene was notneeded.
- After 24 h, the medium was removed from cells transfected with reporter plasmids and 90 μL of anakinra-producing cells' supernatant was added to these wells.
- After 24 h of stimulation, cells were lysed and NF-κB activation was assessed using dual luciferase assay.
Biological assay-IFN-alpha
- HEK293T cells transfected with eithera plasmid encoding IFN-alpha under the control of a constitutive promoter or an empty vector, and HEK293T cells transfected with the reporter vector were co-cultivated .
- Additionally, we performed a co-transfection experiment, where HEK293T cells were transfected with both the reporter and the IFN-alpha encoding plasmids.
- Day after transcfection cells were cultivated into 96-well plate at density 5x10⁴ cells per well.
- After 24 hours of incubation, dual luciferase reporter assay was performed.
ELISA for IFN-alpha
- HEK293T cells where plated on 6 well plates and transfected with a plasmid coding for human IFN-alpha under the control of a constitutive promoter or a control plasmid (pcDNA3).
- Supernatants were collected after 16h and serial dilutions were measured for IFN-alpha levels by Human IFN-alpha Instant Elisa (eBioscience).
Plate reader-fluorescence(The Switch)
- HEK293T cells were seeded in black 96-well plates and transfected with plasmids encoding the switch. Plasmids and amounts used for transfection are listed in Figure legends.
- Two hours after transfection, media was changed and cells were stimulated with inducers. Inducers and their concentration are described in Figure legends.
- Media supplemented with inducer or without inducer were changed after two or three days of cultivation.
- After a maximum of 6 days after transfection, cells were lysed with 25 µL of 1x Passive lysis buffer (Promega ) per well.
- Fluorescence was measured using an automated plate reader.
Plate reader-luminescence (The Switch)
- HEK293T cells were seeded in white 96-well plates and transfected with plasmids encoding the switch. Plasmids and amounts used for transfection are listed in Figure legends.
- Two hours after transfection, media was changed and cells were stimulated with inducers. Inducers and their concentration are described in Figure legends.
- Media supplemented with inducer or without inducer were changed after two to three days of cultivation.
- After a maximum of 6 days after transfection, cells were lysed with 25 µL of 1x Passive lysis buffer (Promega).
- Luminescence of expressed reporter firefly luciferase was measured with Orion (Berthold Technologies) using Luciferase buffer with luciferin as a substrate. For normalization Renilla luciferase activity was used. The Renilla luciferase was measured using Renilla buffer supplemented with coelenterazine.
Plate reader-absorbance (The Switch)
- HEK293T cells were seeded in white 24-well plates and transfected with plasmids encoding the positive feedback loop switch and 10x[TALB + TALC] operator_CMV promoter_fLuciferase reporter plasmid and 10x[TALA + TALC]operator_CMV promoter_SEAP plasmid. Plasmids and amounts used for transfection are listed in Figure legends.
- Media supplemented with inducer or without inducer were changed after two days of cultivation.
- Two and seven days after transfection the growth medium was collected and SEAP QUANTIBlue substrate was added. After 15 minutes incubation at 37°C the absorbance was measured at 630 nm.
Microscopy
For spatial and temporal imaging of samples a Leica TCS SP5 laser scanning microscope mounted on a Leica DMI 6000 CS inverted microscope (Leica Microsystems, Germany) with a 10× and 20× dry objective and an HCX plan apo 63× oil (NA 1.4) oil immersion objective was used. For image analysis we used ImageJ (Image Processing and Analysis in Java) software (http://rsbweb.nih.gov/ij/) measuring the mean grey values of each cell containing the promoter of interest.
Microscopy-cell viability with Hoechst and SytoxGreen514 (Safety mechanisms)
Hoechst dye is a membrane permeable dye and stains all cells in a culture. On the other hand a SytoxGreen514 dye is a membrane impermeable dye staining only dead cells. Both dyes, blue fluorescent Hoechst and green fluorescent SytoxGreen514, bind to nucleic acids causing emission of fluorescent light.
- HEK293 cells were seeded in an 8-well microscope chamber and transfected with 200 ng CMV-mGMK_TK30 (pPCMV_mGMK:TK30).
- Ganciclovir (GCV) in concentrations 0, 10 and 100 μg/mL was added to the cell cultures.
- After 5 days of cultivation, a Hoechst dye (0.4 μg/mL) and a SytoxGreen514 dye (1 μM) were used to stain cells and discriminate between live and dead cells.
- Cells were incubated for approximately 10 minutes in the dark at 37 °C before imaging.
- A 405-nm diode laser was used to excite Hoechst and a 514-nm line of 25 mW multi ion argon laser was used to excite SytoxGreen514. Successive images excited at 405 nm and 514 nm were captured. Fluorescence emission was detected at 450-500 nm and 520-560 nm for Hoechst and SytoxGreen respectively.
Microscopy-cell growth (Safety mechanisms)
- HEK293 cells were seeded in an 8-well microscope chamber and transfected with 100 ng mGMK:TK30 (pPCMV_mGMK:TK30) and/or 20 ng GFP (pPCMV-GFP) (for transfection control).
- Ganciclovir (GCV) in concentrations 0, 10 and 100 μg/mL was added to the cell cultures.
- After 5 days of cultivation, a cell cultures were imaged.
- A 514-nm line of 25 mW multi ion argon laser was used to excite GFP reporter protein. Fluorescence emission was detected at 520-560 nm for GFP. Bright field images were used to visualize the number of cells.
Microscopy-cell count (Safety mechanisms)
- HEK293 cells were seeded in 12-well plates and transfected with different amounts of mGMK:TK30 (pPCMV_mGMK:TK30) as indicated in Figure legend.
- Cell cultures were treated with ganciclovir (GCV) in concentrations as indicated in the Figure legend.
- After incubation the cells were resuspended by pipetting.
- Cells suspensions were then mixed with trypan blue.
- Viable cell number was determined by counting the cells under a light microscope using a Bürker-Türk counting chamber.
Microscopy-detection of reporter proteins (The Switch)
Fluorescent proteins were used as reporters in "The switch experiments". The fluorescent proteins used were blue (tagBFP), yellow (mCitrine), orange (mCherry) and red (mNeptun) fluorescent proteins. mCherry was used as transfection control while the others were used as reporters of "the switch".
- HEK293T cells were seeded in an 8-well microscope chamber or 12-well plate and transfected with plasmids encoding the switch. Plasmids and amounts used for transfection are listed in Figure legends.
- Two hours after transfection, media was changed and cells were stimulated with inducers. Inducers and their concentration are described in Figure legends.
- Media supplemented with inducer or without inducer were changed after two or three days of cultivation.
- Images of cells expressing reporters were taken two days after transfection and then each day for 5 days.
- A 405-nm diode laser was used to excite tagBFP, a 514-nm line of 25 mW multi-ion argon laser was used for mCitirne, a 543-nm HeNe laser was used for mCherry and a 633-nm HeNe laser was used to excite mNeptune. Successive images excited at 405, 514, 543 and 633 nm were captured. All intensities of laser and photomultipliers were kept unchanged during one set of experiments to enable comparison of images. Fluorescence emission was detected at 450-500 nm, 520-560 nm, 560-600 nm and 640-700 nm for tagBFP, mCitrine, mCherry and mNeptune, SytoxGreen respectively.
Microscopy-alginate degradation (Microencapsulation)
To observe the degradation of alginate beads, 2000 kDa FITC-dexstran (Sigma) was added to 200 µL of culture medium containing alginate beads with immobilized HEK 293T cells. Because FITC-dexstran cannot penetrate the alginate beads, we can easily observe bead degradation upon addition of alginate lyase from Sphingobacterium multivorum (Sigma).
- Alginate beads suspended in culture medium were seeded in an 8-well microscope chamber (200 µL).
- 20 µL of 1 mg/mL FITC-dextran were added into well.
- After the dye was evenly distributed throughout the suspension, 8 µL of Sphingobacterium multivorum alginate lyase were added.
- The microscope was set to capture images every 20 seconds.
- Screenshots were collected for at least 15 minutes.
- A 488-nm line of 25 mW multi-ion argon laser was used for FITC. Fluorescence emission was detected at 520-560 nm. At the same time a bright field image was taken.
Microscopy-secreted alginate lyase enzymatic activity (Microencapsulation)
- HEK293T cells were seeded 1×10⁶ on 10 cm cell culture dish and grown in DMEM medium supplemented with 10 % FBS.
- After reaching 50 – 70 % confluency, cells were transfected with 15 μg of DNA per culture dish with jetPEI transfection reagent (Polyplus Transfection).
- Protein production lasted for 72 hours.
- Cell supernatants were collected and concentrated 50-times using Sartorius Vivaspin 6 concentrators (5 kDa MWCO PES).
- Alginate beads were produced with Büchi BIOTECH Encapsulator (see Microencapsulation: Encapsulation procedure 1.-6.).
- Beads were incubated with concentrated supernatants for 72 hours in an 8-well microscope chamber.
- 20 µL of 1 mg/mL FITC-dextran were added into wells.
- A 488-nm line of 25 mW multi-ion argon laser was used for FITC detection. Fluorescence emission was detected at 520-560 nm.
- Beads' diameters were assessed using Leica LAS Image Analysis software.
Microscopy-encapsulated cell viability (Microencapsulation)
To observe encapsulated cells' viability, HEK 293T cells were stained with Hoechst and 7-aminoactinomycin D (7-AAD) viability stains. Hoechst stains both live and dead cells, while 7-AAD stains dead cells only.
- Encapsulated cells were grown in DMEM culture medium supplemented with 10% FBS.
- 200 µL of the microcapsule suspension was collected and alginate-PLL capsules were seeded into an 8-well microscope chamber.
- 5 µL of 7-AAD and 1 µL of Hoechst stain were added to one well.
- Encapsulated cells were protected from direct light and stained for 30 minutes at 37 °C.
- A 405-nm diode laser was used to excite Hoechst and a 543-nm line of HeNe laser was used to excite 7-AAD.
- Fluorescence emission was detected at 450-500 nm and 600-700 nm for Hoechst and 7-AAD respectively.
Flow cytometry
Flow cytometry is a laser based technology employed in cell counting and biomarker detection. It allows simultaneous multiparametric analysis of the physical as well as biochemical and biological characteristics of particles. We used a CyFlow Space (Partec) flow cytometer equipped with three lasers (405, 488 and 633 nm). The CyFlow detects forward scatter and side scatter signals and up to 6 colors of fluorescence.
Flow cytometry - the annexin assay (Safety mechanisms)
To determine the percentage of cells undergoing apoptosis as a result of herpes simplex virus thymidine kinase (HSV-TK) (pCMV-mGMK_TK30) transfection and ganciclovir treatment we labeled cells with Annexin V conjugated with phycoerythrin (PE). Annexin V is a Ca2+ dependent phospholipid-binding protein that has a high affinity for the phospholipid phosphatidylserine and therefore binds to apoptotic cells with phosphatidylserine exposed on their surface.
- HEK293 cells were seeded in 12-well plates.
- Cells were transfected with pCMV-mGMK_TK30 and treated with ganciclovir. Concentrations of ganciclovir and plasmids are indicated in Figure legends.
- After incubation the cells were washed with PBS buffer and resuspended by pipetting.
- Cells were pelleted with centrifugation at 1200 rpm.
- The cell pellet was washed in 1x Annexin Binding Buffer (10 mM HEPES, 140 mM NaCl, and 2.5 mM CaCl2, pH 7.4).
- The pellet was then resuspended in 1x Annexin Binding Buffer and PE-Annexin V (5 µl per 100 μl cell suspension) was added.
- Samples were incubated for 20 minutes in the dark at room temperature and then immediately analyzed with a flow cytometer.
- Along with site and forward scatter, the signal in the FL2 channel (540-580 nm) was also recorded.
Flow cytometry - the propidium iodide assay (Safety mechanisms)
To determine the percentage of dead cells due to cytotoxic activity of natural killer cells against HEK293T cells expressing MICA protein, cells were stained with propidium iodide dye, which intercalates into DNA and stains only dead cells, because it is a membrane impermeant fluorescent molecule.
- HEK293T cells seeded in 12-well plates were transfected with plasmids expressing MICA (pPCMV-MICA_pcDNA3).
- Two days after transfection with CMV-MICA_pcDNA3, cells were resuspended in PBS at final concentration 1x10⁶ cells/mL, stained with CFSE (0,6μM) and incubated for 10 minutes at 37°C. Staining was quenched by the addition of 5 volumes of ice-cold culture media (RPMI+ 20% FBS) to the cells. After 5 minutes incubation on ice, cells were pelleted by centrifugation and then washed by resuspending the pellet in fresh media (RPMI+ 20% FBS) a further two times for a total of three washes. CFSE was used to discriminate between HEK293T and NK-92 cells or between NK target cells K562, which were used as a positive control, and NK-92 cells.
- HEK293T cells or K562 cells were mixed with NK-92 cells in different ratios (1:1, 1:5, 1:10) and incubated for 4 hours at 37 °C in culture medium consisting of RPMI, 20% FBS and hIL-2 (100 U/ml).
- After incubation of HEK293T or K562 cells with NK-92 cells, cells were treated with propidium iodide.
- Along with site and forward scatter the signal in the FL1 channel (530-580 nm) was also recorded.
Flow cytometry - detection of reporter proteins (The Switch)
Reporters such as fluorescent proteins were used to detect the expression of effectors in "The switch experiments". As reporters we used blue (tagBFP) and yellow (mCitrine) fluorescent proteins.
- HEK293T cells were seeded in a 12 or 24-well plate and transfected with plasmids encoding the switch.
- Two hours after transfection, media was changed and cells were stimulated with inducers.
- Medium with inducer or without the inducer was changed after two days of cultivation.
- Cells were collected at different time points (2 days after induction and then 3 days after the second media change).
- Cells were washed and resuspended in PBS buffer.
- A 405 nm diode laser was used to excite tagBFP and a 488-nm diode laser was used for mCitirne.
- Along with site and forward scatter signals in the FL1 (540-580 nm) channel (mCitrine) and the FL5 (450-480 nm) channel (tagBFP) were also recorded.
Microencapsulation
Cell preparation for encapsulation
- HEK 293T cells were seeded 5x10⁵ per 10 cm cell culture dish (3 per encapsulation) and grown in DMEM medium supplemented with 10 % FBS.
- After reaching 50 – 70 % confluency, cells were transfected with 15 μg of DNA per culture dish with jetPEI transfection reagent (Polyplus Transfection).
- The medium was removed the next day.. Transfected cells were detached using 3 mL of trypsin solution and centrifuged after the addition of fresh medium to inactivate the trypsin.
- Supernatant was removed and cells were resuspended in 15 mL DMEM with 10% FBS.
- Cells were counted using Countess automated cell counter (Invitrogen).
- HEK 293T cells were again centrifuged and supernatant was removed.
- Cells were resuspended in 2 mL of pre-warmed MOPS buffer.
- 10 mL of pre-warmed alginate solution (1,5%) was added to cell suspension.
Encapsulation
- The encapsulator was equipped with a 200-µm nozzle.
- The reactor vessel was filled with 225 mL 100 mM CaCl2.
- Cell-alginate mixture was transferred to a 20 mL syringe with a Luer lock.
- The syringe was connected to the bead producing unit (BPU).
- Microcapsules were produced at a flow rate of 12-14 units, vibration frequency 1030-1100 Hz and voltage for bead dispersion 900-1300 V.
- Polymerization lasted for 10 minutes.
- The polymerization solution was drained and 75 mL of 0,05% poly-L-lysine (PLL) solution was added.
- Beads were incubated in PLL solution for 10 minutes.
- The PLL solution was removed and beads were washed twice (for 1 and for 5 minutes) with 150 mL of MOPS buffer.
- 100 mL of 0,03% alginate was added and beads were incubated for 10 minutes.
- Alginate solution was drained and beads were washed once with 150 mL of MOPS buffer for 1 minute.
- 150 mL of depolymerization solution was added for 10 minutes.
- Depolymerization solution was removed and capsules were resuspended in 150 mL MOPS and collected in a bead collection flask.
- MOPS was removed and microcapsules were transferred to T-75 with 10 mL DMEM, 10% FBS media supplemented with penicillin and streptomycin.
Buffers and solutions
10 mM MOPS buffer (pH = 7,2)
MOPS buffer with NaCl (pH = 7,2): 10 mM MOPS, 0,85% NaCl
Polymerisation solution (pH = 7,2): 10 mM MOPS, 100 mM CaCl2
Depolymerisation solution (pH = 7,2): 10 mM MOPS, 50 mM Na3-citrate, 0,45% NaCl
0,05% poly-L-lysine (15-30 kDa) in MOPS buffer (pH = 7,3)
0,03% alginate in MOPS buffer (pH = 7,2)
1,5% alginate (low viscosity) in MOPS buffer (pH = 7,2)
Protein detection
SDS-PAGE
- Samples were loaded on a 12% acrylamide gel and ran at a constant voltage (200 V) for 1 h.
- Proteins were then blotted on a nitrocellulose membrane at a constant current (350 mA) for 1 h.
- The membrane was washed with MQ and PBS and blocked for 1,5 h by incubation in I-Block blocking reagent at room temperature.
Immunodetection
- All proteins to be detected had a Myc tag at the C-terminus.
- The membrane was incubated with primary antibodies (rabbit anti-Myc diluted 1:500) overnight at 4 °C and 150 rpm. Membrane was washed.
- Washing in wash buffer three times for 5 minutes each.
- Membrane was incubated with secondary antibodies (anti-rabbit secondary antibodies, conjugated with HRP, diluted 1:3000) for 45 minutes at room temperature and 150 rpm.
- HRP activity was detected by addition of SuperSignal West Femto or Pico Substrate (Thermo Scientific). Images were captured with Syngene G:Box chemiluminescent imaging system.
Buffers and solutions
Wash buffer: 1x PBS, 0,01% (v/v) Tween 20
References
Clackson, T. (2000) Regulated gene expression systems. Gene ther. 7, 120–125.
Deuschle, U., Meyer, W.K. and Thiesen, R. (1995) Tetracycline-reversible silencing of eukaryotic promoters. Mol. Cell. Biol. 15, 1907–1914.
Kramer, B.P., Fischer, C. and Fussenegger, M. (2004) BioLogic gates enable logical transcription control in mammalian cells. Biotech. Bioeng. 87, 478–484.
Pollock, R. and Clackson, T. (2002) Dimerizer-regulated gene expression. Curr. Opin. Biotech. 13, 459–467.
Gibson, D.G., Young, L., Chuang, R., Venter J.C., Hutchison III, C. A. and Smith, H.O. (2009) Enzymatic assembly of DNA molecules up to several hundred kilobases. Nature methods. 6, 343–345.
Next: Lablog >>