 "
"
Team:Slovenia/ModelingQuantitativeModel
From 2012.igem.org

- Home
- Idea
- The switch
- Overview
- Designed TAL regulators
- Mutual repressor switch
Positive feedback loop switch 
Controls
- Safety mechanisms
- Overview
- Escape tag
- Termination
Microcapsule degradation
- Implementation
- Modeling
- Overview
Pharmacokinetics - Modeling methods
- Mutual repressor switch
- Positive feedback loop switch
Experimental model Interactive simulations
- Parts
- Notebook
- Experimental methods
Lablog - Lab safety
- Society
- Team
- Team members
- Attributions
Collaborations - Gallery
- Sponsors
Experimental model
|
Question: Are we able to somehow take advantage of the experimental measurements obtained from the wet lab? Does that allow us to predict the optimal input ratios of plasmids inserted? Answer: Measurements were exploited in their full potential as we have developed a brand new modeling approach. As it turned out, it well describes the real behavior of the switch. The results predicted bistable behavior for a range of input ratios. The optimal choice resulted to be the p[B]_PMIN_TAL:KRAB (repressors) plasmids being in around three times greater quantity than p[B]_PMIN_TAL:VP16 (activators). |
To get a better idea for the functioning of the Experimental model, we implemented it as a web application. Click here to show the application.
Idea
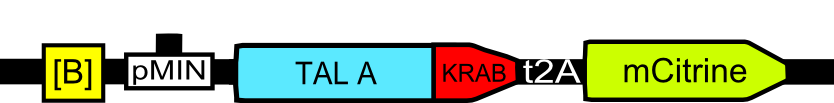
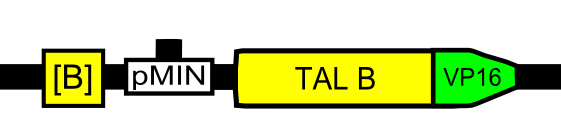
As we discovered throughout the project, the switch design is very sensible to the masses of the different plasmids (parts) used in the experiment. We thought, why not use the data we obtained for individual constructs and try to predict the switch behavior as they are combined into a single system? Thus, the data obtained from the wet lab was used to characterize each of the plasmid constructs in the positive feedback loop switch. The characterization was made in terms of how their products regulate the transcription of the target genes. That is the way how we connect the experimental work to the theory, as shown in Figure 1.
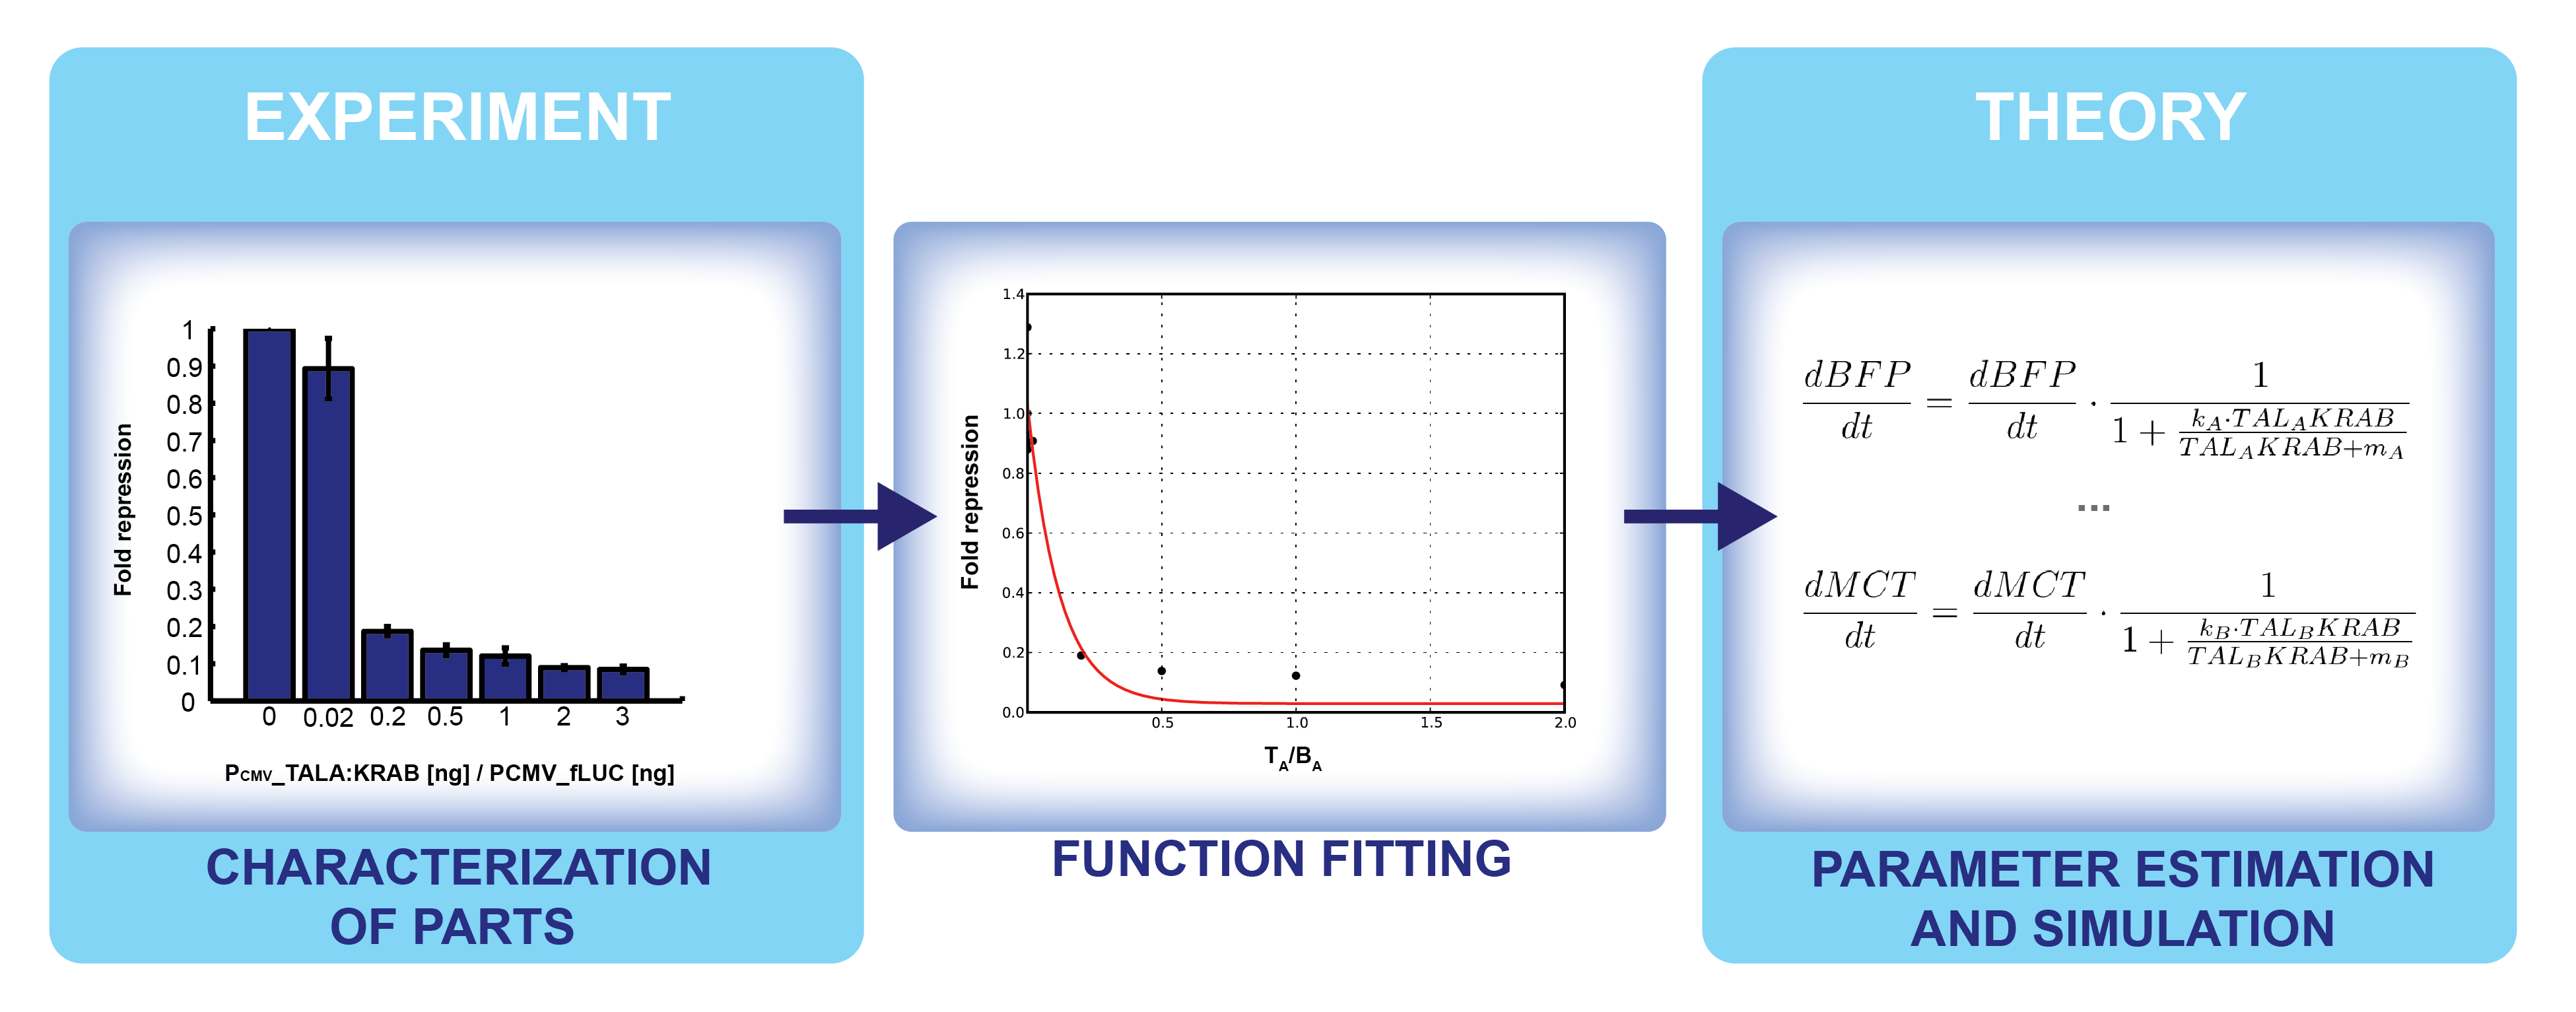
Figure 1. Steps in connecting the experimental results to theoretical modeling.
Model derivation
Ordinary differential equations (ODE) model was used as a module to build around. We made use of the two basic relations for transcriptional regulation. The activator and repressor function respectively, defined in (Alon, 2006), modify the basal transcription rate as follows:
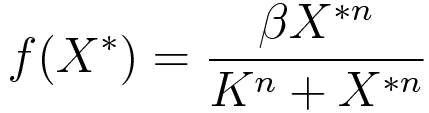 |
(1) | 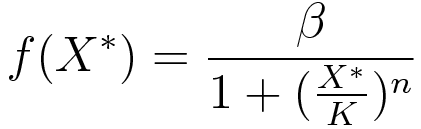 |
(2) |
where β is the basal transcription rate, X* is the quantity of active protein, K is the activator/repressor coefficient and n is the Hill coefficient (which we neglect in this model to show that the switch can work without cooperativity).
Since precisely defining transcription rates was not the primary goal of our project, their absolute values are not of central importance in the model. Rather, we focus on the relative changes in transcription levels, caused by activators and repressors. Furthermore, concentration levels of reporters will also be presented relative to each other. This way, we avoid the use of any units we did not measure.
Promoters
As we use two different kinds of promoters, PCMV and PMIN, to account for the difference in basal transcription rates. Experiments have shown that relative luciferase units under PCMV promoter are 1000-fold greater than under PMIN (data not shown). Hence, PCMV is assumed to have a 1000 times greater basal transcription rate than PMIN.Transcriptional regulators
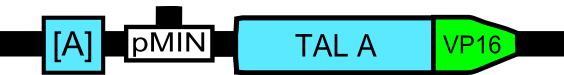
Activators
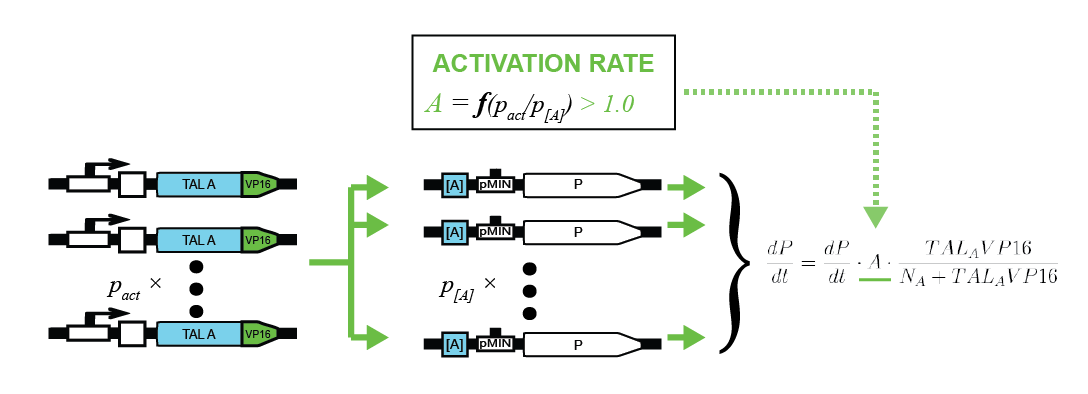
To characterize activators, pPCMV_TALA:VP16 and p[A]_PMIN_fLuc plasmids were tested. Various ratios of input masses produced different levels of luciferase activity. Following equation (1), activators increase the transcription rate up to some maximum factor of fold induction. The former is derived by comparing the resulting luciferase activity with that of the inactivated p[A]_PMIN_fLuc. Gathering data for various input ratios (Figure 2), we fitted it to an analytical function (Figure 3), enabling us to predict the fold induction (A) for arbitrary input ratios of DNA for the two plasmids.
Intuitively, more activator plasmids increase the maximum fold induction. On the other hand, more target plasmids decrease it. Relatively speaking, activator proteins thus have more plasmids to target. That leads to fold activation ratio being smaller from the global point of view.
In an analogue manner TAL-B:VP16 constructs were characterized.
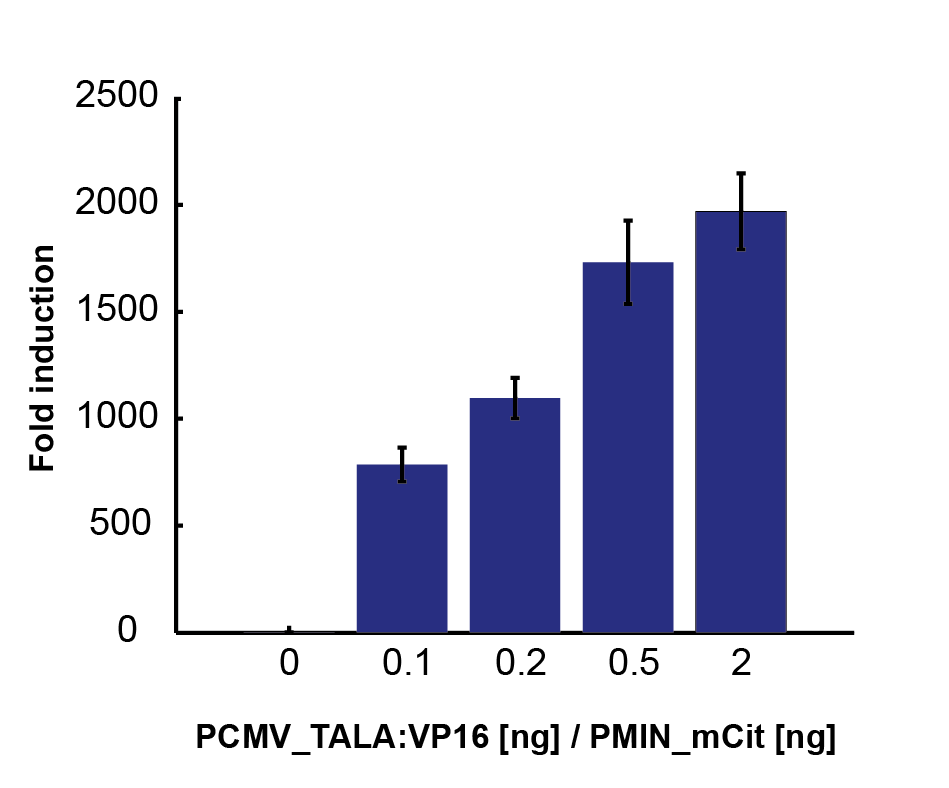
Figure 2. Fold induction rates, derived from relative luciferase activity for various ratios of pPCMV_TALA:VP16 (activator) and p[A]_PMIN_fLuc (target) plasmids. |
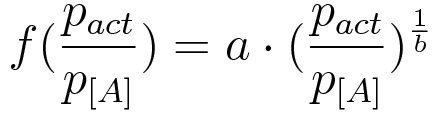 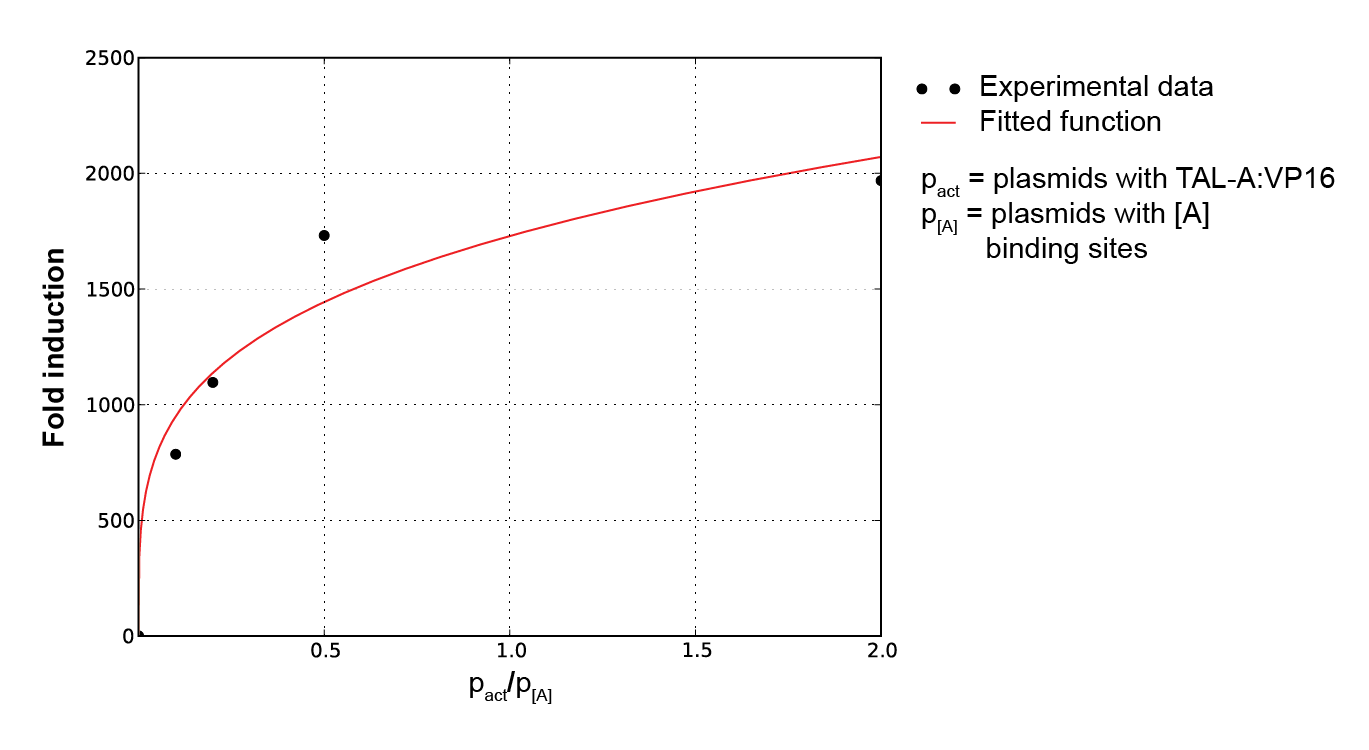
Figure 3. Plot of fold induction function for a continuous range of activator and reporter. plasmid ratios, where a and b are parameters subject to least square error fitting. |
Repressors
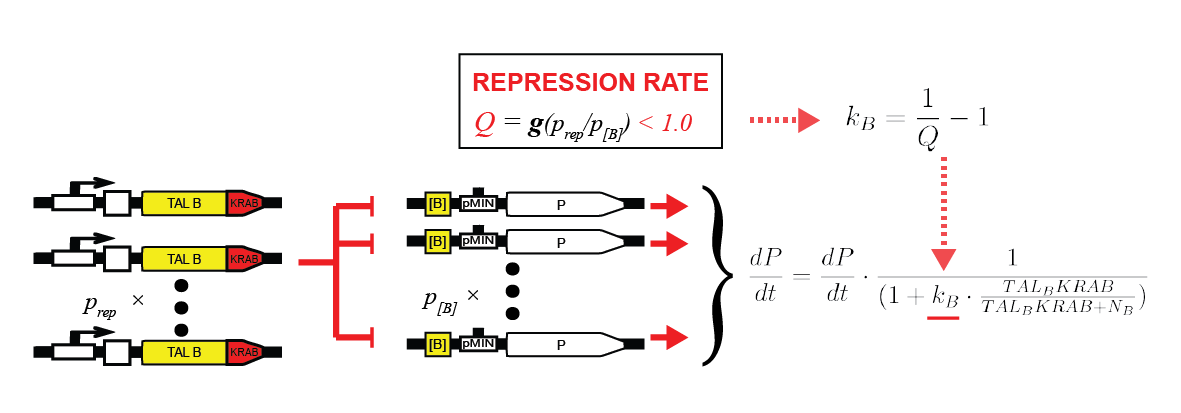
To characterize repressors, pPCMV_TALA:KRAB and p[A]_PCMV_fLuc plasmids were tested. Various ratios of input masses produced different levels of luciferase activity. Following equation (1), repressors decrease the basal transcription rate down to some minimum factor of fold repression. The former is derived by comparing the luciferase activity with that of the unrepressed p[A]_PCMV_fLuc, resulting in percentage of remaining transcription intensity. Gathering data for various input ratios (Figure 4), we fitted it to an analytical function (Figure 5). It enables us to predict the fold repression (Q) for arbitrary input rations of DNA.
Intuitively, more repressor plasmids increase the maximum fold induction. On the other hand, more target plasmids decrease it. Relatively speaking, repressor proteins thus have more plasmids to target. That leads to fold repression ratio being smaller from the global point of view.
In an analogue manner TAL-B:KRAB constructs were characterized.
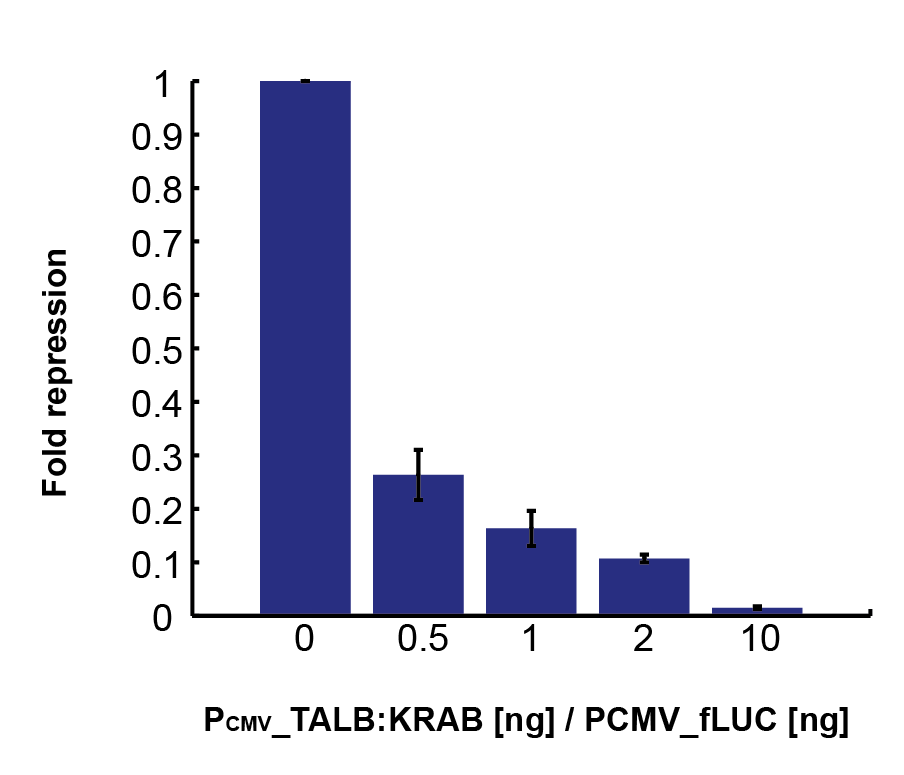
Figure 4. Fold repression rates, derived from relative luciferase activity for various ratios of pPCMV_TALA:KRAB (repressor) and p[A]_PCMV_fLuc (target) plasmids. |
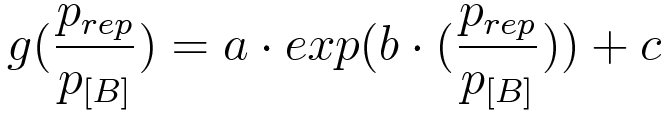 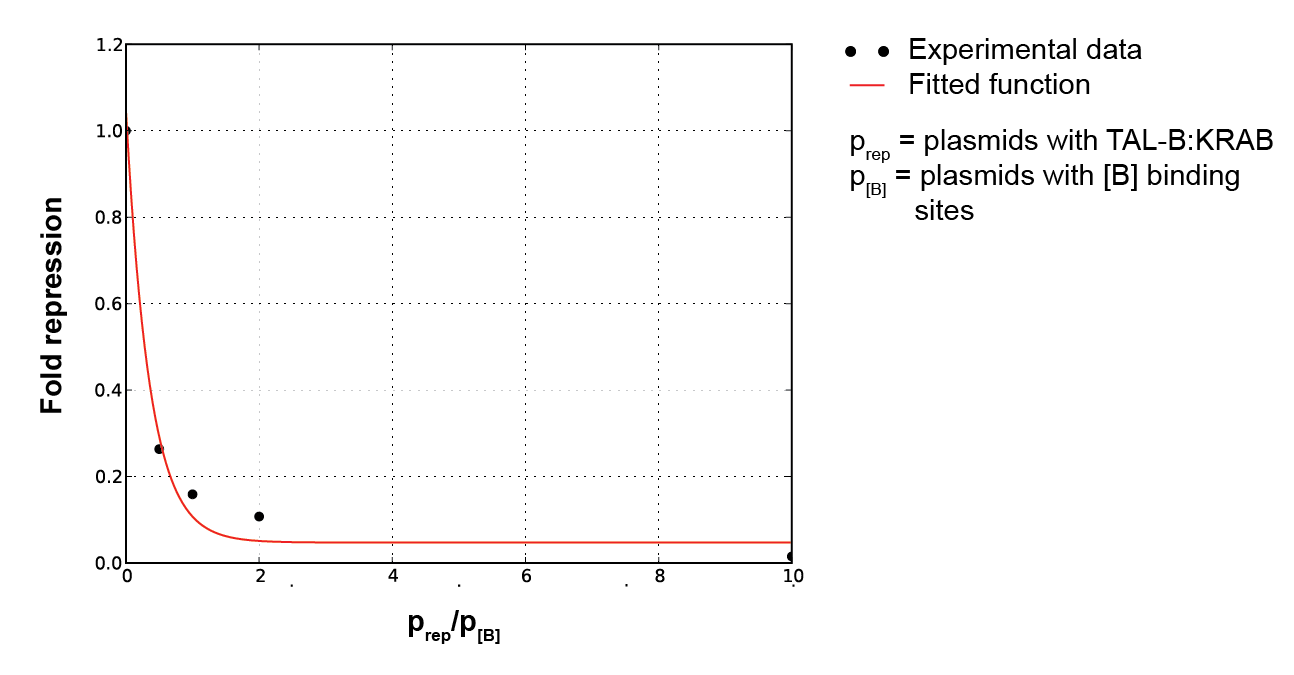
Figure 5. Plot of fold induction function for a continuous range of repressor and reporter plasmid ratios, where a, b and c are parameters subject to least square error fitting. |
Inducible system
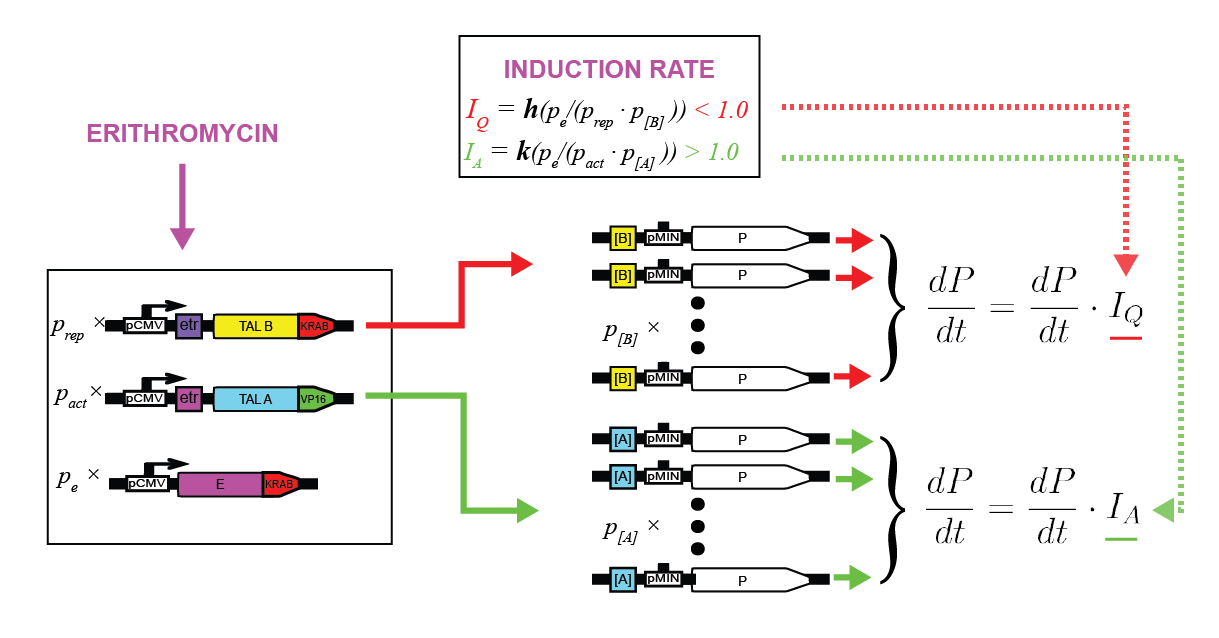
To characterize the erythromycin repressor induction system we measured relative luciferase activity for various ratios of pPCMV_E:KRAB (inducible protein), pPCMV_[ETR]_TALA:KRAB (repressor) and p[A]_PCMV_fLuc (target) plasmids (Figure 6).
As E:KRAB gets stimulated by erythromycin, it unbinds from the [etr] binding site, allowing the production of TALA:KRAB, which in turn represses the transcription of fLuc. By varying the ratios of the three input plasmids, we can observe the resulting difference in luciferase activity. That directly determines the fold repression of the inducible system as a whole (Figure 7).
As inducible protein plasmids increase, the luciferase activity increases as well. The increasing masses of repressor and target plasmids both decrease the luciferase activity and consequently decrease the fold repression rate.
In an analogue manner erithromycin activator, pristinamycin repressor and pristinamycin activator induction systems were characterized.
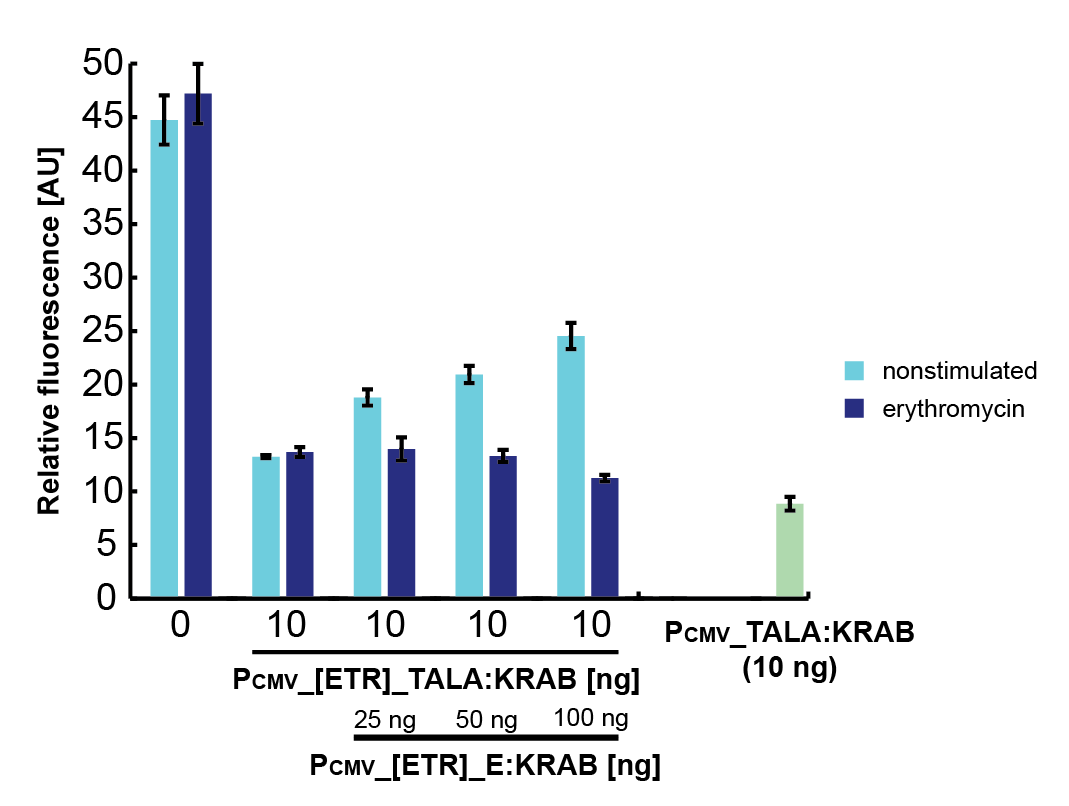
Figure 6. Fold repression rates, derived from relative luciferase activity for various ratios of pPCMV_E:KRAB (inducible protein), pPCMV_[ETR]_TALA:KRAB (repressor) and p[A]_PCMV_fLuc (target) plasmids. |
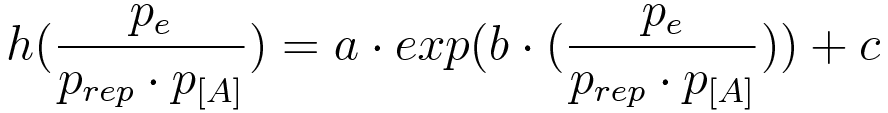 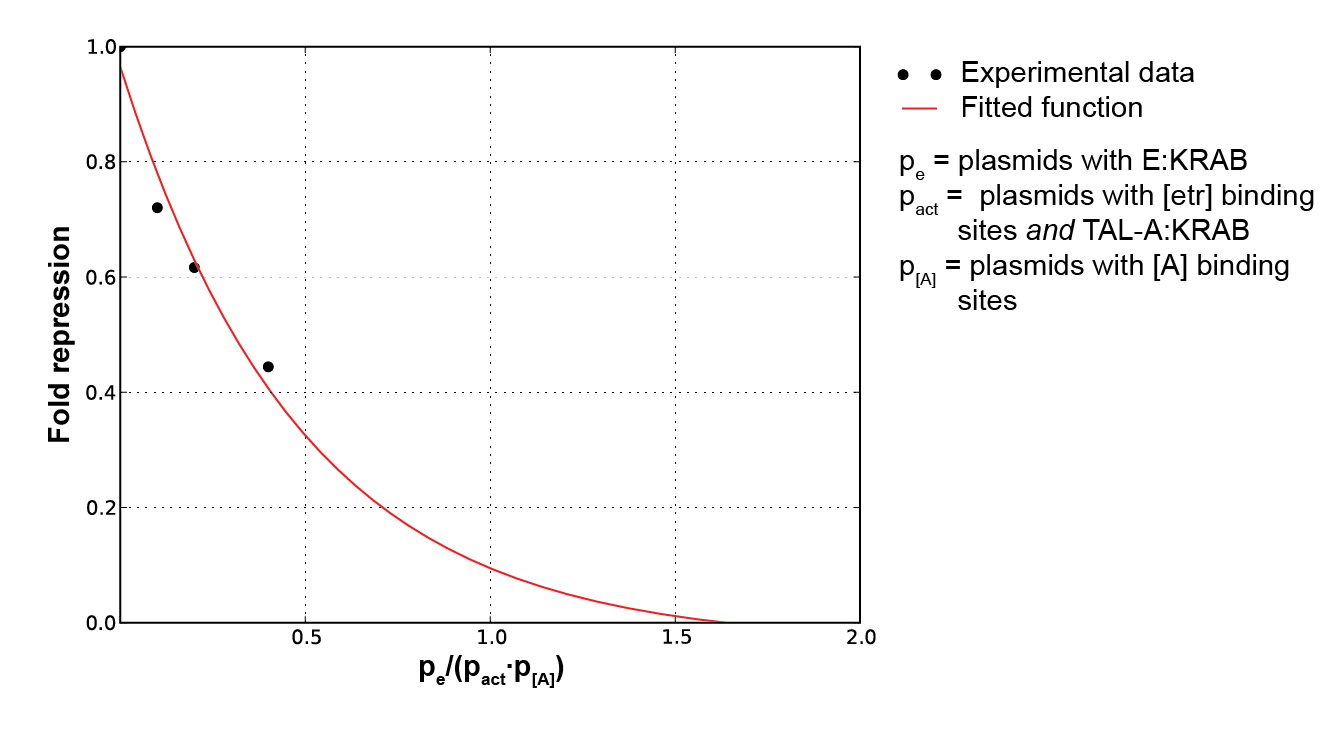
Figure 7. Plot of fold induction function for a continuous range of inducible protein, inducible system and target plasmid ratios, where a, b and c are parameters subject to least square error fitting |
Noise
Due to the noise in experimental measurements, we can directly apply it in the model as well. When determining fold repression ratios, standard deviations of up to 15 % were observed.
Results
|
|
|


The main goal of this particular model was to help determine the input ratios for plasmids that make up the switch system. The first confirmation was that if the masses of all plasmids will be equal, the switch will not be able to exhibit bistable behavior.
We partition the whole system into levels, with the Switch being the top level
and the Pristinamycin/Erithromycin inducible proteins the bottom level. It is obvious that
a plasmid on a given level influences another level only in the direction bottom -> top,
so as we go downwards, the masses shall increase to have more influence on the targeted
upper level. Hence the relation:
Next, the ratio between repressor and activator constructs was examined. To preserve symmetry, we assume:
All the following ratios will be given in the form p0 : p1 (repressor:activator). Testing began at the 1:1 ratio, and we gradually increased both the repressor and activator to observe the qualitative behavioral change. The Switch exhibited bistable behavior for all ratios between 10:1 until 1:5, as can be seen in Scroll Box 1.

|


|
The whole range in which the simulation reports bistable behaviour is thus:
Taking the median of the above range, we conclude that the optimal ratio of input masses for wet lab experiments is at around three to one in favour of the repressor plasmids.
Source code
All source code for the model and simulations described above can be found here;References
Alon, U. (2007) An introduction to systems biology: design principles of biological circuits. Chapman & Hall/CRC.
Batard, P., and Wurm, F. (2001) Transfer of high copy number plasmid into mammalian cells by calcium phosphate transfection. Gene 270, 61-68.
Chatterjee, A., Kaznessis, Y., and Hu, W. (2006) Tweaking biological switches through a better understanding of bistability behavior. Current opinion in biotechnology 19, 475-81.
Gardner, T., Cantor, C., and Collins, J. (2000) Construction of a genetic toggle switch in Escherichia coli. Nature 403, 339-42.
Batard, P., and Wurm, F. (2001) Transfer of high copy number plasmid into mammalian cells by calcium phosphate transfection. Gene 270, 61-68.
Malphettes, L., and Fussenegger, M. (2006) Impact of RNA interference on gene networks. Metabolic engineering 8, 672-83.
Tigges, M., Marquez-Lago, T., Stelling, J., and Fussenegger, M. (2009) A tunable synthetic mammalian oscillator. Nature 457, 309-12.
Zakharova, A., Kurths, J., Vadivasova, T., and Koseska, A. (2011) Analysing dynamical behavior of cellular networks via stochastic bifurcations. PloS one 6, e19696.
Next: Interactive Simulations >>