 "
"
Team:Slovenia/ModelingPositiveFeedbackLoopSwitch
From 2012.igem.org

- Home
- Idea
- The switch
- Overview
- Designed TAL regulators
- Mutual repressor switch
Positive feedback loop switch 
Controls
- Safety mechanisms
- Overview
- Escape tag
- Termination
Microcapsule degradation
- Implementation
- Modeling
- Overview
Pharmacokinetics - Modeling methods
- Mutual repressor switch
- Positive feedback loop switch
Experimental model Interactive simulations
- Parts
- Notebook
- Experimental methods
Lablog - Lab safety
- Society
- Team
- Team members
- Attributions
Collaborations - Gallery
- Sponsors
Modeling - positive feedback loop switch
- Deterministic model
- Stochastic model
- C#Sim model
Deterministic model of the positive feedback loop switch
|
Research suggests that bistability is in theory possible without cooperativity (see Cooperativity). Deterministic analysis showed that the positive feedback switch - due to positive feedback loops and competitive binding of activators and repressors – was exhibiting bistability even at no or very low functional cooperativity (values equal or close to 1). The switch proved much more robust than the mutual repressor switch, exhibiting bistable behavior with high stable-state expression levels even when leaky TAL expression was high. As with the mutual repressor switch, increase in cooperativity further improved robustness. However, even at a relatively low cooperativity, the switch was robust enough to suggest that an experimental realization may be possible. Another advantage of the positive feedback loop switch over the mutual repressor switch, according to our deterministic model, was faster transition from one stable state to another after induction. Our experimental results showed bistable behavior of the switch, as predicted by the model. |
The model
A description of the positive feedback loop switch is available here.
For modeling purposes, the positive feedback loop switch can be represented as a set of constructs:

[A] is TAL-A:KRAB binding site, [B] is TAL-B:KRAB binding site, pir is PIP:KRAB binding site and etr is E:KRAB binding site. The presence of signal 1 causes PIP:KRAB to dissociate from promoter 3 (construct 3) binding site. The presence of signal 2 causes E:KRAB to dissociate from promoter 4 (construct 4) binding site.
Fractional occupancies of promoters are:
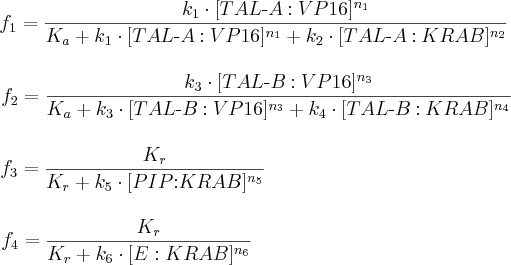
- f1, f2, f3 and f4 are probabilities of constructs’ promoters 1, 2, 3 and 4, respectively, being in an active state, resulting in gene expression;
- [TAL-A:KRAB], [TAL-B:KRAB], [TAL-A:VP16], [TAL-B:VP16], [PIP:KRAB] and [E:KRAB] are protein concentrations at a given time;
- k1, k2, k3, k4, k5 and k6 are association constants;
- n1, n2, n3, n4, n5 and n6 are exponents representing the degree of functional cooperativity;
- Kr is the amount of repressor required for 50% repression of constitutive promoter;
- Ka is the amount of activator required for 50% activation of minimal promoter.
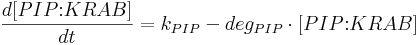
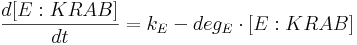
Protein production is described by a set of equations:


- [BFP], [mCitrine], [TAL-A:KRAB], [TAL-B:KRAB], [TAL-A:VP16], [TAL-B:VP16], [PIP:KRAB] and [HetAct] are protein concentrations;
- kBFP is BFP production rate from construct 1;
- kbBFP is leaky BFP production rate from construct 1;
- degBFP is BFP degradation rate;
- kcit is mCitrine production rate from construct 2;
- kbcit is leaky mCitrine production rate from construct 2;
- degcit is mCitrine degradation rate;
- k2AKR is TAL-A:KRAB production rate from construct 2;
- kb2AKR is leaky TAL-A:KRAB production rate from construct 2;
- k4AKR is TAL-A:KRAB production rate from construct 4;
- kb4AKR is leaky TAL-A:KRAB production rate from construct 4;
- degAKR is TAL-A:KRAB degradation rate;
- k1BKR is TAL-B:KRAB production rate from construct 1;
- kb1BKR Is leaky TAL-B:KRAB production rate from construct 1;
- k3BKR is TAL-B:KRAB production rate from construct 3;
- kb3BKR is leaky TAL-B:KRAB production rate from construct 3;
- degBKR is TAL-B:KRAB degradation rate;
- k1AVP is TAL-A:VP16 production rate from construct 1;
- kb1AVP is leaky TAL-A:VP16 production rate from construct 1;
- k3AVP is TAL-A:VP16 production rate from construct 3;
- kb3AVP is leaky TAL-A:VP16 production rate from construct 3;
- degAVP is TAL-A:VP16 degradation rate;
- k2BVP is TAL-B:VP16 production rate from construct 2;
- kb2BVP is leaky TAL-B:VP16 production rate from construct 2;
- k4BVP is TAL-B:VP16 production rate from construct 4;
- kb4BVP is leaky TAL-B:VP16 production rate from construct 4;
- degBVP is TAL-B:VP16 degradation rate;
- kPIP is PIP:KRAB production rate;
- degPIP is PIP:KRAB degradation rate;
- kE is E:KRAB production rate;
- degE is E:KRAB degradation rate;
See model derivation for details.
Simulation results
Similar simulation methods and assumptions as for the mutual repressor switch were used. Again, switching between states was achieved using two signals, each of which was used to induce a different stable state. The presence of signal 1 caused PIP:KRAB to dissociate from promoter 3 binding site. The presence of signal 2 caused E:KRAB to dissociate from promoter 4 binding site.
The ratio between the amount of activator required for 50% activation in case of a minimal promoter to the amount of repressor required for 50% repression in case of a constitutive promoter was set to 3.
Initial species' concentrations were 0 for all simulations.
Detailed parameter values for each simulation can be found in MATLAB files here.
Simulation set 1 - switching between stable states
The purpose of this simulation was to show that deterministic conditions exist where the switch would exhibit stable states. In order to compare this switch with the mutual repressor switch, the same parameter values were used: functional cooperativity of each transcription factor (TF) was equal to 2.5; product production-degradation ratio was equal to 100 (maximal possible expression level); zero leaky expression was assumed. Figure 1 shows the result of this simulation, indicating that stable states are possible. The state-switching scenario used was the same as the one in simulation 1 for mutual repressor switch:
- at time = 0, signal 1 was introduced (signal 1 = 1) to induce the first stable state, depicted by a high level of BFP;
- at time = 100, signal 1 was removed from the system (signal 1 = 0); high-BFP state persisted even after that, meaning a stable state was achieved;
- at time = 400, signal 2 was introduced (signal 2 = 1) to induce the second, high-mCitrine stable state;
- at time = 500, signal 2 was removed from the system (signal 2 = 0); high-mCitrine state persisted, meaning a stable state was achieved;
- at time = 800, signal 1 was re-introduced (signal 1 = 1) to show that a transition to high-BFP state ce be done from a high-mCitrine state;
- at time = 900, signal 1 was removed (signal 1 = 0); high-BFP stable state persisted.

|
| Figure 1. Positive feedback loop switch transitioning between stable states. Reporter (BFP, mCitrine) concentration is depicted as a function of time. Here, stable states were observed under ideal conditions with no leaky expression and TFs' cooperativity values equal to 2.5. |
Comparing the result to the mutual repressor switch under similar conditions, it is obvious that here, each steady state is reached sooner. For the mutual repression switch, the transition to a recently-induced state – i.e. rise in its expression level – only began after the level of the previous stable state was very low (close to zero). For the positive feedback loop switch, the rise coincided in time with the introduction of the signal that causes the transition. Hence, stable state was reached more quickly.
The mutual repressor switch exhibited no bistability for low cooperativity values, such as 1.15 (when leaky expression was present) or very low stable-state level bistability (when no or extremely little leaky expression was present). The positive feedback loop switch, however, exhibited bistability with high stable-state levels even at this cooperativity (1.15), as shown in Figure 2. This indicated that the positive feedback loop switch was much less dependent on cooperativity and could exhibit high expression-level bistability even at low cooperativity values. Bistability was exhibited with no noticeable change in reached levels even when PIP:KRAB and E:KRAB production rate was only half of TAL production rates.

|
| Figure 2. Positive feedback loop switch transitioning between stable states for TF cooperativity of 1.15. Bistability was preserved, with low cooperativity values only slightly reducing stable state expression levels. No cooperativity of PIP:KRAB and E:KRAB was required for the same result to be produced. |
Simulation set 2 - cooperativity and leaky expression
As with the mutual repressor switch, higher cooperativity values were found to increase the robustness of the switch. However, the robustness at a given cooperativity was much higher for the positive feedback loop switch. Figure 3 shows that even for a low cooperativity of 1.15, the switch was exhibiting bistability with high-expression levels in the presence of leaky expression of 0.1. Cooperativity of 1.3 was enough to preserve high-level (above 80%) bistability in the presence of leaky expression of 0.5. Increasing cooperativity to a still relatively low value of 1.85 dramatically increased switch’s capability to retain bistable behavior. In such case, as shown in Figure 4, even a leaky expression of 1.2 for each TAL did not prevent bistability from occuring, although the expression levels were reduced slightly.
This results suggested that positive feedback loop switch was far more robust and leaky expression-tolerant than the mutual repressor switch.

|
| Figure 3. Positive feedback loop switch state transitions. Cooperativity of 1.15 was enough to preserve high-level bistability in the presence of leaky expression of each TAL equal to 0.1. |

|
| Figure 4. Positive feedback loop switch state transitions. Cooperativity of 1.85 was enough for the positive feedback loop switch to preserve bistability even for leaky expression as high as 1.2, thus demonstrating superior robustness of the switch compared to the mutual repressor switch. |
Simulation set 3 - parameter evaluation
As for the mutual repressor switch, parameter evaluation was performed to search bistabiliy-exhibiting parameter space more thoroughly. The following state-switching scenario was used as a foundation:
- at time = 0, signal 1 was introduced to induce stable state 1 (high BFP);
- at time = 50, signal 1 was removed;
- at time = 100, signal 2 was introduced to induce stable state 2 (high mCitrine);
- at time = 150, signal 2 was removed.
Default TF cooperativity was 1.5. Product production-degradation ratio was 100. Default leaky expression of all TALs was 0.25, with zero leaky expression of reporters. Simulation results are shown in Figure 5 and show that bistability was achieved.

|
| Figure 5. Positive feedback loop switch exhibiting bistability. This simulation scenario was used in parameter evaluation tests. |
Again, we performed several simulations using this switching scenario, each time varying different parameters, producing 3D graphs that showed how each state was affected.
First, we tested the effect of TF cooperativity on each state. Figure 6 shows that, for the first stable state, maximal expression was observed for cooperativity of each TF for values only slightly greater than one. Figure 7 suggested similar conclusion for the second stable state.
 
|
| Figure 6. Stable state 1 levels dependence on cooperativity. Switching scenario from Figure 5 was used. |
 
|
| Figure 7. Stable state 2 levels dependence on ccoperativity. Switching scenario from figure 5 was used. |
Bistability was retained for relatively high values of leaky expression (compared to the mutual repressor switch), as shown in Figure 8 (depicting first state) and Figure 9 (depicting second state). Higher cooperativity further improved leaky expression tolerance, increasing expression levels.
 
|
| Figure 8. Stable state 1 levels at different TAL leaky expression rates. Each TAL gene was assigned a leaky expression rate shown. Switching scenario from Figure 5 was used. High tolerance to leaky expression was observed compared to the mutual repressor switch. |
 
|
| Figure 9. Stable state 2 levels at different TAL leaky expression rates. Each TAL gene was assigned a leaky expression rate shown. Switching scenario from figure 5 was used. High tolerance to leaky expression was observed compared to the mutual repressor switch. |
Simulation set 4
A concern in our wet-lab was that the positive feedback loops might be too strong, either rendering the switch incapable of switching from one stable state to another due to a large amount of activator produced, or negatively affecting bistability in some other way. Deterministic modeling revealed that in some cases, it is beneficial for bistability if the positive feedback loops (TAL activators) have lower production rates compared to other transcription factor production rates (Figure 10). One way to achieve this in experiments is to have lower amounts of constructs with positive feedback loops present compared to other constructs. The results also demonstrate that bistability is possible without any transcription factor cooperativity even in deterministic models when protein production to degradation rate ratio is high enough (e.g. 10000) and leaky transcription is low.

|
| Figure 10. The effect of different positive feedback loops production rates on bistability at constant production rates of other transcription factors, for which the production to degradation rate ratio was equal to 10000. No cooperativity was assumed and leaky transcription was equal to 1%. |
Next: Stochastic model of the positive feedback loop switch >>