 "
"
Team:USTC-China/results
From 2012.igem.org
| (82 intermediate revisions not shown) | |||
| Line 2: | Line 2: | ||
<head> | <head> | ||
<link rel="stylesheet" href="https://2012.igem.org/Team:USTC-China/basic.css?action=raw&ctype=text/css" type="text/css"> | <link rel="stylesheet" href="https://2012.igem.org/Team:USTC-China/basic.css?action=raw&ctype=text/css" type="text/css"> | ||
| + | <link rel="stylesheet" href="https://2012.igem.org/Team:USTC-China/background.css?action=raw&ctype=text/css" type="text/css" media="screen"> | ||
| + | <link href='http://fonts.googleapis.com/css?family=Capriola' rel='stylesheet' type='text/css'> | ||
| + | <link href='http://fonts.googleapis.com/css?family=Dosis' rel='stylesheet' type='text/css'> | ||
| + | <link href='http://fonts.googleapis.com/css?family=Life+Savers' rel='stylesheet' type='text/css'> | ||
| - | |||
<script type="text/javascript" src="https://2012.igem.org/Team:USTC-China/jquery-1.2.3.js?action=raw&ctype=text/javascript"></script> | <script type="text/javascript" src="https://2012.igem.org/Team:USTC-China/jquery-1.2.3.js?action=raw&ctype=text/javascript"></script> | ||
<script type="text/javascript" src="https://2012.igem.org/Team:USTC-China/jquery.easing.1.3.js?action=raw&ctype=text/javascript"></script> | <script type="text/javascript" src="https://2012.igem.org/Team:USTC-China/jquery.easing.1.3.js?action=raw&ctype=text/javascript"></script> | ||
| Line 83: | Line 86: | ||
<div class="menuword"> | <div class="menuword"> | ||
<ul> | <ul> | ||
| - | <li><a href="#1"> | + | <li><a href="#1">1. Test the character of the modified pRM of being activated by the CI.</a></li> |
| - | + | <ol type="i"> | |
| - | < | + | <li><a href="#1.1"> a. plac-gfp </a></li> |
| - | + | <li><a href="#1.2"> b. prm-gfp</a></li> | |
| + | <li><a href="#1.3"> c. plac-cI-prm-gfp </a></li> | ||
| + | </ol> | ||
| + | <li><a href="#2">2. Test the ability of the anticro to repress the expression of the crogfp.</a></li> | ||
| + | <ol type="i"> | ||
| + | <li><a href="#2.1"> a. Difference between pCon(0.244) and pCon(0.856)</a></li> | ||
| + | <li><a href="#2.2"> b. function of anticro</a></li> | ||
| + | </ol> | ||
| + | <li><a href="#3">3. Evaluate the effect of the basic expression level of the lysis on the growth of bacteria.</a></li> | ||
| + | <li><a href="#4">4. Test our final system: fight against the lambda phage!</a></li> | ||
| + | <li><a href="#5">5. Research the relationship between the OD600 measured by spectrophotometer and that measured by microplate reader.</a></li> | ||
| + | </ul> | ||
| + | </div> | ||
| + | </div> | ||
| + | <br/><br/><br/><br/><br/> | ||
<div class="stage"> | <div class="stage"> | ||
| - | <h2><a name="1"> | + | <h2><a name="1">1. Test the character of the modified pRM of being<br/><br/> activated by the CI.</a></h2> |
| - | + | <p>To test the activation and inhibition of pRM, we measure the fluorescence intensity of prm-gfp, plac-gfp and plac-cI-prm-gfp.</p> | |
| - | <p> | + | <h3><a name="1.1">a. plac-gfp </a></h3> |
| - | < | + | <p>Initially, we use IPTG to activate the promoter plac. However, we find that the leak expression of plac is quite high. Even without the existence of IPTG, GFP expresses. This is because there are no lacI genes on the plasmid bones PSB1C3. And K12 strains can not express enough lacI to repress the expression of plac. We look into some documents and find that glucose can repress the expression of plac(<a href="http://en.wikipedia.org/wiki/Lactose_operon">see the character of the plac in the lactose operon</a>).Therefore, we set four experimental groups, adding glucose with concentration of 500mM, 800mM, 1000mM, 1000mM of IPTG and a blank group with nothing added.</p> |
| - | <p> | + | |
| - | + | <div class="imgholder1" align="left" style="clear:both;width:600px;height:auto;margin-left:87px;"> | |
| - | + | <a href="https://static.igem.org/mediawiki/2012/b/bb/Result1.png"><img src="https://static.igem.org/mediawiki/2012/b/bb/Result1.png" alt="Bacteriophage_lambda_genome_total" style="clear:both;width:600px;height:440px;"></a> | |
| - | + | ||
| - | <div class="imgholder1" align="left" style=" | + | |
| - | <a href="https://static.igem.org/mediawiki/2012/ | + | |
</div> | </div> | ||
| - | <p> | + | <p>From figure 1, we can see the unit fluorescence intensity of experimental groups with glucose added is lower than the blank group, because glucose represses the expression of plac, which reduces the expression of GFP. </p> |
| - | <div class="imgholder1" align="left" style=" | + | <p>At the beginning, we can’t observe the activating effect of IPTG on plac, which we ascribe to the unstability of the promoter plac. About 90 minutes later, the unit fluorescence intensity of experimental groups with IPTG added is higher than the blank group, which indicates IPTG’s activation on plac.</p> |
| - | <a href="https://static.igem.org/mediawiki/2012/ | + | <p>The difference of the unit fluorescence intensity between the experimental groups with different concentrations of glucose added is not strictly related to the increasing amount of glucose, because glucose affects the growth and metabolism of E.coli, which brings uncertainty to our experiments.</p> |
| + | <p>About 3 hours later, the difference of the unit fluorescence intensity between the groups abates, because of the consumption of glucose.</p> | ||
| + | <h3><a name="1.2">b. prm-gfp</a></h3> | ||
| + | <div class="imgholder1" align="left" style="clear:both;width:644px;height:auto;margin-left:65px;"> | ||
| + | <a href="https://static.igem.org/mediawiki/2012/9/93/Result2.png"><img src="https://static.igem.org/mediawiki/2012/9/93/Result2.png" alt="Bacteriophage_lambda_genome_total" style="clear:both;width:644px;height:500px;"></a> | ||
</div> | </div> | ||
| - | <p> | + | <p>Figure 2 shows that the fluorescence intensity of prm-gfp is so weak in comparison with plac-gfp that we can assume that the leak expression of prm is very few, which doesn't affect our experiments.</p> |
| - | + | <br/> | |
| - | + | <br/> | |
| - | <div class="imgholder1" align="left" style=" | + | <h3><a name="1.3">c. plac-cI-prm-gfp </a></h3> |
| - | <a href="https://static.igem.org/mediawiki/2012/ | + | <div class="imgholder1" align="left" style="clear:both;width:600px;height:auto;margin-left:87px;"> |
| + | <a href="https://static.igem.org/mediawiki/2012/3/34/Result3.png"><img src="https://static.igem.org/mediawiki/2012/3/34/Result3.png" alt="Bacteriophage_lambda_genome_total" style="clear:both;width:600px;height:358px;"></a> | ||
</div> | </div> | ||
| - | <p> | + | <p>Figure 3 shows similar effects of glucose and IPTG on plac-cI-pRM-gfp. pRM is activated by the protein cI. By adding IPTG, plac is activated, which leads to the production of the protein cI. With the existence of cI, pRM-GFP starts to work. On the contrast, glucose represses the expression of plac, which reduces the protein cI. Therefore, pRM expresses little and the unit fluorescence intensity of experimental groups with glucose added is the lowest.</p> |
| - | <div class="imgholder1" align="left" style=" | + | <br/> |
| - | <a href="https://static.igem.org/mediawiki/2012/ | + | <div class="imgholder1" align="left" style="clear:both;width:600px;height:auto;margin-left:87px;"> |
| + | <a href="https://static.igem.org/mediawiki/2012/c/c3/Result4.png"><img src="https://static.igem.org/mediawiki/2012/c/c3/Result4.png" alt="Bacteriophage_lambda_genome_total" style="clear:both;width:600px;height:433px;"></a> | ||
</div> | </div> | ||
| - | + | <p>Figure 4 shows the difference of the unit fluorescence intensity between plac-gfp and plac-cI-pRM-gfp. Generally, the fluorescence intensity of plac-gfp is higher than that of plac-cI-pRM-gfp, because the transcription efficiency of pRM is quite low(<a href="https://2012.igem.org/Team:USTC-China/background#2.1">see the character of the promoter pRM</a>), which reduces the expression of gfp in comparison with plac-gfp.</p> | |
| - | + | <br/> | |
| - | + | <p>In conclusion, pRM works as we expect.</p> | |
| - | + | ||
| - | + | <h2><a name="2">2. Test the ability of the anticro to repress the expression<br/><br/> of the crogfp.</a></h2> | |
| - | <p> | + | |
| - | + | <h3><a name="2.1">a. Difference between pCon(0.244) and pCon(0.856)</a></h3> | |
| - | + | ||
| - | + | <div class="imgholder1" align="left" style="clear:both;width:600px;height:auto;margin-left:87px;"> | |
| - | + | <a href="https://static.igem.org/mediawiki/2012/4/49/Result5.png"><img src="https://static.igem.org/mediawiki/2012/4/49/Result5.png" alt="Bacteriophage_lambda_genome_total" style="clear:both;width:600px;height:412px;"></a> | |
| - | + | ||
| - | + | ||
| - | + | ||
| - | + | ||
| - | + | ||
| - | + | ||
| - | + | ||
| - | + | ||
| - | + | ||
| - | + | ||
| - | + | ||
| - | + | ||
| - | + | ||
| - | + | ||
| - | + | ||
| - | + | ||
| - | + | ||
| - | + | ||
| - | + | ||
| - | + | ||
| - | + | ||
| - | + | ||
| - | + | ||
| - | + | ||
| - | + | ||
| - | + | ||
| - | 4 | + | |
| - | + | ||
| - | + | ||
| - | + | ||
| - | + | ||
| - | + | ||
| - | + | ||
| - | + | ||
| - | + | ||
| - | + | ||
| - | + | ||
| - | + | ||
| - | + | ||
| - | + | ||
| - | + | ||
| - | + | ||
| - | + | ||
| - | + | ||
| - | + | ||
| - | + | ||
| - | + | ||
| - | + | ||
| - | + | ||
| - | + | ||
| - | + | ||
| - | + | ||
| - | + | ||
| - | + | ||
| - | + | ||
| - | + | ||
| - | + | ||
| - | + | ||
| - | + | ||
| - | + | ||
| - | + | ||
| - | + | ||
| - | + | ||
| - | + | ||
| - | + | ||
| - | + | ||
| - | + | ||
| - | + | ||
| - | + | ||
| - | + | ||
| - | + | ||
| - | + | ||
| - | + | ||
| - | + | ||
| - | + | ||
| - | + | ||
| - | + | ||
| - | + | ||
| - | + | ||
| - | + | ||
| - | + | ||
| - | + | ||
| - | + | ||
| - | + | ||
| - | + | ||
| - | + | ||
| - | + | ||
| - | + | ||
| - | + | ||
| - | + | ||
| - | + | ||
| - | + | ||
| - | + | ||
| - | + | ||
| - | + | ||
| - | + | ||
| - | + | ||
| - | + | ||
| - | + | ||
| - | + | ||
| - | + | ||
| - | + | ||
| - | + | ||
| - | + | ||
| - | + | ||
| - | + | ||
| - | + | ||
| - | + | ||
| - | + | ||
| - | + | ||
| - | + | ||
| - | + | ||
| - | + | ||
| - | + | ||
| - | + | ||
| - | + | ||
| - | + | ||
| - | + | ||
| - | + | ||
| - | + | ||
| - | + | ||
| - | + | ||
| - | + | ||
| - | + | ||
| - | + | ||
| - | + | ||
| - | + | ||
| - | + | ||
| - | + | ||
| - | + | ||
| - | + | ||
| - | + | ||
| - | + | ||
| - | + | ||
| - | + | ||
| - | + | ||
| - | + | ||
| - | + | ||
| - | + | ||
| - | + | ||
| - | + | ||
| - | + | ||
| - | + | ||
| - | + | ||
| - | + | ||
| - | + | ||
| - | + | ||
| - | + | ||
| - | + | ||
| - | + | ||
| - | + | ||
| - | + | ||
| - | + | ||
| - | + | ||
| - | + | ||
| - | + | ||
| - | + | ||
| - | + | ||
| - | + | ||
| - | + | ||
| - | + | ||
| - | + | ||
| - | + | ||
| - | + | ||
| - | + | ||
| - | + | ||
| - | + | ||
| - | + | ||
| - | + | ||
| - | + | ||
| - | + | ||
| - | + | ||
| - | + | ||
| - | + | ||
| - | + | ||
| - | + | ||
| - | + | ||
| - | + | ||
| - | + | ||
| - | + | ||
| - | + | ||
| - | + | ||
| - | + | ||
| - | + | ||
| - | + | ||
| - | + | ||
| - | + | ||
| - | + | ||
| - | + | ||
| - | + | ||
| - | + | ||
| - | + | ||
| - | + | ||
| - | + | ||
| - | + | ||
| - | + | ||
| - | + | ||
| - | + | ||
| - | + | ||
| - | + | ||
| - | + | ||
| - | + | ||
| - | + | ||
| - | + | ||
| - | + | ||
| - | + | ||
| - | + | ||
| - | + | ||
| - | + | ||
| - | + | ||
| - | + | ||
| - | + | ||
| - | + | ||
| - | + | ||
| - | + | ||
| - | + | ||
| - | + | ||
| - | + | ||
| - | <br /> | + | |
| - | <p> | + | |
| - | + | ||
| - | + | ||
| - | < | + | |
| - | + | ||
| - | + | ||
| - | + | ||
| - | + | ||
| - | + | ||
| - | + | ||
| - | + | ||
| - | + | ||
| - | + | ||
| - | + | ||
| - | + | ||
| - | + | ||
| - | + | ||
| - | + | ||
| - | + | ||
| - | + | ||
| - | + | ||
| - | + | ||
| - | + | ||
| - | + | ||
| - | + | ||
| - | + | ||
| - | + | ||
| - | + | ||
| - | + | ||
| - | + | ||
| - | + | ||
| - | + | ||
| - | + | ||
| - | + | ||
| - | + | ||
| - | + | ||
| - | + | ||
| - | + | ||
| - | + | ||
| - | + | ||
| - | + | ||
| - | + | ||
| - | + | ||
| - | + | ||
| - | + | ||
| - | + | ||
| - | + | ||
| - | + | ||
| - | + | ||
| - | + | ||
| - | + | ||
| - | + | ||
| - | + | ||
| - | + | ||
| - | + | ||
| - | + | ||
| - | + | ||
| - | + | ||
| - | + | ||
| - | + | ||
| - | + | ||
| - | + | ||
| - | + | ||
| - | + | ||
| - | + | ||
| - | + | ||
| - | < | + | |
| - | + | ||
| - | + | ||
| - | + | ||
| - | <h3><a name=" | + | |
| - | + | ||
| - | + | ||
| - | + | ||
| - | + | ||
| - | + | ||
| - | + | ||
| - | + | ||
| - | <div class="imgholder1" align="left" style=" | + | |
| - | <a href="https://static.igem.org/mediawiki/2012/ | + | |
</div> | </div> | ||
| - | <p> | + | <p>Figure 5 shows the difference in intensity of expression of pCon(0.244) and pCon(0.856). Obviously pCon(0.856) expresses much stronger than pCon(0.244).</p> |
| - | + | <br/> | |
| - | <div class="imgholder1" align="left" style=" | + | <br/> |
| - | <a href="https://static.igem.org/mediawiki/2012/2/ | + | <h3><a name="2.2">b. function of anticro</a></h3> |
| + | <p>To test the function of antisense RNA to cro (<a href="https://2012.igem.org/Team:USTC-China/methods#3.3">anticro</a>) we have constructed, we measure the fluorescence intensity of plac-anticroT-pcon(0.856)-<a href="http://partsregistry.org/wiki/index.php?title=Part:BBa_K741006">crogfp</a> and plac-cI-prm-anticroT-pcon(0.856)-crogfp.</p> | ||
| + | <div class="imgholder1" align="left" style="clear:both;width:700px;height:auto;margin-left:37px;"> | ||
| + | <a href="https://static.igem.org/mediawiki/2012/2/2a/Result6.png"><img src="https://static.igem.org/mediawiki/2012/2/2a/Result6.png" alt="Bacteriophage_lambda_genome_total" style="clear:both;width:700px;height:417px;"></a> | ||
</div> | </div> | ||
| - | <p> | + | <p>At the beginning, the unit fluorescence intensity of the experimental groups with glucose added is the lowest, because glucose promotes the growth of E.coli., which makes the rate of fluorescence divided by OD lower than the other two groups.</p> |
| - | + | <p>About 45 minutes later, the unit fluorescence intensity of experimental groups with glucose added is higher than the blank group, because glucose represses the expression of plac, which reduces the transcription of anticro. Therefore, the translation of crogfp is repressed less and the unit fluorescence intensity is higher.</p> | |
| - | <div class="imgholder1" align="left" style=" | + | <p>On the contrast, IPTG activates plac, which increases the transcription of anticro. Anticro binds to the mRNA crogfp and represses its translation.</p> |
| - | <a href="https://static.igem.org/mediawiki/2012/ | + | |
| + | <div class="imgholder1" align="left" style="clear:both;width:700px;height:auto;margin-left:37px;"> | ||
| + | <a href="https://static.igem.org/mediawiki/2012/d/de/Result7.png"><img src="https://static.igem.org/mediawiki/2012/d/de/Result7.png" alt="Bacteriophage_lambda_genome_total" style="clear:both;width:700px;height:423px;"></a> | ||
</div> | </div> | ||
| - | <p>7. | + | <p>Figure 7. shows similar effects of glucose and IPTG on plac-cI-pRM-anticroT-pcon(0.856)-crogfp. pRM is activated by the protein cI. By adding IPTG, plac is activated, which leads to the production of the protein cI. With the existence of cI, pRM-anticroT starts to work and antirco represses the translation of crogfp. On the contrast, glucose represses the expression of plac, which reduces the protein cI. pRM expresses less and the translation of crogfp is repressed less. Therefore, the unit fluorescence intensity of experimental groups with glucose added is the highest.</p> |
| - | + | <div class="imgholder1" align="left" style="clear:both;width:600px;height:auto;margin-left:87px;"> | |
| - | <div class="imgholder1" align="left" style=" | + | <a href="https://static.igem.org/mediawiki/2012/4/4f/Result8.png"><img src="https://static.igem.org/mediawiki/2012/4/4f/Result8.png" alt="Bacteriophage_lambda_genome_total" style="clear:both;width:600px;height:405px;"></a> |
| - | <a href="https://static.igem.org/mediawiki/2012/ | + | |
</div> | </div> | ||
| - | + | <div class="imgholder1" align="left" style="clear:both;width:600px;height:auto;margin-left:87px;"> | |
| - | <div class="imgholder1" align="left" style=" | + | <a href="https://static.igem.org/mediawiki/2012/3/32/Result9.png"><img src="https://static.igem.org/mediawiki/2012/3/32/Result9.png" alt="Bacteriophage_lambda_genome_total" style="clear:both;width:600px;height:367px;"></a> |
| - | <a href="https://static.igem.org/mediawiki/2012/ | + | |
</div> | </div> | ||
| - | < | + | <p>From Figure 8 and Figure 9 , we can prove that anticro has the function to repress the translation of crogfp. The difference of unit fluorescence intensity between pCon(0.244)-crogfp and in plac-anticro-pCon(0.244)-crogfp in Figure 9 is obviously much less than that between pCon(0.856)-crogfp and in plac-anticro-pCon(0.856)-crogfp in Figure 8. because pCon(0.244) expresses relatively low. (Without enough time, we have not constructed the circuit plac-cI-pRM-anticroT-pCon(0.244)-crogfp.)</p> |
| - | < | + | <br/> |
| - | <br /> | + | <p>Above all, these results show reliable evidence that the anticro we have constructed can effectively repress the expression of crogfp.</p> |
| - | < | + | |
| - | < | + | |
| - | <p> | + | |
| - | + | <h2><a name="3">3. Evaluate the effect of the basic expression level of the<br/><br/> lysis on the growth of bacteria.</a></h2> | |
| - | + | <p>Stability is particularly important to our system because we have lysis gene in it. If our system are not stable enough ,which means the basic expression of lysis is too high, cells die easily and the system will go to crash soon. The practicability demands that our engineered bacteria won't die too much to influence the daily manufacture under normal conditions. To prove this, we did experiments and here are our results. </p> | |
| - | + | <p>We measured the growth curve of our engineered E.coli strain with part pRM-anticro-pRM-lysis on plasmid pSB1C3 which is our final circuit and an E.coli strain with part croGFP on plasmid pSB1C3 which hardly influence the growth as the control group. It is known that the growth curve obey the model:</p> | |
| - | + | ||
| - | + | <div align="left" style="width:172px;height:auto;margin-left:250px;"> | |
| - | + | <a href="https://static.igem.org/mediawiki/2012/4/48/Formulaustc1.jpg"><img src="https://static.igem.org/mediawiki/2012/4/48/Formulaustc1.jpg" alt="Curve" style="clear:both;width:172;height:50px;"></a></div> | |
| - | + | ||
| - | < | + | <p>x is the concentration of microbe.x<sub>0</sub> is the initial concentration when t=t<sub>0</sub>.μ<sub>m</sub> is the natural growth rate.</p> |
| - | < | + | <p>Calculate the natural logarithm of both side of the equation,we can get:</p> |
| - | < | + | |
| - | <br /> | + | |
| - | < | + | <div align="left" style="width:280px;height:auto;margin-left:200px;"> |
| - | < | + | <a href="https://static.igem.org/mediawiki/2012/3/30/Formulaustc2.jpg"><img src="https://static.igem.org/mediawiki/2012/3/30/Formulaustc2.jpg" alt="Curve" style="clear:both;width:280;height:49px;"></a></div> |
| - | < | + | |
| - | <table border="1" style="text-align:center;"> | + | <p>Obviously,the variable lnx is linear to the variable t.And the slope is μ<sub>m</sub>.</p> |
| + | <p>We calculate the natural logarithm of OD600 data we get and do linear fit to the data.Then we get the slope which is the natural growth rate μ<sub>m</sub>.</p> | ||
| + | <p>We assume that μ<sub>m</sub> can reflect the rate of cells death caused by the basic expression of lysis.If the death effect can't be ignored,the value of μ<sub>m</sub> obtained from the experimental group will be obviously less than the control group.</p> | ||
| + | <p>The growth curve(fig.10) seems not so typical,probably because the bacteria may sense the environmental press at early stage.But since the two curve is similar,we can assert that our circuit is not the cause of the difference. Analyzing the two figures(fig.10&fig.11),we can see the first four data points lie in the logarithmic phase, and the ln(OD600) is linear to t(time).</p> | ||
| + | |||
| + | |||
| + | <div class="imgholder1" align="center" style="width:750px;height:auto;"> | ||
| + | <a href="https://static.igem.org/mediawiki/2012/b/b1/Curve.jpg"><img src="https://static.igem.org/mediawiki/2012/b/b1/Curve.jpg" alt="Curve" style="clear:both;width:750px;height:300px;"></a><br><small align="center">Figure 10. Growth curve of the two groups. (a)experiment group prm-anticro-prm-lysis (b)control group croGFP</small></div> | ||
| + | |||
| + | <div class="imgholder1" align="center" style="width:750px;height:auto;"> | ||
| + | <a href="https://static.igem.org/mediawiki/2012/9/96/Points.jpg"><img src="https://static.igem.org/mediawiki/2012/9/96/Points.jpg" alt="Points" style="clear:both;width:750px;height:300px;"></a><br><small align="center">Figure 11. Points of ln(OD600) to t. (a)experiment group prm-anticro-prm-lysis (b)control group croGFP </small></div> | ||
| + | |||
| + | <p>We select the four data points and do linear fit. Then we can get μ<sub>m,exp</sub>(experimental group) and μ<sub>m,ctrl</sub>(control group).</p> | ||
| + | |||
| + | <div class="imgholder1" align="center" style="width:750px;height:auto;"> | ||
| + | <a href="https://static.igem.org/mediawiki/2012/0/0a/Fitlysis01.png"><img src="https://static.igem.org/mediawiki/2012/0/0a/Fitlysis01.png" alt="Fitlysis01" style="clear:both;width:750px;height:300px;"></a><br><small align="center">Figure 12. Linear fit of ln(OD600) to t. (a)experiment group prm-anticro-prm-lysis (b)control group croGFP</small></div> | ||
| + | <br/> | ||
| + | <br/> | ||
| + | <div style="margin-left:20px;"> | ||
| + | <table border="1" style="text-align:center;font-size:14pt;font-family: "Lucida Grande", "Lucida Sans Unicode", Arial;"> | ||
<tr> | <tr> | ||
<td></td> | <td></td> | ||
| - | <td> | + | <td colspan="2">Experiment Group</td> |
| - | <td> | + | <td colspan="2">Control Group</td> |
| - | </tr> | + | </tr> |
<tr> | <tr> | ||
| - | <td> | + | <td> </td> |
| - | <td> | + | <td> Value </td> |
| - | <td> | + | <td> Standard Error </td> |
| + | <td> Value </td> | ||
| + | <td> Standard Error </td> | ||
</tr> | </tr> | ||
<tr> | <tr> | ||
| - | <td> | + | <td> Slope,μ<sub>m</sub> </td> |
| - | <td>0. | + | <td> 1.49914 </td> |
| - | <td> | + | <td> 0.08934 </td> |
| + | <td> 1.1957 </td> | ||
| + | <td> 0.08237 </td> | ||
</tr> | </tr> | ||
<tr> | <tr> | ||
| - | <td> | + | <td> Linearly Dependent Coefficient </td> |
| - | <td> | + | <td> 0.98942 </td> |
| - | <td> | + | <td> </td> |
| - | </ | + | <td> 0.9859 </td> |
| + | <td> </td> | ||
</table> | </table> | ||
| - | <br | + | </br> |
| - | < | + | <small style="margin-left:150px;">Table 1. Results of linear fit of ln(OD600) to t.</small> |
| - | + | </div> | |
| - | + | ||
| - | + | ||
| - | + | ||
| - | + | ||
| - | + | ||
| - | + | ||
| - | + | ||
| - | + | ||
| - | + | ||
| - | + | ||
| - | + | ||
| - | + | ||
| - | + | ||
| - | + | ||
| - | + | ||
| - | + | ||
| - | + | ||
| - | + | ||
| - | + | ||
| - | + | ||
| - | + | ||
| - | + | ||
| - | + | ||
| - | + | ||
| - | + | ||
| - | + | ||
| - | + | ||
| - | + | ||
| - | + | ||
| - | + | ||
| - | + | ||
<br /> | <br /> | ||
| + | </br> | ||
| + | <p>Our data shows that μ<sub>m,exp</sub>(experimental group) is even lager than μ<sub>m, ctrl</sub>(control group).Then we can conclude that our circuit is stable in normal conditions. Users need not worry that bacteria may die when nothing is happening.</p> | ||
<br /> | <br /> | ||
<br /> | <br /> | ||
| + | |||
| + | <h2><a name="4">4. Test our final system: fight against the lambda phage!</a></h2> | ||
| + | <p>Phage enumerations, expressed as plaque forming units (PFU) per milliliter, were performed by the double-layer plaque titration method, which can conform the efficiency of design. During the experiment, all the E.coli strain is DH5α, while the control group and experiment group has different genes. Experimental group contained pRM-anticro-pRM-RBS-lysis-T (pSB1C3) and the control group contained RBS-crogfp-T (pSB1C3) and pRM-RBS-gfp-T (pSB1C3) respectively.</p> | ||
| + | <br/> | ||
| + | <div class="imgholder1" align="left" style="clear:both;width:525px;height:auto;margin-left:130px;"> | ||
| + | <a href="https://static.igem.org/mediawiki/igem.org/b/bd/Table_of_phage.png"><img src="https://static.igem.org/mediawiki/igem.org/b/bd/Table_of_phage.png" alt="" style="clear:both;width:515px;height:221px;"></a><br/><small> Table 2. Phage enumerations of different group with different concentrations of phage</small> | ||
| + | </div> | ||
| + | </br></br> | ||
| + | <div class="imgholder1" align="center" style="clear:both;width:581px;height:auto;margin-left:91px;"> | ||
| + | <a href="https://static.igem.org/mediawiki/igem.org/4/41/Plaque.jpg"><img src="https://static.igem.org/mediawiki/igem.org/4/41/Plaque.jpg" alt="" style="clear:both;width:581px;height:599px;"></a></br><small> Figure13. Phage enumerations of different group with different concentrations of phage Dilution Multiple of phage in A, B, C, D are 0, 10<sup>-12</sup>, 10<sup>-10</sup>, 10<sup>-8</sup> respectively. Group 1, 2, 3 are pRM-RBS-gfp-T (pSB1C3), RBS-crogfp-T (pSB1C3), pRM-anticro-pRM-RBS-lysis-T (pSB1C3)</small> | ||
| + | </div> | ||
| + | </br> | ||
| + | <p>This experiment directly proved the utility of our design. As the table2 and figure13, the experimental group didn't have any plaques, which indicates our design has done its job. The bacteria with pRM-RBS-gfp-T showed resistibility which is the same with another experiment. We suspicions it is the promoter pRM that impacts the resistibility to the lambda phage. The following experiments confirmed this idea. We present the following hypothesis to describe the mechanism of pRM promoter defending the phage. The promoter pRM can be both bound by protein CI and Cro, despite the protein CI is more tendentious to bind pRM. In the bacteria, the plasmid with pRM on it has high copy number, which means there are much more pRM than usual situation when the infection occurs. If the phage expresses Cro, the Cro will bind pRM, which lead to the dramatically decreasing concentration of cro. Thus, the phage will retain in Lysogenic period. However, more experiments are needed to test this hypothesis.</p> | ||
| + | |||
<br /> | <br /> | ||
| - | |||
<br /> | <br /> | ||
| - | < | + | <h2><a name="5">5. Research the relationship between the OD600</br></br> measured by spectrophotometer and that measured by</br></br> microplate reader.</a></h2> |
| - | + | <p>We perform the measurement with SpectraMax M5 Multi-Mode Microplate Reader. Although the microplate reader can easily and quickly measure the optical density of the liquid on the ELISA plate, the optical system in the microplate reader doesn’t abide by the Beer–Lambert law. That means the optical density measured by it cannot easily be transformed into that measured by the spectrophotometer. In order to help people use the statistics measured by the microplate reader, we design experiments to research the relationship between the OD600 measured by HITACHI U-5100UV/VIS spectrophotometer and that measured by SpectraMax M5 Multi-Mode Microplate Reader.</p> | |
| - | + | ||
| - | + | ||
| - | + | ||
| - | 5. | + | |
| - | + | ||
| - | + | ||
| - | + | ||
| - | + | ||
| - | + | ||
| - | + | ||
| - | + | ||
| - | + | ||
| - | + | ||
| - | + | ||
| - | + | ||
| - | + | ||
| - | + | ||
| - | < | + | |
| - | + | ||
| - | + | ||
| - | + | ||
| - | + | ||
| - | + | ||
| - | + | ||
| - | + | ||
| - | + | ||
| - | + | ||
| - | + | ||
| - | + | ||
| - | + | ||
| - | + | ||
| - | + | ||
| + | <img src="https://static.igem.org/mediawiki/2012/1/17/SpectraMax_M5_Multi-Mode_Microplate_Reader.png" style="width:450px;align:center;"></br> | ||
| + | <small><p style="align:center">Our SpectraMax M5 Multi-Mode Microplate Reader.</p></small> | ||
| + | <br><br><br><br> | ||
| + | <img src="https://static.igem.org/mediawiki/2012/1/11/VIS_spectrophotometer.png" style="width:600px;align:center;"></br> | ||
| + | <small><p style="align:center">Our two HITACHI U-5100UV/VIS spectrophotometers.</p></small> | ||
| - | <br/> | + | <p>We incubate the bacteria in liquid LB media and measure the optical density of the culture both by the SpectraMax M5 Multi-Mode Microplate Reader and the HITACHI U-5100UV/VIS spectrophotometer. Here is our result:</p> |
| - | <br/> | + | <img src="https://static.igem.org/mediawiki/igem.org/b/bf/Relationship.png" style="width:700px;align:center;"></br> |
| - | <br/> | + | <small><p style="align:center">The linear fit of the OD measured by spectrophotometer to that measured by microplate reader.</p></small> |
| + | <p>OD(spectrophotometer) = 2.48875 × OD(microplate reader) + 0.0136</p></br> | ||
| + | <p>The linearly dependent coefficient is 0.99985, very close to 1. That means the relationship between the OD600 measured by HITACHI U-5100UV/VIS spectrophotometer and that measured by SpectraMax M5 Multi-Mode Microplate Reader is almost linear.</p> | ||
| + | <br /> | ||
</div> | </div> | ||
| Line 586: | Line 294: | ||
<p class="level1"><a href="https://2012.igem.org/Team:USTC-China/methods">Methods</a></p> | <p class="level1"><a href="https://2012.igem.org/Team:USTC-China/methods">Methods</a></p> | ||
| - | <p class="level0"><a href="https://2012.igem.org/Team:USTC-China/ | + | <p class="level0"><a href="https://2012.igem.org/Team:USTC-China/results">ACHIEVEMENTS</a></p> |
<p class="level1"><a href="https://2012.igem.org/Team:USTC-China/results">Results</a></p> | <p class="level1"><a href="https://2012.igem.org/Team:USTC-China/results">Results</a></p> | ||
Latest revision as of 04:05, 27 September 2012

RESULTS

1. Test the character of the modified pRM of being
activated by the CI.
To test the activation and inhibition of pRM, we measure the fluorescence intensity of prm-gfp, plac-gfp and plac-cI-prm-gfp.
a. plac-gfp
Initially, we use IPTG to activate the promoter plac. However, we find that the leak expression of plac is quite high. Even without the existence of IPTG, GFP expresses. This is because there are no lacI genes on the plasmid bones PSB1C3. And K12 strains can not express enough lacI to repress the expression of plac. We look into some documents and find that glucose can repress the expression of plac(see the character of the plac in the lactose operon).Therefore, we set four experimental groups, adding glucose with concentration of 500mM, 800mM, 1000mM, 1000mM of IPTG and a blank group with nothing added.

From figure 1, we can see the unit fluorescence intensity of experimental groups with glucose added is lower than the blank group, because glucose represses the expression of plac, which reduces the expression of GFP.
At the beginning, we can’t observe the activating effect of IPTG on plac, which we ascribe to the unstability of the promoter plac. About 90 minutes later, the unit fluorescence intensity of experimental groups with IPTG added is higher than the blank group, which indicates IPTG’s activation on plac.
The difference of the unit fluorescence intensity between the experimental groups with different concentrations of glucose added is not strictly related to the increasing amount of glucose, because glucose affects the growth and metabolism of E.coli, which brings uncertainty to our experiments.
About 3 hours later, the difference of the unit fluorescence intensity between the groups abates, because of the consumption of glucose.
b. prm-gfp

Figure 2 shows that the fluorescence intensity of prm-gfp is so weak in comparison with plac-gfp that we can assume that the leak expression of prm is very few, which doesn't affect our experiments.
c. plac-cI-prm-gfp

Figure 3 shows similar effects of glucose and IPTG on plac-cI-pRM-gfp. pRM is activated by the protein cI. By adding IPTG, plac is activated, which leads to the production of the protein cI. With the existence of cI, pRM-GFP starts to work. On the contrast, glucose represses the expression of plac, which reduces the protein cI. Therefore, pRM expresses little and the unit fluorescence intensity of experimental groups with glucose added is the lowest.
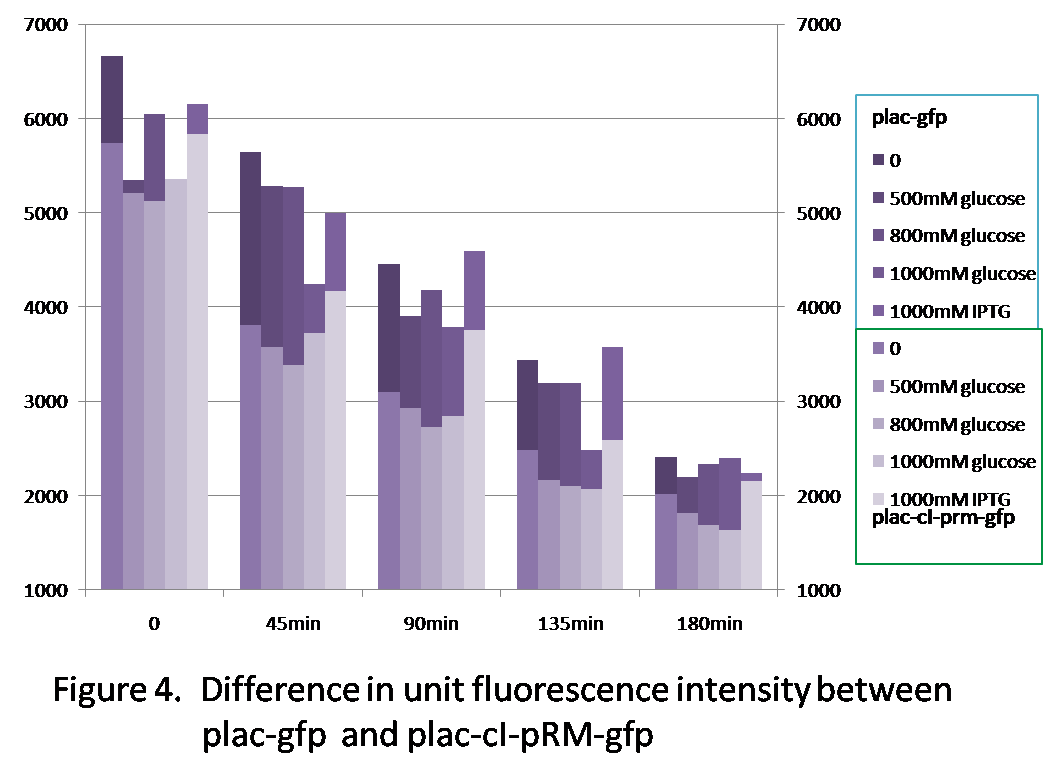
Figure 4 shows the difference of the unit fluorescence intensity between plac-gfp and plac-cI-pRM-gfp. Generally, the fluorescence intensity of plac-gfp is higher than that of plac-cI-pRM-gfp, because the transcription efficiency of pRM is quite low(see the character of the promoter pRM), which reduces the expression of gfp in comparison with plac-gfp.
In conclusion, pRM works as we expect.
2. Test the ability of the anticro to repress the expression
of the crogfp.
a. Difference between pCon(0.244) and pCon(0.856)

Figure 5 shows the difference in intensity of expression of pCon(0.244) and pCon(0.856). Obviously pCon(0.856) expresses much stronger than pCon(0.244).
b. function of anticro
To test the function of antisense RNA to cro (anticro) we have constructed, we measure the fluorescence intensity of plac-anticroT-pcon(0.856)-crogfp and plac-cI-prm-anticroT-pcon(0.856)-crogfp.

At the beginning, the unit fluorescence intensity of the experimental groups with glucose added is the lowest, because glucose promotes the growth of E.coli., which makes the rate of fluorescence divided by OD lower than the other two groups.
About 45 minutes later, the unit fluorescence intensity of experimental groups with glucose added is higher than the blank group, because glucose represses the expression of plac, which reduces the transcription of anticro. Therefore, the translation of crogfp is repressed less and the unit fluorescence intensity is higher.
On the contrast, IPTG activates plac, which increases the transcription of anticro. Anticro binds to the mRNA crogfp and represses its translation.
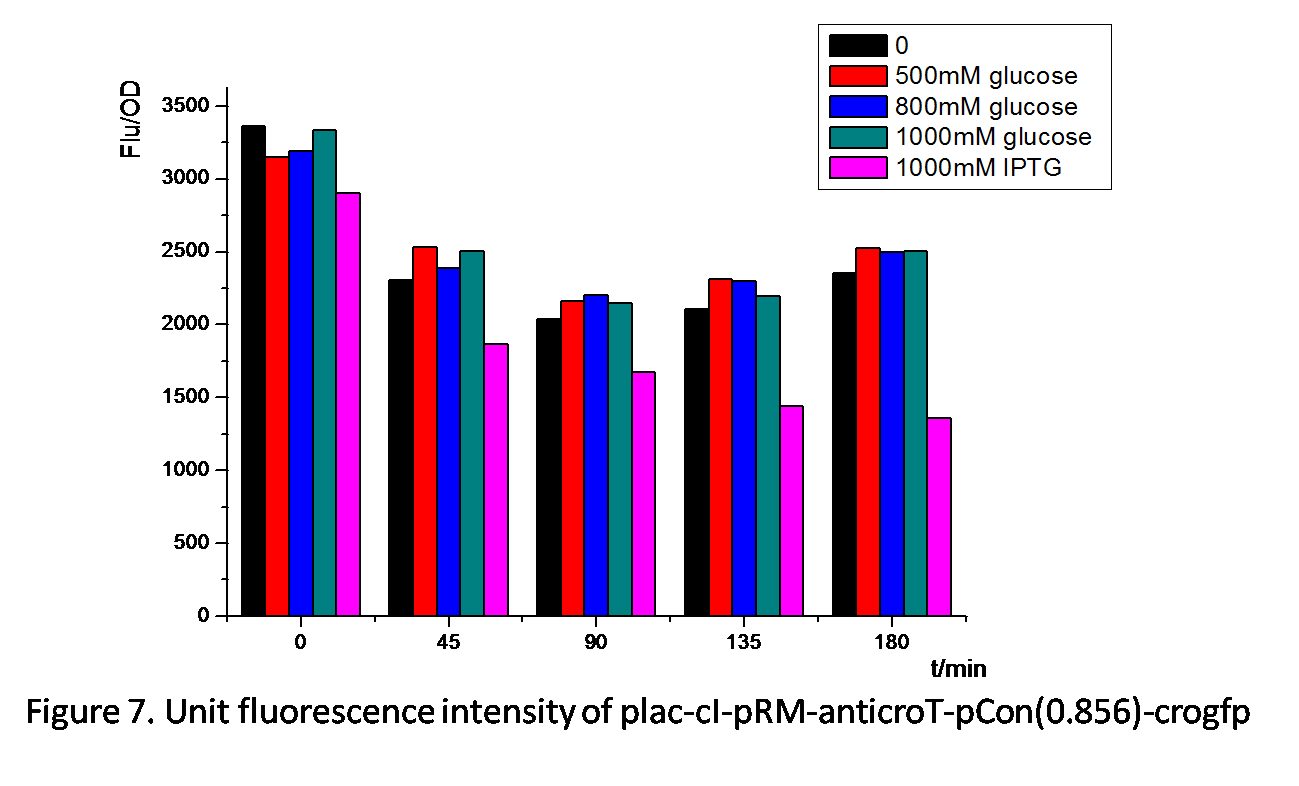
Figure 7. shows similar effects of glucose and IPTG on plac-cI-pRM-anticroT-pcon(0.856)-crogfp. pRM is activated by the protein cI. By adding IPTG, plac is activated, which leads to the production of the protein cI. With the existence of cI, pRM-anticroT starts to work and antirco represses the translation of crogfp. On the contrast, glucose represses the expression of plac, which reduces the protein cI. pRM expresses less and the translation of crogfp is repressed less. Therefore, the unit fluorescence intensity of experimental groups with glucose added is the highest.

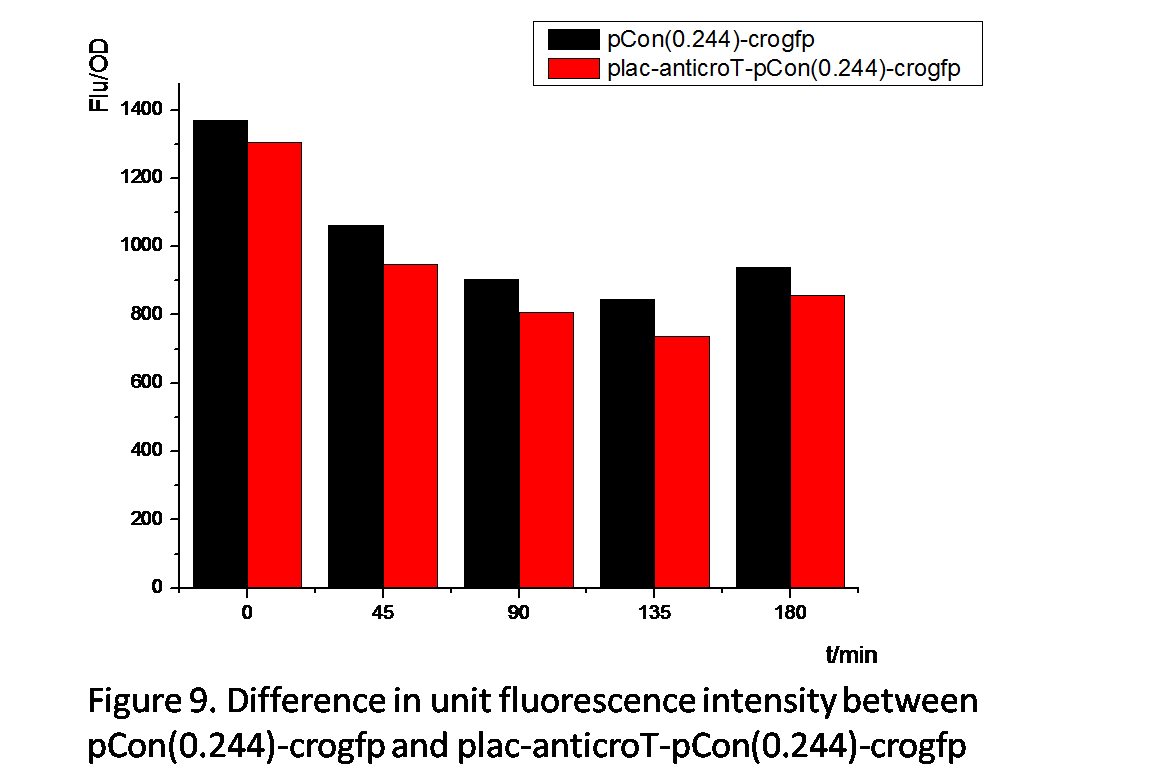
From Figure 8 and Figure 9 , we can prove that anticro has the function to repress the translation of crogfp. The difference of unit fluorescence intensity between pCon(0.244)-crogfp and in plac-anticro-pCon(0.244)-crogfp in Figure 9 is obviously much less than that between pCon(0.856)-crogfp and in plac-anticro-pCon(0.856)-crogfp in Figure 8. because pCon(0.244) expresses relatively low. (Without enough time, we have not constructed the circuit plac-cI-pRM-anticroT-pCon(0.244)-crogfp.)
Above all, these results show reliable evidence that the anticro we have constructed can effectively repress the expression of crogfp.
3. Evaluate the effect of the basic expression level of the
lysis on the growth of bacteria.
Stability is particularly important to our system because we have lysis gene in it. If our system are not stable enough ,which means the basic expression of lysis is too high, cells die easily and the system will go to crash soon. The practicability demands that our engineered bacteria won't die too much to influence the daily manufacture under normal conditions. To prove this, we did experiments and here are our results.
We measured the growth curve of our engineered E.coli strain with part pRM-anticro-pRM-lysis on plasmid pSB1C3 which is our final circuit and an E.coli strain with part croGFP on plasmid pSB1C3 which hardly influence the growth as the control group. It is known that the growth curve obey the model:

x is the concentration of microbe.x0 is the initial concentration when t=t0.μm is the natural growth rate.
Calculate the natural logarithm of both side of the equation,we can get:

Obviously,the variable lnx is linear to the variable t.And the slope is μm.
We calculate the natural logarithm of OD600 data we get and do linear fit to the data.Then we get the slope which is the natural growth rate μm.
We assume that μm can reflect the rate of cells death caused by the basic expression of lysis.If the death effect can't be ignored,the value of μm obtained from the experimental group will be obviously less than the control group.
The growth curve(fig.10) seems not so typical,probably because the bacteria may sense the environmental press at early stage.But since the two curve is similar,we can assert that our circuit is not the cause of the difference. Analyzing the two figures(fig.10&fig.11),we can see the first four data points lie in the logarithmic phase, and the ln(OD600) is linear to t(time).

Figure 10. Growth curve of the two groups. (a)experiment group prm-anticro-prm-lysis (b)control group croGFP
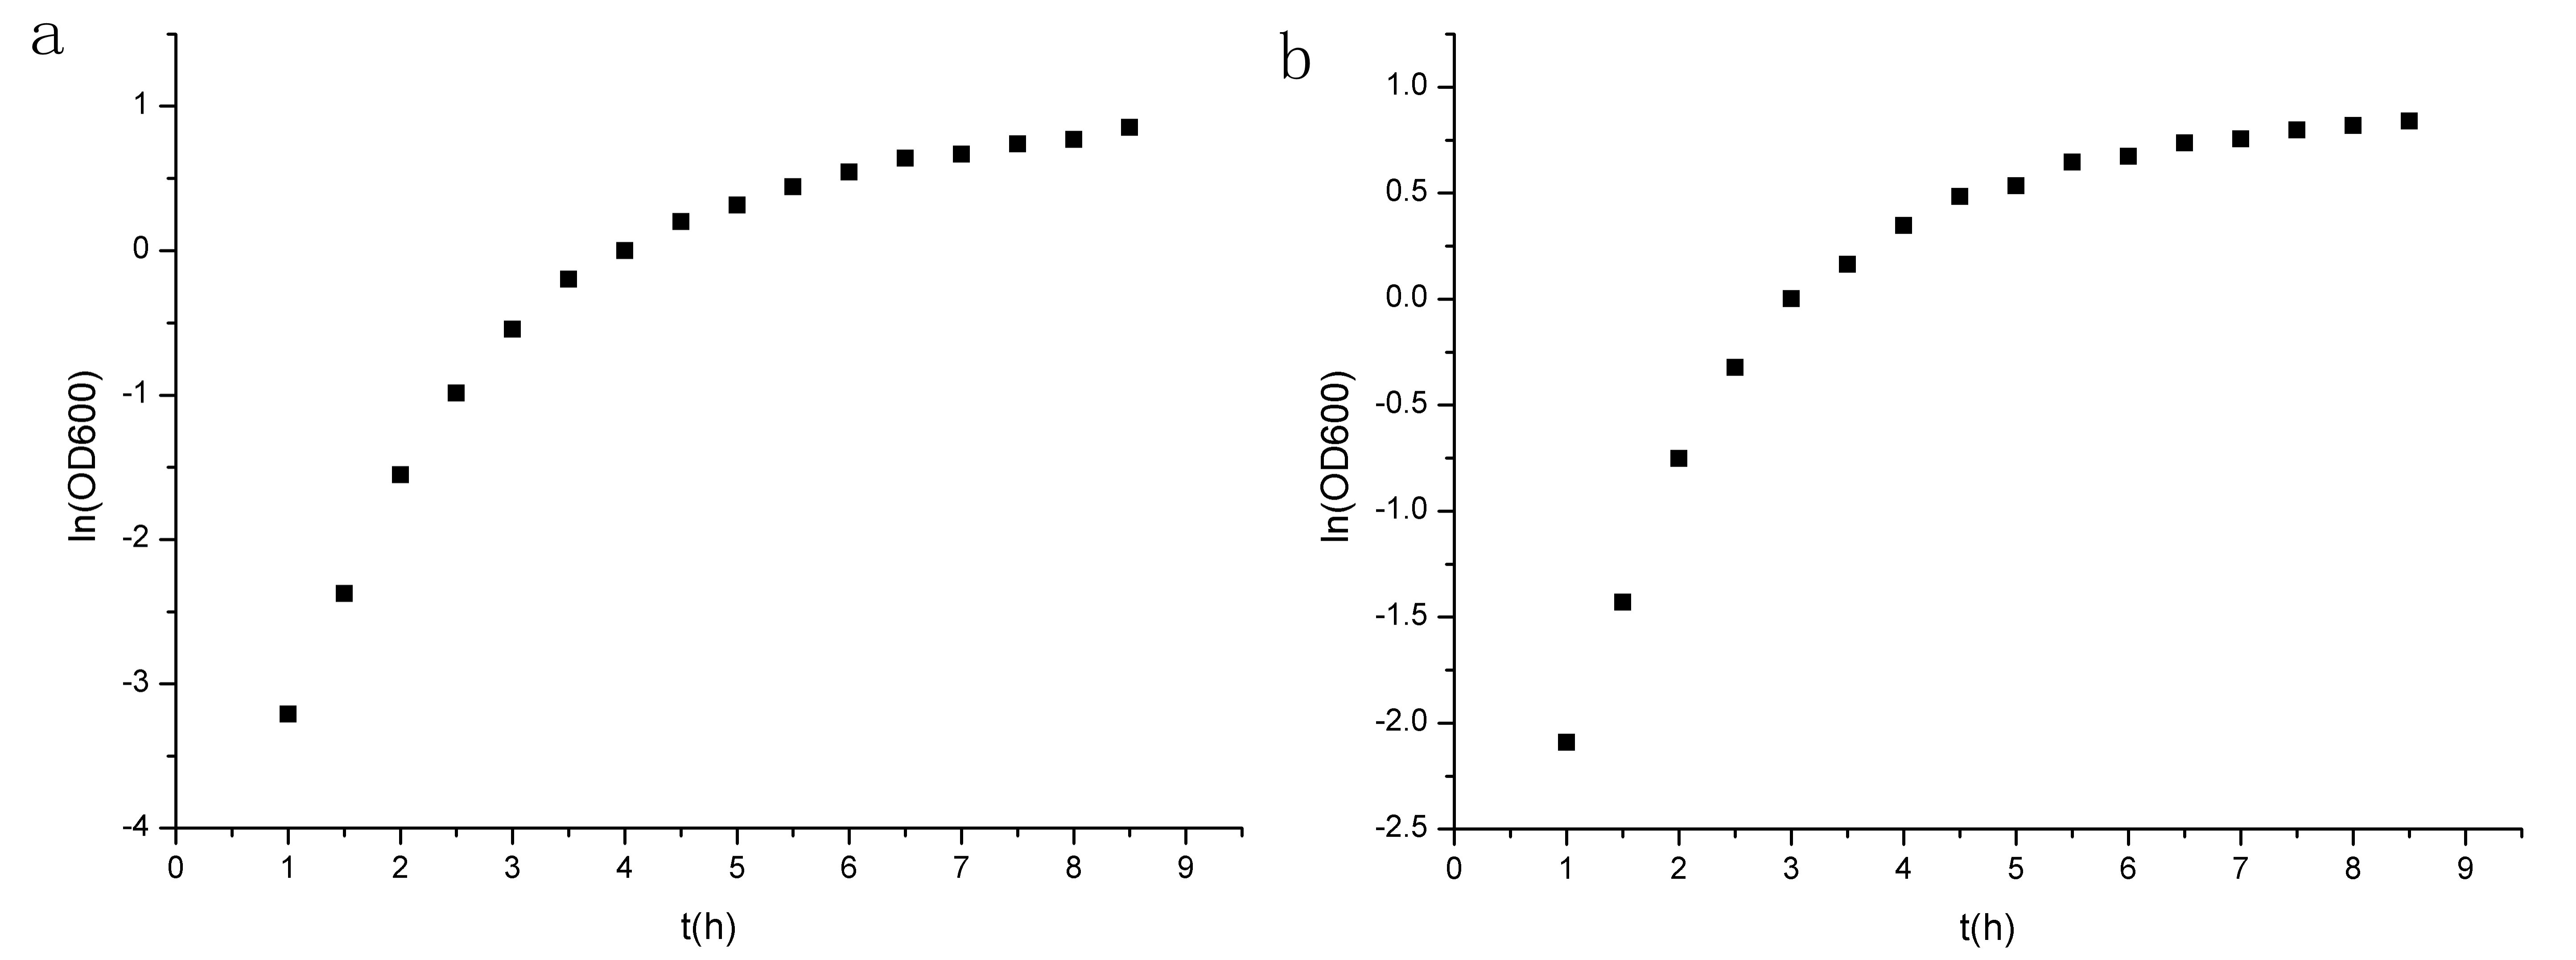
Figure 11. Points of ln(OD600) to t. (a)experiment group prm-anticro-prm-lysis (b)control group croGFP
We select the four data points and do linear fit. Then we can get μm,exp(experimental group) and μm,ctrl(control group).

Figure 12. Linear fit of ln(OD600) to t. (a)experiment group prm-anticro-prm-lysis (b)control group croGFP
| Experiment Group | Control Group | |||
| Value | Standard Error | Value | Standard Error | |
| Slope,μm | 1.49914 | 0.08934 | 1.1957 | 0.08237 |
| Linearly Dependent Coefficient | 0.98942 | 0.9859 | ||
Our data shows that μm,exp(experimental group) is even lager than μm, ctrl(control group).Then we can conclude that our circuit is stable in normal conditions. Users need not worry that bacteria may die when nothing is happening.
4. Test our final system: fight against the lambda phage!
Phage enumerations, expressed as plaque forming units (PFU) per milliliter, were performed by the double-layer plaque titration method, which can conform the efficiency of design. During the experiment, all the E.coli strain is DH5α, while the control group and experiment group has different genes. Experimental group contained pRM-anticro-pRM-RBS-lysis-T (pSB1C3) and the control group contained RBS-crogfp-T (pSB1C3) and pRM-RBS-gfp-T (pSB1C3) respectively.

Table 2. Phage enumerations of different group with different concentrations of phage
 Figure13. Phage enumerations of different group with different concentrations of phage Dilution Multiple of phage in A, B, C, D are 0, 10-12, 10-10, 10-8 respectively. Group 1, 2, 3 are pRM-RBS-gfp-T (pSB1C3), RBS-crogfp-T (pSB1C3), pRM-anticro-pRM-RBS-lysis-T (pSB1C3)
This experiment directly proved the utility of our design. As the table2 and figure13, the experimental group didn't have any plaques, which indicates our design has done its job. The bacteria with pRM-RBS-gfp-T showed resistibility which is the same with another experiment. We suspicions it is the promoter pRM that impacts the resistibility to the lambda phage. The following experiments confirmed this idea. We present the following hypothesis to describe the mechanism of pRM promoter defending the phage. The promoter pRM can be both bound by protein CI and Cro, despite the protein CI is more tendentious to bind pRM. In the bacteria, the plasmid with pRM on it has high copy number, which means there are much more pRM than usual situation when the infection occurs. If the phage expresses Cro, the Cro will bind pRM, which lead to the dramatically decreasing concentration of cro. Thus, the phage will retain in Lysogenic period. However, more experiments are needed to test this hypothesis.
5. Research the relationship between the OD600 measured by spectrophotometer and that measured by microplate reader.
We perform the measurement with SpectraMax M5 Multi-Mode Microplate Reader. Although the microplate reader can easily and quickly measure the optical density of the liquid on the ELISA plate, the optical system in the microplate reader doesn’t abide by the Beer–Lambert law. That means the optical density measured by it cannot easily be transformed into that measured by the spectrophotometer. In order to help people use the statistics measured by the microplate reader, we design experiments to research the relationship between the OD600 measured by HITACHI U-5100UV/VIS spectrophotometer and that measured by SpectraMax M5 Multi-Mode Microplate Reader.

Our SpectraMax M5 Multi-Mode Microplate Reader.

Our two HITACHI U-5100UV/VIS spectrophotometers.
We incubate the bacteria in liquid LB media and measure the optical density of the culture both by the SpectraMax M5 Multi-Mode Microplate Reader and the HITACHI U-5100UV/VIS spectrophotometer. Here is our result:

The linear fit of the OD measured by spectrophotometer to that measured by microplate reader.
OD(spectrophotometer) = 2.48875 × OD(microplate reader) + 0.0136
The linearly dependent coefficient is 0.99985, very close to 1. That means the relationship between the OD600 measured by HITACHI U-5100UV/VIS spectrophotometer and that measured by SpectraMax M5 Multi-Mode Microplate Reader is almost linear.