|
|
| Line 399: |
Line 399: |
| | <div id="main"> | | <div id="main"> |
| | <br/> | | <br/> |
| - | <h1>Quantitative model and stability analysis</h1> | + | <h1>Experimental model</h1> |
| | + | |
| | + | <table class="summary"> |
| | + | <tbody class="summary"> |
| | + | <tr class="summary"> |
| | + | <td class="summary"> |
| | + | <p><b>Question:</b> Are we able to somehow take advantage of the experimental measurements obtained |
| | + | from the wet lab? Does that allow us to predict the optimal input ratios of plasmids inserted?</p> |
| | + | <b>Answer:</b> Measurements were exploited in their full potential as we have developed a brand |
| | + | new modeling approach. As it turned out, it well describes the real behavior of the switch. |
| | + | The results predicted bistable behavior for a range of input ratios. The optimal choice resulted |
| | + | to be the <b>p[B]_PMIN_TAL:KRAB</b> (repressors) plasmids being in around three times greater quantity |
| | + | than <b>p[B]_PMIN_TAL:VP16</b> (activators). |
| | + | </td></tr></tbody></table> |
| | + | |
| | | | |
| - | <p>In order to be able to predict the quantitative behavior of <i>in vivo</i> application of the genetic switches, we set up a quantitative model of a Transcription-activator like effector (TAL) based bistable switches. We apply experimental measurements for individual parts and predict their behavior when applied into a single system. The essential characteristics of a switch are <i>responsiveness</i> (reaching a stable state with the introduction of the corresponding inducer), <i>stability</i> (not leaving the state after inducer removal) and <i>robustness</i> (expressing equivalent qualitative behavior under a wide range of conditions). In the following subsections, modeling approaches for individual parts are described.</p>
| |
| | | | |
| - | <p>A variety of well-established models in the literature were examined, which resulted in choosing ordinary differential Hill equations model, presented in (Tigges et al., 2009). The former work presents a tunable synthetic mammalian oscillator, whose model was readjusted to present a switch structure. On top of that, the host choice of mammalian cells and pristinamycin-based inducible system corresponds to our system.</p>
| |
| | | | |
| - | <p>To get a better idea of the functioning of the model, an <font color="red"><b>interactive web application</b></font> was developed and is available <a href="https://2012.igem.org/Team:Slovenia/ModelingInteractiveSimulations">here</a>.</p>
| |
| | | | |
| | <p> | | <p> |
| | <ul style="margin-left:15px;"> | | <ul style="margin-left:15px;"> |
| - | <li><a href="#modeldesc">Model description and parameter determination</a><br/></li> | + | <li><a href="#idea">Idea</a><br/></li> |
| - | <li><a href="#stability">Stability analysis</a><br/></li> | + | <li><a href="#modeldev">Model derivation</a><br/></li> |
| | <li><a href="#results">Results</a><br/></li> | | <li><a href="#results">Results</a><br/></li> |
| - | <li><a href="#model1">Mutual repressor switch model formalization</a><br/></li> | + | <li><a href="#source">Source code</a><br/></li> |
| - | <li><a href="#model2">The positive feedback loop switch model formalization</a><br/></li> | + | <li><a href="#references">References</a><br/></li> |
| | </ul> | | </ul> |
| | </p> | | </p> |
| | | | |
| | | | |
| - | <h2 ><a name="modeldesc">Model description and parameter determination</a></h2>
| |
| | | | |
| - | <h3>TAL:KRAB repressor constructs</h3> | + | <h2 ><a name="idea"></a>Idea</h2> |
| | | | |
| - | <p>For repressor constructs, the percentage of remaining transcription rate comparing to the unrepressed reporter plasmid was measured. Intuitively, the remaining rate was directly proportional to the repressor/reporter ratio but not in a linear fashion. To approximate this relation for <i>TAL:KRAB</i> constructs, the following analytical function was fitted to the measurements:</p>
| + | As we discovered throughout the project, the switch design is very sensible to the |
| | + | masses of the different plasmids (parts) used in the experiment. |
| | + | We thought, why not use the data we obtained for <i>individual constructs</i> and |
| | + | try to predict the switch behavior as they are combined into <i>a single system?</i> |
| | + | Thus, the data obtained from the wet lab was used to characterize each of the |
| | + | plasmid constructs in the positive feedback loop switch. The characterization |
| | + | was made in terms of how their products <i>regulate the transcription of the target genes.</i> |
| | + | That is the way how we connect the experimental work to the theory, as shown in Figure 1. |
| | | | |
| - | <center><img src="https://static.igem.org/mediawiki/2012/5/52/Svn12_qm_1eq_reptransfer.png" style="height:30px; width:auto;"/></center><br/> | + | Figure 1. Steps in connecting the experimental results to theoretical modeling. |
| | + | |
| | + | <h2 ><a name="modeldev"></a>Model derivation</h2> |
| | + | Ordinary differential equations (ODE) model was used as a module to build around. |
| | + | We made use of the two basic relations for transcriptional regulation. |
| | + | The repressor and activator function, defined in (Alon, 2006), modify |
| | + | the basal transcription rate as follows: |
| | | | |
| - | <p>where <i>x</i> is repressor/reporter plasmid ratio and <i>a, b, c</i> are parameters subject to least square error fitting. This produced decreasing function for remaining transcription rate <i>q</i>, depicted in Figure 1a. The achieved percentage of remaining transcription rate <i>q</i> was directly employed in repressed promoter rate equation. The dynamics were modeled using Hill equations for repression and activation (Alon, 2007). For example, the effect of a repressor on transcription rate is modeled as a factor in a rate equation:</p>
| |
| | | | |
| - | <center><img src="https://static.igem.org/mediawiki/2012/2/24/Svn12_qm_2eq_rep.png" style="height:50px; width:auto;"/></center><br/> | + | Since precisely defining transcription rates was not the primary goal of our project, |
| | + | their <i>absolute values</i> are not of central importance in the model. Rather, we focus on |
| | + | the <i>relative changes</i> in transcription levels, caused by activators and repressors. |
| | + | Furthermore, concentration levels of reporters will also be presented <i>relative to each other</i>. |
| | + | This way, we avoid the use of <i>any units we did not measure</i>. |
| | | | |
| | + | <h3> Promoters </h3> |
| | + | As we use two different kinds of promoters, PCMV and PMIN, to account for the difference in |
| | + | <i>basal transcription rates</i>. Experiments have shown that relative luciferase units under |
| | + | PCMV promoter are 1000-fold greater than under PMIN (data not shown). Hence, PCMV |
| | + | is assumed to have a 1000 times greater basal transcription rate than PMIN. |
| | | | |
| - | <p>Intuitively, the unrepressed transcription rate <i>r</i> is inversely proportional to the concentration of TAL-A:KRAB protein with non-linearity coefficient <i>n</i>. The remaining rate percentage <i>q</i> was used to determine the <i>s</i> constant, which determines the concentration at which half of the unrepressed rate is reached, after the concentration threshold <i>t</i> is crossed.</p> | + | <h3> Transcriptional regulators </h3> |
| | | | |
| | + | To characterize activators, <b>pPCMV_TALA:VP16</b> and <b>p[A]_PMIN_fLuc</b> plasmids were tested. Various ratios of input masses produced different levels of luciferase activity (Figure). |
| | + | Following equation (1), activators increase the transcription rate up to some maximum factor of |
| | + | <i>fold induction</i>. The former is derived by comparing the resulting luciferase activity with that |
| | + | of the <i>inactivated</i> <b>p[A]_PMIN_fLuc</b>. Gathering data for various input ratios, we fitted it to an |
| | + | analytical function (Figure 2), enabling us to predict the fold induction (A) for <i>arbitrary</i> input |
| | + | ratios of DNA for the two plasmids. |
| | + | Intuitively, more activator plasmids <i>increase</i> the maximum fold induction. On the other hand, |
| | + | more target plasmids <i>decrease it</i>. Relatively speaking, activator proteins thus have more plasmids |
| | + | to target. That leads to fold activation ratio being smaller from the <i>global point of view</i>. |
| | + | In an analogue manner <b>TAL-B:VP16</b> constructs were characterized. |
| | + | |
| | + | |
| | + | Figure 3. |
| | + | Fold induction rates, derived from relative luciferase activity for various ratios of |
| | + | <b>pPCMV_TALA:VP16</b> (activator) and <b>p[A]_PMIN_fLuc</b> (target) plasmids. |
| | | | |
| | + | Figure 4. |
| | + | Plot of fold induction function for a continuous range of activator (<i>m</i>) and reporter (<i>n</i>) |
| | + | plasmid ratios, <i>f(m/n) = a * (m/n)**1/b</i>, where <i>a</i> and <i>b</i> are parameters subject to least square |
| | + | error fitting. |
| | + | |
| | + | |
| | + | <h3> Repressors </h3> |
| | + | To characterize repressors, <b>pPCMV_TALA:KRAB </b> and <b>p[A]_PCMV_fLuc</b> plasmids were tested. |
| | + | Various ratios of input masses produced different levels of luciferase activity. |
| | + | Following equation (1), repressors <i>decrease</i> the basal transcription rate down to |
| | + | some minimum factor of <i>fold repression</i>. The former is derived by comparing the luciferase |
| | + | activity with that of the <i>unrepressed</i> <b>p[A]_PCMV_fLuc</b>, resulting in percentage of remaining |
| | + | transcription intensity. Gathering data for various input ratios (Figure 6), we fitted it to |
| | + | an analytical function (Figure 7). It enables us to predict the fold repression (Q) for arbitrary |
| | + | input rations of DNA. |
| | + | Intuitively, more repressor plasmids <i>increase</i> the maximum fold induction. |
| | + | On the other hand, more target plasmids <i>decrease it</i>. Relatively speaking, |
| | + | repressor proteins thus have more plasmids to target. That leads to fold repression ratio |
| | + | being smaller from the <i>global point of view</i>. |
| | + | In an analogue manner <b>TAL-B:KRAB</b> constructs were characterized. |
| | | | |
| - | <h3>TAL:VP16 activator constructs </h3>
| + | Figure 6. |
| | + | Fold repression rates, derived from relative luciferase activity for various ratios of |
| | + | pPCMV_TALA:KRAB (repressor) and p[A]_PCMV_fLuc (target) plasmids. |
| | | | |
| - | <p>Using a similar approach to that described above, we fitted the data achieved for activator constructs TAL-A:VP16 and <i>TAL-B:VP16</i>. As expected, the transcription rate increased proportionally with increasing activator/reporter ratio of plasmids transfected, again in a non-linear fashion. To approximate the behavior, the following increasing function was fitted:</p>
| + | Figure 7. |
| | + | Plot of fold induction function for a continuous range of activator (m) |
| | + | and reporter (n) plasmid ratios, f(m/n) = a *(e**b*(m/n))+c, where a, b and c are parameters subject to least square error fitting. |
| | + | |
| | + | <h3> Induction system </h3> |
| | + | To characterize the erythromycin repressor induction system we measured relative luciferase |
| | + | activity for various ratios of <b>pPCMV_E:KRAB</b> (inducible protein), <b>pPCMV_[ETR]_TALA:KRAB</b> (repressor) |
| | + | and <b>p[A]_PCMV_fLuc </b> (target) plasmids (Figure). |
| | + | As E:KRAB gets stimulated by erythromycin, it unbinds from the [etr] binding site, |
| | + | allowing the production of <b>TALA:KRAB</b>, which in turn represses the transcription of fLuc. |
| | + | By varying the ratios of the three input plasmids, we can observe the resulting difference in |
| | + | luciferase activity. That directly determines the fold repression of the inducible system <i>as a |
| | + | whole</i>. |
| | + | As inducible protein plasmids <i>increase</i> the luciferase activity <i>increases</i> as well. |
| | + | The increasing masses of repressor and target plasmids both <i>decrease</i> the luciferase activity |
| | + | and consequently <i>decrease</i> the fold repression rate. |
| | + | In an analogue manner erithromycin activator, pristinamycin repressor and |
| | + | pristinamycin activator induction systems were characterized. |
| | + | |
| | + | <h3> Noise </h3> |
| | + | Due to the noise in experimental measurements, we can directly apply it in the model as well. |
| | + | When determining fold repression ratios, <i>standard deviations</i> of up to 15 % were observed. |
| | + | |
| | + | <h2 ><a name="results"></a>Results</h2> |
| | | | |
| - | <center><img src="https://static.igem.org/mediawiki/2012/f/f6/Svn12_qm_3aeq_reptransfer3aeq_acttransfer.png" style="height:30px; width:auto;"/></center><br/> | + | <table> |
| | | | |
| - | <p>where <i>x</i> is activator/reporter plasmid radio and <i>c, b</i> are parameters subject to least square error fitting. The plot of the function is shown in Figure 1b. The factor of activation <i>a</i> is again directly employed as a rate equation factor for activated promoter:</p> | + | <tr> |
| - | | + | <td valign="top"> |
| - | <center><img src="https://static.igem.org/mediawiki/2012/3/36/Svn12_qm_3eq_act.png" style="height:50px; width:auto;"/></center><br/> | + | |
| - | | + | |
| - | where the increasing concentration of TAL-B:VP16 protein reaches half the maximum activation rate <i>a</i> when crossing the concentration threshold <i>t</i>, with non-linearity exponent <i>n</i>.
| + | |
| - |
| + | |
| - | <center>
| + | |
| | <table> | | <table> |
| - | <tr> | + | <th><tr><td style="background: #0099FF;"><b><font color="white">The Switch (top level)</font></b></td><td></td></tr></th> |
| - | <td><center><img src="https://static.igem.org/mediawiki/2012/4/4b/Svn12_qm_4tal_krab_eff_curve_3.png" style="height:300px; width:auto;"/></center><br/></td> | + | <th> |
| - | <td><center><img src="https://static.igem.org/mediawiki/2012/e/e9/Svn12_qm_5tal_vp16_eff_curve_3.png" style="height:300px; width:auto;"/></center><br/></td> | + | <tr><td>Plasmid</td><td>Index</td></tr> |
| - | </tr> | + | </th> |
| | + | <tr><td><img align="left" src="https://static.igem.org/mediawiki/2012/0/09/Svn12_qm_interactive_p0.png" width="300px"/></td><td><font style="font-family:Times New Roman;">p0</font></td></tr> |
| | + | <tr><td><img align="left" src="https://static.igem.org/mediawiki/2012/2/28/Svn12_qm_interactive_p1.png" width="200px"/></td><td><font style="font-family:Times New Roman;">p1</font></td></tr> |
| | + | <tr><td><img align="left" src="https://static.igem.org/mediawiki/2012/f/f0/Svn12_qm_interactive_p2.png" width="300px"/></td><td><font style="font-family:Times New Roman;">p2</font></td></tr> |
| | + | <tr><td><img align="left" src="https://static.igem.org/mediawiki/2012/7/70/Svn12_qm_interactive_p3.png" width="200px"/></td><td><font style="font-family:Times New Roman;">p3</font></td></tr> |
| | + | <tr><td></td><td></td></tr> |
| | </table> | | </table> |
| - | </center>
| |
| - |
| |
| - |
| |
| - | <b>Figure 1</b>. Functions fitted to experimental data for repressor and activator constructs. (a) Data measured for TAL-A:KRAB (blue) and TAL-B:KRAB (red) constructs and averaged afterwards (black). (b) Data measured for TAL-A:VP16 (blue) and TAL-B:VP16 (red) constructs and averaged afterwards (black).
| |
| - |
| |
| - | <br />
| |
| - | <br />
| |
| - |
| |
| - |
| |
| - |
| |
| - | <h3>Inducible system</h3>
| |
| - |
| |
| - | <p>The inducible system in both switches is built upon two different inducer molecules. In the mutual repressor switch, we employ a <i>pristinamycin-inducible protein (PIP) with KRAB repressor domain</i>. After the introduction of <i>pristinamycin</i>, PIP:KRAB is inactivated and thus unbound from its binding site at the pCMV promoter. The concentration of active PIP:KRAB is hence inversely proportional to the pristinamycin concentration:</p>
| |
| - |
| |
| - | <center><img src="https://static.igem.org/mediawiki/2012/d/df/Svn12_qm_6eq_pip.png" style="height:50px; width:auto;"/></center><br/>
| |
| - |
| |
| - | <p>Consequently, the transcription rate of the corresponding promoter is proportional to the concentration of active PIP:KRAB :</p>
| |
| - |
| |
| - | <center><img src="https://static.igem.org/mediawiki/2012/7/7c/Svn12_qm_7eq_rpip.png" style="height:50px; width:auto;"/></center><br/>
| |
| - |
| |
| - | <p>where k is the maximum transcription rate, f scaling factor and alpha the fraction of inactivated transcription rate. The increasing concentration of active PIP:KRAB causes the resulting rate r to approach the basal rate, with half the maximum rate concentration determined by the threshold K. In an analogue manner, the erythromycin and E:KRAB inducer system was modeled.</p>
| |
| - |
| |
| - |
| |
| - |
| |
| - |
| |
| - | <h2 ><a name="stability">Stability analysis</a></h2>
| |
| - |
| |
| - | <p>For the purpose of stability analysis, the simulation was run multiple times with varying pairs of parameters and producing a two dimensional <i>parameter map</i>. For example, with varying plasmid input dosages (other things being equal), one or the other state might become not reachable. For an illustrative example, see Figure 2.</p>
| |
| - |
| |
| - | <p>For every instance of the simulation (a colored point in Figure 2), the outcome results were examined. During the course of a simulation, a steady state is defined as a point in phase space (all possible pairs of the two reporter concentrations) where concentrations of <i>both reporter protein concentrations do not change</i>, i.e.:</p>
| |
| - |
| |
| - | <center><img src="https://static.igem.org/mediawiki/2012/d/d5/Svn12_qm_9eq_dnep.png" style="height:50px; width:auto;"/></center><br/>
| |
| - |
| |
| - | <center><img src="https://static.igem.org/mediawiki/2012/4/4a/Svn12_qm_10eq_MCt.png" style="height:50px; width:auto;"/></center><br/>
| |
| - |
| |
| - |
| |
| - | <p>
| |
| - |
| |
| - |
| |
| - | <!-- figure 2 -->
| |
| - | <table class="inliner" style="width:60%;">
| |
| - | <tbody class="inliner">
| |
| - | <tr class="inliner"><td class="inliner"><img src="https://static.igem.org/mediawiki/2012/e/e4/Svn12_qm_11beef_bsym_01.png" width="70%"/></td></tr>
| |
| - | <tr class="inliner"><td class="inliner"><b>Figure 2.</b> Parameter map of non-stimulated system (no inducer introduction) for parameters: [A]_pCMV_TAL-B:KRAB_NEPTUN dosage (x-axis) and [B]_pCMV_TAL-A:KRAB-mCitrine dosage (y-axis), on the interval 100-500 ng. Notice the red ambiguous states where both parameter values are equal.</tr>
| |
| - | </tbody>
| |
| - | </table>
| |
| - | <!-- end figure 2 -->
| |
| - |
| |
| - |
| |
| - |
| |
| - | <div style="text-align:justify;">
| |
| - | The list of steady state points is achieved and analyzed for each instance of a simulation. A <i>valid state A</i> is defined when BFP concentration crosses a predefined threshold <i>th</i> while at the same time the mCitrine concentration is below <i>th</i>. <i>Valid state B</i> is defined analogously for mCitrine. If both stable states are reached during a simulation instance run, the system is labeled bistable.</p>
| |
| - |
| |
| - | <p>If at any stable state points, both concentrations cross the threshold simultaneously or remain below threshold simultaneously, the state point and the system are defined ambiguous. In case no stable state points are found during the simulation, the system is labeled as not valid.</p>
| |
| - |
| |
| - | </div>
| |
| - | <div style="clear:both;"></div>
| |
| - |
| |
| - | <table class="summary" >
| |
| - | <tr class="summary">
| |
| - | <td class="summary">
| |
| - | <p>Summing up, five possible outcomes for each simulation instance were defined and placed on the parameter map (using separate colors to differentiate between them):</p>
| |
| - | <ul style="padding-left:30px;">
| |
| - | <li><font style="color:green;"><b>Bistable</b></font>; The system reached both stable states on a given time interval.</li>
| |
| - | <li><font style="color:blue;"><b>Monostable A;</b></font> The system reached expressed stable state A on a given time interval.</li>
| |
| - | <li><font style="color:yellow;"><b>Monostable B;</b></font> The system only reached stable state B on a given time interval.</li>
| |
| - | <li><font style="color:red;"><b>Ambigous;</b></font> The system expressed reached states simultaneously during a given time interval.</li>
| |
| - | <li><font style="color:black;"><b>Not valid</b></font>; The system did not reach any stable states during a given time interval.</li>
| |
| - | </ul>
| |
| | </td> | | </td> |
| - | </tr>
| |
| - | </table>
| |
| | | | |
| - | | + | <td valign="top"> |
| - | | + | <table> |
| - | <h2><a name="results">Results</a></h2> | + | <th><tr><td style="background: #0099FF;"><b><font color="white">Inducible system (middle level)</font></b></td><td></td></tr></th> |
| - | | + | <th> |
| - | | + | <tr><td>Plasmid</td><td>Index</td></tr> |
| - | <h3>Summary </h3> | + | </th> |
| - | <br /> | + | <tr><td><img align="left" src="https://static.igem.org/mediawiki/2012/c/cf/Svn12_qm_interactive_p4.png" width="200px"/><td><font style="font-family:Times New Roman;">p4</font></td></tr> |
| - | | + | <tr><td><img align="left" src="https://static.igem.org/mediawiki/2012/f/f7/Svn12_qm_interactive_p5.png" width="200px"/><td><font style="font-family:Times New Roman;">p5</font></td></tr> |
| - | <p>The two switches were tested and compared in various aspects. | + | <tr><td><img align="left" src="https://static.igem.org/mediawiki/2012/9/96/Svn12_qm_interactive_p6.png" width="200px"/><td><font style="font-family:Times New Roman;">p6</font></td></tr> |
| - | Based on intuition and simulations described in previous sections we predicted better behavior of the switch with a positive feedback loop in
| + | <tr><td><img align="left" src="https://static.igem.org/mediawiki/2012/9/9f/Svn12_qm_interactive_p7.png" width="200px"/><td><font style="font-family:Times New Roman;">p7</font></td></tr> |
| - | terms of <i>stability, robustness, and responsiveness</i>. <p></p>
| + | <tr><td></td><td></td></tr> |
| - | <p>The addition of a positive feedback loop contributed strongly to stability, | + | </table> |
| - | producing <b>two orders of magnitude higher concentrations</b> of stable state. Consequently, the minimal time an inducer had to be present
| + | |
| - | to perform a successful state transition was <b>twice as long</b>,
| + | |
| - | hence having slower responsiveness. Also, the time required to perform the transition increased <b>by 25 %</b>,
| + | |
| - | due to higher stable concentration levels.</p>
| + | |
| - | <p>The second switch proved more robust and exhibited the absence of concentration fluctuations at the inducer removal. | + | |
| - | The initial state of the mutual repressor switch was <b>heavily influenced by the initial plasmid dosage</b>.
| + | |
| - | The former also contributed to the overall stability, since the dosage of plasmid with TAL-A:KRAB constructs should not exceed that
| + | |
| - | of TAL-B:KRAB constructs by more than <b>1.5-fold</b> and vice versa. In the case of positive feedback loop switch, that same threshold was <b>2-fold</b>.</p>
| + | |
| - | <p>We also tested the system properties under various non-linearity coefficients. | + | |
| - | Mutual repressor switch has been proven of being dependent on non-linearity of repressor constructs, requiring a non-linearity coefficient of
| + | |
| - | <b>at least 2</b>,
| + | |
| - | while this was not the case with positive feedback loop switch which has shown bistable behavior under all non-linearity coefficients
| + | |
| - | <b>greater of equal to 1</b>. The last fact is in agreement with the previous mathematical predictions of a feedback loop being able to replace the non-linearity as a necessary condition for bistability.</p>
| + | |
| - | | + | |
| - | <h3>Fold repression and fold induction inference</h3> | + | |
| - | <br /> | + | |
| - | <p>We have quantified the effect of TAL effector constructs by performing the luciferase reporter activity measurements with varying ratios of TAL effector and reporter constructs. To account for all input ratios, we fitted the data to a continuous function. Due to variations in the experiments, we took two representative measurement samples for activator and repressor constructs and averaged the resulting continuous functions afterwards. The particular data measurements were taken prior to further experiments with more complex constructs. The model outcome thus helped in predicting the optimal input mass ratios of the final switch constructs. </p> | + | |
| - | | + | |
| - | | + | |
| - | <!-- figure 3 --> | + | |
| - | <table class="invisible" style="width:90%;"> | + | |
| - | <tbody class="invisible">
| + | |
| - | <tr class="invisible"> | + | |
| - | <td class="invisible"> | + | |
| - | <img class="invisible" src="https://static.igem.org/mediawiki/2012/4/42/Svn12_qm_3_grafi-13.png"/><br/> | + | |
| | </td> | | </td> |
| - | </tr>
| |
| - | </tbody>
| |
| - | </table>
| |
| - | <table class="invisible" style="width:100%; text-align:center;">
| |
| - | <tbody class="invisible">
| |
| - | <tr class="normal"><td class="invisible">
| |
| - | <b>Figure 3. </b> Luciferase reporter activity fold repression measurement under various ratios of TAL:KRAB repressor and reporter constructs. The values are normalized to reporter activity in absence of repressor
| |
| - | </td></tr>
| |
| - | </tbody>
| |
| - | </table>
| |
| - | <!-- end table-->
| |
| | | | |
| - | | + | <td valign="top"> |
| - | | + | <table> |
| - | <p>Figure 3 shows the luciferase reporter activity measurement under various ratios of TAL:KRAB repressor and reporter constructs. With increasing the input mass of repressor constructs, the resulting luciferase activity converges towards 8.5 % (TAL-A:KRAB) and 1.5 % (TAL-B:KRAB) of the unrepressed reporter activity. Thus, we can describe TAL-A:KRAB effect on the system with the following function:</p> | + | |
| - | <center><img src="https://static.igem.org/mediawiki/2012/3/31/Svn12_qm_0eq_aKRAB.png" style="height:30px; width:auto;"/></center><br/> | + | <th><tr><td style="background: #0099FF;"><b><font color="white">Inducible proteins (bottom level)</font></b></td><td></td></tr></th> |
| - | <p>while for TAL-B:KRAB we get:<p> | + | <th> |
| - | <center><img src="https://static.igem.org/mediawiki/2012/6/67/Svn12_qm_0eq_bKRAB.png" style="height:30px; width:auto;"/></center><br/> | + | <tr><td>Plasmid</td><td>Index</td></tr> |
| - | <p>where <i>x</i> is repressor/reporter construct ratio and <i>q</i> accounts for remaining transcription rate (fold repression). The function is plotted in Figure 1a.</p>
| + | </th> |
| - | | + | <tr><td><img align="left" src="https://static.igem.org/mediawiki/2012/6/6a/Svn12_qm_interactive_p8.png" width="200px"/><td><font style="font-family:Times New Roman;">p8</font></td></tr> |
| - | | + | <tr><td><img align="left" src="https://static.igem.org/mediawiki/2012/b/b1/Svn12_qm_interactive_p9.png" width="200px"/><td><font style="font-family:Times New Roman;">p9</font></td></tr> |
| - | <!-- figure 4 -->
| + | |
| - | <table class="invisible" style="width:90%;">
| + | |
| - | <tbody class="invisible">
| + | |
| - | <tr class="invisible"> | + | |
| - | <td class="invisible"> | + | |
| - | <img class="invisible" src="https://static.igem.org/mediawiki/2012/0/0b/Svn12_qm_4_grafi-14.png"/><br/> | + | |
| - | </td> | + | |
| - | </tr> | + | |
| - | </tbody> | + | |
| | </table> | | </table> |
| - | <table class="invisible" style="width:100%; text-align:center;">
| |
| - | <tbody class="invisible">
| |
| - | <tr class="normal"><td class="invisible">
| |
| - | <b>Figure 4. </b>Luciferase reporter activity fold induction measurement under various ratios of TAL:VP16 activator and reporter constructs. The values are normalized to reporter activity in absence of activator constructs (leftmost bar) and are directly proportional to the increasing repressor/reporter ratio. (a) TAL-A:VP16 activator; (b) TAL-B:VP16 activator;
| |
| - | </td></tr>
| |
| - | </tbody>
| |
| - | </table>
| |
| - | <!-- end table-->
| |
| - |
| |
| - |
| |
| - | <p>Figure 4 shows the luciferase reporter activity measurement under various ratios of TAL:VP16 activator and reporter constructs. With increasing the input mass of repressor constructs, the resulting luciferase activity converges towards 2000-fold (TAL-A:VP16) and 1800-fold (TAL-B:KRAB) increased reporter activity. Thus, we can describe TAL-A:VP16 effect on the system with the following function:</p>
| |
| - | <center><img src="https://static.igem.org/mediawiki/2012/e/e3/Svn12_qm_5_eq_aVP16.png" style="height:30px; width:auto;"/></center><br/>
| |
| - | <p>while for TAL-B:VP16 we get:</p>
| |
| - | <center><img src="https://static.igem.org/mediawiki/2012/2/29/Svn12_qm_6_eq_bVP16.png" style="height:30px; width:auto;"/></center><br/>
| |
| - | <p>where <i>x</i> is activator/reporter construct ratio and a accounts for factor of increased transcription rate (fold induction). The function is plotted in Figure 1b.</p>
| |
| - | <br />
| |
| - |
| |
| - |
| |
| - | <h3>Results: Mutual repressor switch</h3>
| |
| - | <br />
| |
| - | <p>To evaluate the performance of the switch, we ran a simulation for a sufficiently long time that the system can reach both steady states (Figures 5,6). The introduction of inducer pristinamycin and erithromycin switched the system to produce reporters BFP or mCitrinee state respectively (Figure 5ab). Upon introduction of the inducer, a peak in the corresponding reporter concentration arises. After the inducer removal, the reporter and TAL:KRAB concentration (Figure 5c) decrease to some degree, the reason being the reduced activity of the corresponding inducible promoter. The resulting concentration remains sufficiently high to repress the opposing state and for the system to remain in the desired state after the inducer signal. Peak concentrations at steady states for reporters were of the order of 800 nM. Time to switch from on state to another was around 2000 min. In both states, the system stabilized well above the define threshold (Figure 5d).</p>
| |
| - |
| |
| - |
| |
| - | <!-- figure 5 -->
| |
| - | <table class="invisible" style="width:90%;">
| |
| - | <tbody class="invisible">
| |
| - | <tr class="invisible">
| |
| - | <td class="invisible">
| |
| - | <img class="invisible" src="https://static.igem.org/mediawiki/2012/8/8e/Svn12_qm_8_reporter12.png"/>
| |
| | </td> | | </td> |
| - | <td class="invisible">
| + | </tr> |
| - | <img class="invisible" src="https://static.igem.org/mediawiki/2012/4/42/Svn12_qm_9_inducer12.png"/>
| + | |
| - | </td>
| + | |
| - | </tr> | + | |
| - | <tr class="invisible">
| + | |
| - | <td class="invisible">
| + | |
| - | <img class="invisible" src="https://static.igem.org/mediawiki/2012/c/ca/Svn12_qm_10_krab12.png"/>
| + | |
| - | </td>
| + | |
| - | <td class="invisible">
| + | |
| - | <img class="invisible"src="https://static.igem.org/mediawiki/2012/5/59/Svn12_qm_11_phase12.png"/>
| + | |
| - | </td>
| + | |
| - | </tr>
| + | |
| - | </tbody>
| + | |
| | </table> | | </table> |
| - | <table class="invisible" style="width:100%; text-align:center;">
| + | Figure. The switch system level partitioning. |
| - | <tbody class="invisible">
| + | |
| - | <tr class="normal"><td class="invisible">
| + | |
| - | <b>Figure 5. </b>Simulation of a bistable switch for t = 7000 min and non-linearity coefficient n = 3, showing a single state transition from BFP to mCitrine. (a) Concentrations of the reporters. (b) Concentrations of the inducers and active inducible proteins. (b) Concentrations of TAL-B:KRAB and TAL-A:KRAB proteins. (d) Phase space of the system with marked state thresholds.
| + | |
| - | </td></tr>
| + | |
| - | </tbody>
| + | |
| - | </table>
| + | |
| - | <!-- end table-->
| + | |
| - | <!-- figure 6 -->
| + | |
| - | <table class="invisible" style="width:90%;">
| + | |
| - | <tbody class="invisible">
| + | |
| - | <tr class="invisible">
| + | |
| - | <td class="invisible">
| + | |
| - | <img class="invisible" src="https://static.igem.org/mediawiki/2012/d/d3/Svn12_qm_12_reporter21.png"/><br/>
| + | |
| - | </td>
| + | |
| - | <td class="invisible">
| + | |
| - | <img class="invisible" src="https://static.igem.org/mediawiki/2012/1/19/Svn12_qm_15_inducer21.png"/><br/>
| + | |
| - | </td>
| + | |
| - | </tr>
| + | |
| - | <tr class="invisible">
| + | |
| - | <td class="invisible">
| + | |
| - | <img class="invisible"src="https://static.igem.org/mediawiki/2012/3/30/Svn12_qm_14_krab21.png"/><br/>
| + | |
| - | </td>
| + | |
| - | <td class="invisible">
| + | |
| - | <img class="invisible" src="https://static.igem.org/mediawiki/2012/3/3e/Svn12_qm_13_phase21.png"/><br/>
| + | |
| - | </td>
| + | |
| - | </tr>
| + | |
| - | </tbody>
| + | |
| - | </table>
| + | |
| - | <table class="invisible" style="width:100%; text-align:center;">
| + | |
| - | <tbody class="invisible">
| + | |
| - | <tr class="normal"><td class="invisible">
| + | |
| - | <b>Figure 6. </b>Simulation of a bistable switch for t = 7000 min and non-linearity coefficient of n = 3, showing a single state transition from mCitrine to BFP. (a) Concentrations of the reporters. (b) Concentrations of the inducers and active inducible proteins. (b) Concentrations of TAL-B:KRAB and TAL-A:KRAB proteins. (d) Phase space of the system with marked state thresholds.
| + | |
| - | </td></tr>
| + | |
| - | </tbody>
| + | |
| - | </table>
| + | |
| - | <!-- end table-->
| + | |
| | | | |
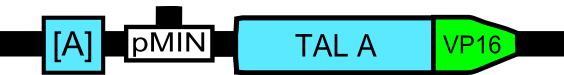
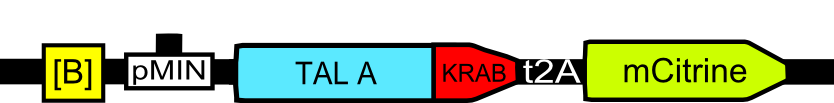
| | + | The main goal of this particular model was to help determine the input ratios for plasmids |
| | + | that make up the switch system. The first confirmation was that if the masses of all |
| | + | plasmids will be equal, the switch will not be able to exhibit bistable behavior. |
| | + | We partition the whole system into levels (Figure), with the Switch being the top level |
| | + | and the Pristinamycin/Erithromycin inducible proteins the bottom level. It is obvious that |
| | + | a plasmid on a given level influences another level only in the direction bottom -> top, |
| | + | so as we go downwards, the masses shall increase to have more influence on the targeted |
| | + | upper level. Hence the relation:<br/><br/> |
| | + | <center><font style="font-family:Times New Roman;">p0, p1, p2, p3 < p4, p5, p6, p7 < p8, p9</font></center><br/> |
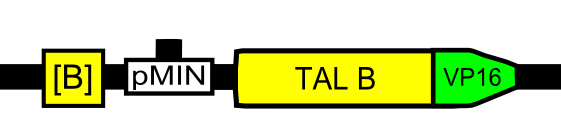
| | + | Next, the ratio between repressor and activator constructs was examined. To preserve symmetry, |
| | + | we assume: <br/><br/> |
| | + | <center><font style="font-family:Times New Roman;">p0 = p2, p1 = p3, p4 = p6, p5 = p7, p8 = p9</font> </center><br/> |
| | + | All the following ratios will be given in the form p0 : p1 (repressor:activator). |
| | + | Testing began at the 1:1 ratio, and we gradually increased both the repressor and activator to observe the qualitative behavioral change. The Switch exhibited bistable behavior for all ratios between 10:1 until 1:5, as can be seen in Scroll Box 1. |
| | | | |
| - | | + | <table class="invisible"><tr class="invisible"><td class="invisible"> |
| - | <h3>Stability analysis: Mutual repressor switch</h3>
| + | <img src="C:\Users\Strazkosan\Dropbox\igem-cellulator\Wiki\img\svn_12_qm_results-04.png"></img> |
| - | <br />
| + | |
| - | <p>Stability analysis revealed more characteristics of the switch, (color encoding is described in detail in Methods_modeling). Without introduction of an inducer within a given time interval it is not determined by design in which state the system will end up. Various input ratios of plasmids containing TAL-A:KRAB and TAL-B:KRAB constructs were evaluated. Equal input masses for both plasmids resulted in ambiguous states as expected with even a 0.5 % difference being enough to put the system into the corresponding state (Figure 7a).</p>
| + | |
| - | <p>State transition properties were characterized in terms of duration and time difference in the introduction of the two inducers (Figure 7cd). The parameters were chosen so that the system exhibits one state transition in a time interval of 8000 minutes with the first inducer introduced at t1=0, for a d1=500 minutes duration. The second inducer was introduced at all points on time interval t2 = [1000, 5000] minutes, while the inducer duration was on the interval d2 = [0, 500] minutes. The results show a required delay of at least 3000 minutes before the second inducer could be introduced so that the first reporter reaches a stable state.</p>
| + | |
| - | <p>The minimal required duration for inducer presence to switch from BFP to mCitrine state or vice versa was 109 minutes. With the signal of that duration, 3950 minutes were required to perform a complete switch. The maximum tested inducer presence duration of 500 minutes required 3136 minutes for the state transition. The longer transition time than at the beginning of the simulation is due to the fact that the transition is performed between two active states of high concentrations, rather than from both concentrations being low.</p>
| + | |
| - | <p>Furthermore, to ensure the proper functionality of the switch, rapid introduction of an inducer is required, since large difference in input masses can result in the system not being able to switch between the states. In particular, to perform a successful mCitrine to BFP transition, the dosage of constructs containing TAL-A:KRAB should not exceed that of constructs containing TAL-B:KRAB by more than 192 %. On the other hand, the dosage of constructs containing TAL-B:KRAB should not exceed that of constructs containing TAL-A:KRAB by more than 241 %. In the opposite direction, to perform a successful BFP to mCitrine transition, the dosage of constructs containing TAL-A:KRAB should not exceed that of constructs containing TAL-B:KRAB by more than 162%. On the other hand, the dosage of constructs containing TAL-B:KRAB should not exceed that of constructs containing TAL-A:KRAB by more than 222.9%. Summing up, it is safe to say that the switch will perform successfully if no plasmid dosage exceeds the dosage of the opposite construct by more than 150 %. Also, to perform a complete switch, the dosage of Pristinamycin/Erithromicyn inducible constructs shall not be less that 25% of the dosage of reporter plasmids (Figure 7gh). </p>
| + | |
| - | <p>Various sources examined non-linearity as a condition for bistability (Chatterjee et. al 2008, Malphettes et al. 2006). The interval [1.0,5.0] of Hill coefficient for TAL-B:KRAB and TAL-A:KRAB proteins was examined (Figure 7b). Bistability was achieved for coefficients greater than 2 for both transcription factors.</p>
| + | |
| - | | + | |
| - | | + | |
| - | | + | |
| - | <!-- figure 6 -->
| + | |
| - | <table class="invisible" style="width:90%;"> | + | |
| - | <tbody class="invisible">
| + | |
| - | <tr class="invisible"> | + | |
| - | <td class="invisible"> | + | |
| - | <img class="invisible" src="https://static.igem.org/mediawiki/2012/e/e4/Svn12_qm_11beef_bsym_01.png"/><br/> | + | |
| | </td> | | </td> |
| | <td class="invisible"> | | <td class="invisible"> |
| - | <img class="invisible" src="https://static.igem.org/mediawiki/2012/1/1e/Svn12_qm_21_beef_bsym_07.png"/><br/> | + | <img src="C:\Users\Strazkosan\Dropbox\igem-cellulator\Wiki\img\svn_12_qm_results-03.png"></img> |
| - | </td> | + | <div style="height:380px;width:900px;border:1px solid #ccc;font:16px/26px Georgia, Garamond, Serif;overflow:auto;"> |
| - | </tr>
| + | <img src="C:\Users\Strazkosan\Dropbox\igem-cellulator\Wiki\img\svn_12_qm_results-01.png"></img> |
| - | <tr class="invisible">
| + | </div> |
| - | <td class="invisible">
| + | <img src="C:\Users\Strazkosan\Dropbox\igem-cellulator\Wiki\img\svn_12_qm_results-02.png"></img> |
| - | <img class="invisible" src="https://static.igem.org/mediawiki/2012/1/1a/Svn12_qm_17_beef_bsym_02.png"/><br/>
| + | </td></tr></table> |
| - | </td>
| + | <b>Scroll Box 1. </b> Results for valid range of activator:repressor plasmid ratios. |
| - | <td class="invisible">
| + | |
| - | <img class="invisible" src="https://static.igem.org/mediawiki/2012/a/ac/Svn12_qm_18_beef_bsym_03.png"/><br/> | + | |
| - | </td>
| + | |
| - | </tr>
| + | |
| - | <tr class="invisible">
| + | |
| - | <td class="invisible">
| + | |
| - | <img class="invisible" src="https://static.igem.org/mediawiki/2012/1/19/Svn12_qm_20_beef_bsym_05.png"/><br/>
| + | |
| - | </td> | + | |
| - | <td class="invisible">
| + | |
| - | <img class="invisible" src="https://static.igem.org/mediawiki/2012/4/4b/Svn12_qm_19_beef_bsym_04.png"/><br/> | + | |
| - | </td>
| + | |
| - | </tr>
| + | |
| - | <tr class="invisible">
| + | |
| - | <td class="invisible">
| + | |
| - | <img class="invisible" src="https://static.igem.org/mediawiki/2012/5/53/Svn12_qm_22_bsym_04i.png"/><br/>
| + | |
| - | </td>
| + | |
| - | <td class="invisible">
| + | |
| - | <img class="invisible" src="https://static.igem.org/mediawiki/2012/4/41/Svn12_qm_23_bsym_05i.png"/><br/>
| + | |
| - | </td> | + | |
| - | </tr> | + | |
| - | </tbody>
| + | |
| - | </table> | + | |
| - | <table class="invisible" style="width:100%; text-align:center;">
| + | |
| - | <tbody class="invisible">
| + | |
| - | <tr class="normal"><td class="invisible">
| + | |
| - | <b>Figure 7. </b> Parameter maps for the mutual repressor switch. (a) Unstimulated system. Initial state depending on the plasmid dosage of constructs containing TAL-B:KRAB (x-axis) and TAL-A:KRAB (y-axis). (b) Ability to reach both states depending on Hill's coefficient for TAL-B:KRAB (x-axis) and TAL-A:KRAB (y-axis). (c) State transition from BFP to mCitrine, depending on erithromycin input time (x-axis) and duration (y-axis). (d) State transition from mCitrine to BFP, depending on pristinamycin input time (x-axis) and duration (y-axis). (e) Ability to perform a state transition from BFP to mCitrine, depending on plasmid dosage of constructs containing TAL-B:KRAB (x-axis) and TAL-A:KRAB (y-axis). (f) Ability to perform a state transition from mCitrine to BFP, depending on plasmid dosage of constructs containing TAL-B:KRAB (x-axis) and TAL-A:KRAB (y-axis). (g) Ability to perform a state transition from BFP to mCitrine, depending on plasmid dosage of pristinamycin inducible constructs (x-axis) and erithromycin inducible constructs (y-axis). (h) Ability to perform a state transition from mCitrine to BFP, depending on plasmid dosage of pristinamycin inducible constructs (x-axis) and erithromycin inducible constructs (y-axis). | + | |
| - | </td></tr>
| + | |
| - | </tbody>
| + | |
| - | </table>
| + | |
| - | <!-- end table-->
| + | |
| | | | |
| | | | |
| | + | The whole range in which the bistable behaviour is exhibited can be tested using our |
| | + | Interactive Simulations (click to test):<br /><br /> |
| | + | <center><font style="font-family:Times New Roman;">[10:1, 9:1, 8:1, 7:1, 6:1, 5:1, 4:1, 3:1, 2:1, 1:1, 1:2, 1:3, 1:4, 1:5] </font></center><br /> |
| | | | |
| | + | Taking the median of the above range, we conclude that |
| | + | the optimal ratio of input masses for wet lab experiments is at |
| | + | <b>around three to one in favour of the repressor plasmids</b>. |
| | | | |
| | + | <h2 ><a name="source"></a>Source code</h2> |
| | + | All source code for the model and simulations described above can be found <a href ="https://2012.igem.org/Team:Slovenia/SourceCode">here</a>; |
| | | | |
| - | | + | <h2 style="color:grey;" ><a name="references"></a>References</h2> |
| - | | + | |
| - | <h3>Results:Positive feedback loop switch</h3>
| + | |
| - | <br />
| + | |
| - | <p>The addition of a positive feedback loop to the circuit proved beneficial to the overall performance of the system (Figure 8,9). The most notable are the absence of fluctuations on the inducer removal and two orders of magnitude higher stable state concentration of the active reporters (Figure 8a), due to the presence of the positive feedback loop. Consequently, repression of the currently inactive constructs is much more effective, which is proven by not noticeable activity of repressed promoters. The concentration of inactive (repressed) reporter decreased by four to five orders of magnitude (Figure 8d). Fluctuations remain in the concentrations of TAL-KRAB and TAL-VP16 constructs, but do not affect the state of the system (Figure 8d). The state transitions are successful in both directions, with effectively the same active concentrations.</p>
| + | |
| - | | + | |
| - | <!-- figure 8 -->
| + | |
| - | <table class="invisible" style="width:90%;">
| + | |
| - | <tbody class="invisible">
| + | |
| - | <tr class="invisible">
| + | |
| - | <td class="invisible">
| + | |
| - | <img class="invisible" src="https://static.igem.org/mediawiki/2012/5/54/Svn12_qm_41bfeedsym_reporter12.png"/><br/>
| + | |
| - | </td>
| + | |
| - | <td class="invisible">
| + | |
| - | <img class="invisible" src="https://static.igem.org/mediawiki/2012/a/a2/Svn12_qm_42bfeedsym_inducer12.png"/><br/>
| + | |
| - | </td>
| + | |
| - | </tr>
| + | |
| - | <tr class="invisible">
| + | |
| - | <td class="invisible">
| + | |
| - | <img class="invisible" src="https://static.igem.org/mediawiki/2012/3/36/Svn12_qm_43bfeedsym_vp1612.png"/><br/>
| + | |
| - | </td>
| + | |
| - | <td class="invisible">
| + | |
| - | <img class="invisible" src="https://static.igem.org/mediawiki/2012/c/c9/Svn12_qm_44bfeedsym_phase12.png"/><br/>
| + | |
| - | </td>
| + | |
| - | </tr>
| + | |
| - | </tbody>
| + | |
| - | </table>
| + | |
| - | <table class="invisible" style="width:100%; text-align:center;">
| + | |
| - | <tbody class="invisible">
| + | |
| - | <tr class="normal"><td class="invisible">
| + | |
| - | <b>Figure 8. </b>Simulation of a bistable switch for t = 7000 min and non-linearity coefficient n = 3, showing a single state transition from BFP to mCitrine. (a) Concentrations of the reporters. (b) Concentrations of the inducers and active inducible proteins. (b) Concentrations of TAL-B:KRAB and TAL-A:KRAB proteins. (d) Phase space of the system with marked state thresholds.
| + | |
| - | </td></tr>
| + | |
| - | </tbody>
| + | |
| - | </table>
| + | |
| - | <!-- end table-->
| + | |
| - | <!-- figure 9 -->
| + | |
| - | <table class="invisible" style="width:90%;">
| + | |
| - | <tbody class="invisible">
| + | |
| - | <tr class="invisible">
| + | |
| - | <td class="invisible">
| + | |
| - | <img class="invisible" src="https://static.igem.org/mediawiki/2012/f/f5/Svn12_qm_24_bfeedsym_reporter21.png"/><br/>
| + | |
| - | </td>
| + | |
| - | <td class="invisible">
| + | |
| - | <img class="invisible" src="https://static.igem.org/mediawiki/2012/e/e4/Svn12_qm_26_bfeedsym_inducer21.png"/><br/>
| + | |
| - | </td>
| + | |
| - | </tr>
| + | |
| - | <tr class="invisible">
| + | |
| - | <td class="invisible">
| + | |
| - | <img class="invisible" src="https://static.igem.org/mediawiki/2012/d/d8/Svn12_qm_27_bfeedsym_vp1621.png"/><br/>
| + | |
| - | </td>
| + | |
| - | <td class="invisible">
| + | |
| - | <img class="invisible" src="https://static.igem.org/mediawiki/2012/3/31/Svn12_qm_25_bfeedsym_phase25.png"/><br/>
| + | |
| - | </td>
| + | |
| - | </tr>
| + | |
| - | </tbody>
| + | |
| - | </table>
| + | |
| - | <table class="invisible" style="width:100%; text-align:center;">
| + | |
| - | <tbody class="invisible">
| + | |
| - | <tr class="normal"><td class="invisible">
| + | |
| - | <b>Figure 9. </b>Simulation of a bistable switch for t = 7000 min and non-linearity coefficient of n = 3, showing a single state transition from mCitrine to BFP. (a) Concentrations of the reporters. (b) Concentrations of the inducers and active inducible proteins. (b) Concentrations of TAL-B:KRAB and TAL-A:KRAB proteins. (d) Phase space of the system with marked state thresholds.
| + | |
| - | </td></tr>
| + | |
| - | </tbody>
| + | |
| - | </table>
| + | |
| - | <!-- end table-->
| + | |
| - | | + | |
| - | | + | |
| - | | + | |
| - | | + | |
| - | | + | |
| - | | + | |
| - | | + | |
| - | | + | |
| - | <h3>Stability analysis:Positive feedback loop switch</h3>
| + | |
| - | <br />
| + | |
| - | <p>Stability analysis confirms the improvement gained from the positive feedback loop (Figure 10). In the absence of inducers the system can randomly move into one state. Larger ratios of the two pairs of switch plasmids introduce a bias, but at ratios above 5:1 the switch cannot perform the state transition.</p>
| + | |
| - | <p>State transition properties were characterized in terms of the duration and time difference in the introduction of the inducers (Figure 10ab). The parameters were chosen so that the system exhibits one state transition in a time interval of 8000 minutes with the first inducer introduced at t1=0, for a d1=500 minutes duration. The second inducer was introduced at all points in time interval t2 = [1000, 5000] minutes, while the inducer duration was on the interval d2 = [0, 500] minutes. The results show that the required delay must be at least 2169 minutes before the second inducer could be introduced so that the first reporter reaches a stable state, which is 72 % of the time compared to mutual repressor switch.</p>
| + | |
| - | <p>The minimal required duration for an inducer to switch from BFP to mCitrine state or vice versa was 220 minutes. With the signal of that duration, 4814 minutes were required to perform a complete switch. The maximal tested duration of 500 minutes required 4255 minutes for the state transition. The longer transition times than at the beginning of the simulation are again due to the fact that the transition is performed between the two active states of high concentrations, rather than from both concentrations being low. Switching from an already active state takes longer time than in the case of mutual repressor switch, since significantly higher concentrations of proteins representing an active state. Also, an interesting duration parameter range of 109-200 minutes appears where the system could reach the undesired ambiguous state.</p>
| + | |
| - | <p>Furthermore, to ensure the proper functionality of the switch, a very rapid introduction of an inducer is required (Figure 10cd). In particular, to perform a successful mCitrine to BFP transition, the dosage of constructs containing TAL-A:KRAB should not exceed that of constructs containing TAL-B:KRAB by more than 208 %. On the other hand, the dosage of constructs containing TAL-B:KRAB should not exceed that of constructs containing TAL-A:KRAB by more than 204 %. In the opposite direction, to perform a successful BFP to mCitrine transition, the dosage of constructs containing TAL-A:KRAB should not exceed that of constructs containing TAL-B:KRAB by more than 202 %. On the other hand, the dosage of constructs containing TAL-B:KRAB should not exceed that of constructs containing TAL-A:KRAB by more than 202 %. Summing up, it is safe to say that the switch will perform sucessfully if no plasmid dosage exceeds the dosage with opposite construct by more than 200 %, which is a realistically achievable assumption. Due to the addition of positive feedback the threshold ratios have a significantly smaller variation than in the mutual repressor switch case, hence improving the robustness. Also, to perform a complete switch of state, the dosage of Pristinamycin/Erithromicyn inducible constructs shall not be less than 12.5% the dosage of the reporter plasmids, which is half the value of the mutual repressor switch (Figure 10ef).</p>
| + | |
| - | <p>Furthermore, the system proved stable over the whole interval [1.0, 10.0] for transcription factor non-linearity coefficients, confirming that the positive feedback is able to introduce a form of non-linearity. Hence, positive feedback can compensate for explicit non-linearity of transcription factors in the case of our design of the switch.
| + | |
| - | | + | |
| - | <!-- figure 6 -->
| + | |
| - | <table class="invisible" style="width:90%;">
| + | |
| - | <tbody class="invisible" style="width:90%;">
| + | |
| - | <tr class="invisible">
| + | |
| - | <td class="invisible">
| + | |
| - | <img class="invisible" src="https://static.igem.org/mediawiki/2012/6/65/Svn12_qm_28_beef_bfeedsym_03.PNG"/><br/>
| + | |
| - | </td>
| + | |
| - | <td class="invisible">
| + | |
| - | <img class="invisible" src="https://static.igem.org/mediawiki/2012/9/90/Svn12_qm_29_beef_bfeedsym_02.png"/><br/>
| + | |
| - | | + | |
| - | </td>
| + | |
| - | </tr>
| + | |
| - | <tr class="invisible">
| + | |
| - | <td class="invisible">
| + | |
| - | <img class="invisible" src="https://static.igem.org/mediawiki/2012/8/82/Svn12_qm_30_beef_bfeedsym_05.png"/><br/>
| + | |
| - | </td>
| + | |
| - | <td class="invisible">
| + | |
| - | <img class="invisible" src="https://static.igem.org/mediawiki/2012/b/b3/Svn12_qm_31_beef_bfeedsym_04.PNG"/><br/>
| + | |
| - | </td>
| + | |
| - | </tr>
| + | |
| - | <tr class="invisible">
| + | |
| - | <td class="invisible">
| + | |
| - | <img class="invisible" src="https://static.igem.org/mediawiki/2012/f/fc/Svn12_qm_32_bfeedsym_05i.png"><br/>
| + | |
| - | </td>
| + | |
| - | <td class="invisible">
| + | |
| - | <img class="invisible" src="https://static.igem.org/mediawiki/2012/e/ee/Svn12_qm_33_bfeedsym_04i.png"/><br/>
| + | |
| - | </td>
| + | |
| - | </tr>
| + | |
| - | </tbody>
| + | |
| - | </table>
| + | |
| - | <table class="invisible" style="width:100%; text-align:center;">
| + | |
| - | <tbody class="invisible">
| + | |
| - | <tr class="normal"><td class="invisible">
| + | |
| - | <b>Figure 10. </b> Parameter maps for the mutual repressor switch. (a) State transition from BFP to mCitrine, depending on erythromycin input time (x-axis) and duration (y-axis). (b) State transition from mCitrine to BFP, depending on pristinamycin input time (x-axis) and duration (y-axis). (c) Ability to perform a state transition from BFP to mCitrine, depending on plasmid dosage of constructs containing TAL-B:KRAB (x-axis) and TAL-A:KRAB (y-axis). (d) Ability to perform a state transition from mCitrine to BFP, depending on plasmid dosage of constructs containing TAL-B:KRAB (x-axis) and TAL-A:KRAB (y-axis). (e) Ability to perform a state transition from BFP to mCitrine, depending on plasmid dosage of Pristinamycin inducible constructs (x-axis) and erithromicyn inducible constructs (y-axis). (f) Ability to perform a state transition from mCitrine to BFP, depending on plasmid dosage of Pristinamycin inducible constructs (x-axis) and erithromycin inducible constructs (y-axis).
| + | |
| - | </td></tr>
| + | |
| - | </tbody>
| + | |
| - | </table>
| + | |
| - | <!-- end table-->
| + | |
| - | | + | |
| - | | + | |
| - | | + | |
| - | | + | |
| - | <h2 ><a name="model1">Mutual repressor switch model formalization</a></h2> | + | |
| - | | + | |
| - | Indexing of the constructs is described in List~1. The observed chemical species in the system are listed in Table~1, while the parameter values are found in Table~1. Ordinary diferential equations for the mutual repressor switch model are Eq. 1-22.
| + | |
| - | <br/>
| + | |
| - | | + | |
| - | <!-- table begin-->
| + | |
| - | <table class="normal" style="font-size:90%;">
| + | |
| - | <thead class="normal">
| + | |
| - | <tr class="normal">
| + | |
| - | <th class="normal">Number</td>
| + | |
| - | <th class="normal">Used construct</td>
| + | |
| - | </tr>
| + | |
| - | </thead>
| + | |
| - | <tbody class="normal">
| + | |
| - | <tr class="normal">
| + | |
| - | <td class="normal">1</td>
| + | |
| - | <td class="normal">[A]_pCMV_TAL-B:KRAB_BFP</td>
| + | |
| - | </tr>
| + | |
| - | <tr class="normal">
| + | |
| - | <td class="normal">2</td>
| + | |
| - | <td class="normal">[B]_pCMV_TAL-A:KRAB_mCitrine</td>
| + | |
| - | </tr>
| + | |
| - | <tr class="normal">
| + | |
| - | <td class="normal">3</td>
| + | |
| - | <td class="normal">pCMV_[PIR]_TAL-B:KRAB</td>
| + | |
| - | </tr>
| + | |
| - | <tr class="normal">
| + | |
| - | <td class="normal">4</td>
| + | |
| - | <td class="normal">pCMV_[ETR]_TAL-B:KRAB</td>
| + | |
| - | </tr>
| + | |
| - | <tr class="normal">
| + | |
| - | <td class="normal">5</td>
| + | |
| - | <td class="normal">pCMV_PIP:KRAB</td>
| + | |
| - | </tr>
| + | |
| - | <tr class="normal">
| + | |
| - | <td class="normal">6</td>
| + | |
| - | <td class="normal">pCMV_E:KRAB </td>
| + | |
| - | </tr>
| + | |
| - | </tbody>
| + | |
| - | </table>
| + | |
| - | <table class="invisible" style="width:100%; text-align:center;">
| + | |
| - | <tbody class="invisible">
| + | |
| - | <tr class="normal"><td class="invisible">
| + | |
| - | <b>List 1.</b> Used constructs and their indexes.
| + | |
| - | </td></tr>
| + | |
| - | </tbody>
| + | |
| - | </table>
| + | |
| - | <!-- end table-->
| + | |
| - | | + | |
| - | | + | |
| - | | + | |
| - | <!-- table begin-->
| + | |
| - | <table class="normal" style="font-size:90%;">
| + | |
| - | <thead class="normal">
| + | |
| - | <tr class="normal">
| + | |
| - | <th class="normal">Symbol</td>
| + | |
| - | <th class="normal">Chemical species</td>
| + | |
| - | </tr>
| + | |
| - | </thead>
| + | |
| - | <tbody class="normal">
| + | |
| - | <tr class="normal">
| + | |
| - | <td class="normal">[E:KRABm]</td>
| + | |
| - | <td class="normal">Erythromycin binding protein (mRNA)</td>
| + | |
| - | </tr>
| + | |
| - | <tr class="normal">
| + | |
| - | <td class="normal">[E:KRABp]</td>
| + | |
| - | <td class="normal">Erythromycin binding protein</td>
| + | |
| - | </tr>
| + | |
| - | <tr class="normal">
| + | |
| - | <td class="normal">[E:KRABa]</td>
| + | |
| - | <td class="normal">Erythromycin - E:KRAB complex</td>
| + | |
| - | </tr>
| + | |
| - | <tr class="normal">
| + | |
| - | <td class="normal">[PIP:KRABm]</td>
| + | |
| - | <td class="normal">Pristinamicyn binding protein (mRNA)</td>
| + | |
| - | </tr>
| + | |
| - | <tr class="normal">
| + | |
| - | <td class="normal">[PIP:KRABp]</td>
| + | |
| - | <td class="normal">Pristinamicyn binding protein</td>
| + | |
| - | </tr>
| + | |
| - | <tr class="normal">
| + | |
| - | <td class="normal">[PIP:KRABa]</td>
| + | |
| - | <td class="normal">Pristinamicyn - PIP:KRAB complex</td>
| + | |
| - | </tr>
| + | |
| - | <tr class="normal">
| + | |
| - | <td class="normal">[Pc]</td>
| + | |
| - | <td class="normal">Pristinamycin inducer</td>
| + | |
| - | </tr>
| + | |
| - | <tr class="normal">
| + | |
| - | <td class="normal">[Rg]</td>
| + | |
| - | <td class="normal">Rapamicyn inducer</td>
| + | |
| - | </tr>
| + | |
| - | <tr class="normal">
| + | |
| - | <td class="normal">[TAL-B:KRABm]</td>
| + | |
| - | <td class="normal">TAL-B:KRAB repressor protein (mRNA)</td>
| + | |
| - | </tr>
| + | |
| - | <tr class="normal">
| + | |
| - | <td class="normal">[TAL-B:KRABp]</td>
| + | |
| - | <td class="normal">TAL-B:KRAB repressor protein</td>
| + | |
| - | </tr>
| + | |
| - | <tr class="normal">
| + | |
| - | <td class="normal">[TAL-A:KRABm]</td>
| + | |
| - | <td class="normal">TAL-A:KRAB repressor protein (mRNA)</td>
| + | |
| - | </tr>
| + | |
| - | <tr class="normal">
| + | |
| - | <td class="normal">[TAL-A:KRABp]</td>
| + | |
| - | <td class="normal">TAL-A:KRAB repressor protein</td>
| + | |
| - | </tr>
| + | |
| - | <tr class="normal">
| + | |
| - | <td class="normal">[BFPm]</td>
| + | |
| - | <td class="normal">BFP reporter protein (mRNA)</td>
| + | |
| - | </tr>
| + | |
| - | <tr class="normal">
| + | |
| - | <td class="normal">[BFPp]</td>
| + | |
| - | <td class="normal">BFP reporter protein</td>
| + | |
| - | </tr>
| + | |
| - | <tr class="normal">
| + | |
| - | <td class="normal">[MCTm]</td>
| + | |
| - | <td class="normal">mCITRIN reporter protein (mRNA)</td>
| + | |
| - | </tr>
| + | |
| - | <tr class="normal">
| + | |
| - | <td class="normal">[MCTp]</td>
| + | |
| - | <td class="normal">mCITRIN reporter protein</td>
| + | |
| - | </tr>
| + | |
| - | </table>
| + | |
| - | <table class="invisible" style="width:100%; text-align:center;">
| + | |
| - | <tbody class="invisible">
| + | |
| - | <tr class="normal"><td class="invisible">
| + | |
| - | <b>Table 1.</b> Observed chemical species
| + | |
| - | </td></tr>
| + | |
| - | </tbody>
| + | |
| - | </table>
| + | |
| - | <!-- end table-->
| + | |
| - | | + | |
| - | | + | |
| - | | + | |
| - | | + | |
| - | | + | |
| - | | + | |
| - | | + | |
| - | | + | |
| - | | + | |
| - | | + | |
| - | <!-- table begin-->
| + | |
| - | <table class="normal" style="font-size:90%;">
| + | |
| - | <thead class="normal">
| + | |
| - | <tr class="normal">
| + | |
| - | <th class="normal">Symbol</th>
| + | |
| - | <th class="normal">Parameter</th>
| + | |
| - | <th class="normal">Initial value</th>
| + | |
| - | <th class="normal">Units</th>
| + | |
| - | <th class="normal">Source/reference</th>
| + | |
| - | </tr>
| + | |
| - | </thead>
| + | |
| - | <tbody class="normal">
| + | |
| - | <tr class="normal">
| + | |
| - | <td class="normal">G1</td>
| + | |
| - | <td class="normal">Plasmid 1 dosage</td>
| + | |
| - | <td class="normal">190.0</td>
| + | |
| - | <td class="normal">ng</td>
| + | |
| - | <td class="normal">Literature data (Tigges et. al, 2009)</td>
| + | |
| - | </tr><tr class="normal">
| + | |
| - | <td class="normal">G2</td>
| + | |
| - | <td class="normal">Plasmid 2 dosage</td>
| + | |
| - | <td class="normal">180.0 </td>
| + | |
| - | <td class="normal">ng</td>
| + | |
| - | <td class="normal">Literature data (Tigges et. al, 2009)</td>
| + | |
| - | </tr><tr class="normal">
| + | |
| - | <td class="normal">G3</td>
| + | |
| - | <td class="normal">Plasmid 3 dosage</td>
| + | |
| - | <td class="normal">180.0 </td>
| + | |
| - | <td class="normal">ng</td>
| + | |
| - | <td class="normal">Literature data (Tigges et. al, 2009)</td>
| + | |
| - | </tr><tr class="normal">
| + | |
| - | <td class="normal">G4</td>
| + | |
| - | <td class="normal"> Plasmid 4 dosage</td>
| + | |
| - | <td class="normal">180.0 </td>
| + | |
| - | <td class="normal">ng</td>
| + | |
| - | <td class="normal">Literature data (Tigges et. al, 2009)</td>
| + | |
| - | </tr><tr class="normal">
| + | |
| - | <td class="normal">G5</td>
| + | |
| - |
| + | |
| - | <td class="normal">Plasmid 5 dosage</td>
| + | |
| - | <td class="normal">180.0 </td><td class="normal">ng</td>
| + | |
| - | <td class="normal">Literature data (Tigges et. al, 2009)</td>
| + | |
| - | </tr><tr class="normal">
| + | |
| - | <td class="normal">G6</td>
| + | |
| - | <td class="normal">Plasmid 6 dosage</td>
| + | |
| - | <td class="normal">180.0</td>
| + | |
| - | <td class="normal">ng</td>
| + | |
| - | <td class="normal">Literature data (Tigges et. al, 2009)</td>
| + | |
| - | </tr><tr class="normal">
| + | |
| - | <td class="normal">k1</td>
| + | |
| - | <td class="normal">Plasmid 1 basal transcritiption rate</td>
| + | |
| - | <td class="normal">30.0</td>
| + | |
| - | <td class="normal">mRNA/min</td>
| + | |
| - | <td class="normal">Literature data (Tigges et. al, 2009)</td>
| + | |
| - | </tr><tr class="normal">
| + | |
| - | <td class="normal">k2</td>
| + | |
| - | <td class="normal">Plasmid 2 basal transcritiption rate</td>
| + | |
| - | <td class="normal">30.0</td>
| + | |
| - | <td class="normal">mRNA/min</td>
| + | |
| - | <td class="normal">Literature data (Tigges et. al, 2009)</td>
| + | |
| - | </tr><tr class="normal">
| + | |
| - | <td class="normal">k3</td>
| + | |
| - | <td class="normal">Plasmid 3 basal transcritiption rate</td>
| + | |
| - | <td class="normal">30.0</td>
| + | |
| - | <td class="normal">mRNA/min</td>
| + | |
| - | <td class="normal">Literature data (Tigges et. al, 2009)</td>
| + | |
| - | </tr><tr class="normal">
| + | |
| - | <td class="normal">k4</td>
| + | |
| - | <td class="normal">Plasmid 4 basal transcritiption rate</td>
| + | |
| - | <td class="normal">30.0</td>
| + | |
| - | <td class="normal">mRNA/min</td>
| + | |
| - | <td class="normal">Literature data (Tigges et. al, 2009)</td>
| + | |
| - | </tr><tr class="normal">
| + | |
| - | <td class="normal">k5</td>
| + | |
| - | <td class="normal">Plasmid 5 basal transcritiption rate</td>
| + | |
| - | <td class="normal">30.0</td>
| + | |
| - | <td class="normal">mRNA/min</td>
| + | |
| - | <td class="normal">Literature data (Tigges et. al, 2009)</td>
| + | |
| - | </tr><tr class="normal">
| + | |
| - | <td class="normal">k6</td>
| + | |
| - |
| + | |
| - | <td class="normal">Plasmid 6 basal transcritiption rate</td>
| + | |
| - | <td class="normal">30.0</td>
| + | |
| - | <td class="normal">mRNA/min</td>
| + | |
| - | <td class="normal">Literature data (Tigges et. al, 2009)</td>
| + | |
| - | </tr><tr class="normal">
| + | |
| - | <td class="normal"> sB</td>
| + | |
| - | <td class="normal">TAL-B:KRAB scaling constant</td>
| + | |
| - | <td class="normal"> -</td>
| + | |
| - | <td class="normal"> -</td>
| + | |
| - | <td class="normal">Calculated from experimental data</td>
| + | |
| - | </tr><tr class="normal">
| + | |
| - | <td class="normal">sA</td>
| + | |
| - | <td class="normal">TAL-A:KRAB scaling constant</td>
| + | |
| - | <td class="normal">-</td>
| + | |
| - | <td class="normal">-</td>
| + | |
| - | <td class="normal">Calculated from experimental data</td>
| + | |
| - | </tr><tr class="normal">
| + | |
| - | <td class="normal">nB</td>
| + | |
| - | <td class="normal">TAL-B:KRAB Hill coefficient</td>
| + | |
| - | <td class="normal">3.0
| + | |
| - | <td class="normal">-</td>
| + | |
| - | <td class="normal">Literature data [3]</td>
| + | |
| - | </tr><tr class="normal">
| + | |
| - | <td class="normal">nA
| + | |
| - | <td class="normal">TAL-A:KRAB Hill coefficient</td>
| + | |
| - | <td class="normal">3.0
| + | |
| - | <td class="normal">-</td>
| + | |
| - | <td class="normal">Literature data [3]</td>
| + | |
| - | </tr><tr class="normal">
| + | |
| - | <td class="normal">tB</td>
| + | |
| - | <td class="normal">TAL-B threshold concentration</td>
| + | |
| - | <td class="normal">100.0</td>
| + | |
| - | <td class="normal">nM</td>
| + | |
| - | <td class="normal">Adjusted by user defined state threshold</td>
| + | |
| - | </tr><tr class="normal">
| + | |
| - | <td class="normal">tA</td>
| + | |
| - | <td class="normal">TAL-A threshold concentration</td>
| + | |
| - | <td class="normal"> 100.0</td>
| + | |
| - | <td class="normal">nM</td>
| + | |
| - | <td class="normal">Adjusted by user defined state threshold</td>
| + | |
| - | </tr><tr class="normal">
| + | |
| - | <td class="normal">dm</td>
| + | |
| - | <td class="normal"> mRNA degradation rate</td>
| + | |
| - | <td class="normal"> 0.0173</td>
| + | |
| - | <td class="normal"> mRNA/min</td>
| + | |
| - | <td class="normal"> Literature data (Tigges et. al, 2009)</td>
| + | |
| - | </tr><tr class="normal">
| + | |
| - | <td class="normal">dp</td>
| + | |
| - | <td class="normal">Protein degradation rate</td>
| + | |
| - | <td class="normal">0.0058</td>
| + | |
| - | <td class="normal">nM</td>
| + | |
| - | <td class="normal">Literature data (Tigges et. al, 2009)</td>
| + | |
| - | </tr><tr class="normal">
| + | |
| - | <td class="normal">tp</td>
| + | |
| - | <td class="normal">Translation rate</td>
| + | |
| - | <td class="normal">0.2</td>
| + | |
| - | <td class="normal">nM</td>
| + | |
| - | <td class="normal">Literature data (Tigges et. al, 2009)</td>
| + | |
| - | </tr><tr class="normal">
| + | |
| - | <td class="normal">Apc</td>
| + | |
| - | <td class="normal">Pristinamicyn-PIP:KRAB binding affinity</td>
| + | |
| - | <td class="normal">1.0</td>
| + | |
| - | <td class="normal">-</td>
| + | |
| - | <td class="normal">Literature data (Tigges et. al, 2009)</td>
| + | |
| - | </tr><tr class="normal">
| + | |
| - | <td class="normal">Aec</td>
| + | |
| - | <td class="normal">Erythromycin-E:KRAB binding affinity</td>
| + | |
| - | <td class="normal">1.0</td>
| + | |
| - | <td class="normal">-</td>
| + | |
| - | <td class="normal">Indentical to Apc</td>
| + | |
| - | </tr><tr class="normal">
| + | |
| - | <td class="normal">Kpc</td>
| + | |
| - | <td class="normal">Promoter-PIP:KRAB binding affinity</td>
| + | |
| - | <td class="normal">1.0 </td>
| + | |
| - | <td class="normal">-</td>
| + | |
| - | <td class="normal">Literature data (Tigges et. al, 2009)</td>
| + | |
| - | </tr><tr class="normal">
| + | |
| - | <td class="normal">Krc</td>
| + | |
| - | <td class="normal">Promoter-E:KRAB binding affinity</td>
| + | |
| - | <td class="normal">1.0</td>
| + | |
| - | <td class="normal">-</td>
| + | |
| - | <td class="normal">Identical to Kpc</td>
| + | |
| - | </tr><tr class="normal">
| + | |
| - | <td class="normal">Alphapc</td>
| + | |
| - | <td class="normal">Basal activity of PIP:KRAB inducible promoter</td>
| + | |
| - | <td class="normal">0.085</td>
| + | |
| - | <td class="normal">nM</td>
| + | |
| - | <td class="normal">Literature data (Tigges et. al, 2009) </td>
| + | |
| - | </tr><tr class="normal">
| + | |
| - | <td class="normal">Alphaec</td>
| + | |
| - | <td class="normal">Basal activity of E:KRAB inducible promoter</td>
| + | |
| - | <td class="normal">0.025</td>
| + | |
| - | <td class="normal">nM</td>
| + | |
| - | <td class="normal">Calculated from experimental data</td>
| + | |
| - | </tr><tr class="normal">
| + | |
| - | <td class="normal">npc</td>
| + | |
| - | <td class="normal">PIP:KRAB Cooperativity coefficient</td>
| + | |
| - | <td class="normal">2.0</td>
| + | |
| - | <td class="normal">-</td>
| + | |
| - | <td class="normal">Literature data (Tigges et. al, 2009)</td>
| + | |
| - | </tr><tr class="normal">
| + | |
| - | <td class="normal">nec</td>
| + | |
| - | <td class="normal">E:KRAB Cooperativity coefficient</td>
| + | |
| - | <td class="normal">2.0</td>
| + | |
| - | <td class="normal">-</td>
| + | |
| - | <td class="normal">Identical to npc</td>
| + | |
| - | </tr><tr class="normal">
| + | |
| - | <td class="normal">fv</td>
| + | |
| - | <td class="normal">Concentration scaling factor</td>
| + | |
| - | <td class="normal">92500</td>
| + | |
| - | <td class="normal">-</td>
| + | |
| - | <td class="normal">Literature data (Tigges et. al, 2009)</td>
| + | |
| - | </tr><tr class="normal">
| + | |
| - | <td class="normal">tau</td>
| + | |
| - | <td class="normal">Active state concentration threshold</td>
| + | |
| - | <td class="normal">100.0</td>
| + | |
| - | <td class="normal">nM</td>
| + | |
| - | <td class="normal">Adjustable user defined state threshold</td>
| + | |
| - | </table>
| + | |
| - | <table class="invisible" style="width:100%; text-align:center;">
| + | |
| - | <tbody class="invisible">
| + | |
| - | <tr class="normal"><td class="invisible">
| + | |
| - | <b>Table 2.</b> Parameters and their initial values
| + | |
| - | </td></tr>
| + | |
| - | </tbody>
| + | |
| - | </table>
| + | |
| - | <!-- end table-->
| + | |
| - | | + | |
| - | | + | |
| - | | + | |
| - | | + | |
| - | | + | |
| - | <h3>Model ordinary differential equations</h3>
| + | |
| - | <h4>Inducible system</h4>
| + | |
| - | <center><img src="https://static.igem.org/mediawiki/2012/f/f3/Svn12_qm_12Appendix2-1_copy.png" style="width:700px;"/></center><br/>
| + | |
| - | <h4>The Switch</h4>
| + | |
| - | <center><img src="https://static.igem.org/mediawiki/2012/c/c2/Svn12_qm_13Appendix2-2.png" style="width:700px;"/></center><br/>
| + | |
| - | <h4>Reporters</h4>
| + | |
| - | <center><img src="https://static.igem.org/mediawiki/2012/5/51/Svn12_qm_14Appendix.png" style="width:700px; "/></center><br/>
| + | |
| - | | + | |
| - | | + | |
| - | | + | |
| - | | + | |
| - | | + | |
| - | | + | |
| - | | + | |
| - | | + | |
| - | | + | |
| - | | + | |
| - | | + | |
| - | | + | |
| - | | + | |
| - | | + | |
| - | <h2 ><a name="model2">The positive feedback loop switch model formalization</a></h2>
| + | |
| - | | + | |
| - | Indexing of the constructs is described in List~2. The observed chemical species in the system are listed in Table~1, while the parameter values are found in Table~2. Ordinary diferential equations for the mutual repressor switch model are Eq. 23-47.
| + | |
| - | <br/>
| + | |
| - | | + | |
| - | <!-- table begin-->
| + | |
| - | <table class="normal" style="font-size:90%;">
| + | |
| - | <thead class="normal">
| + | |
| - | <tr class="normal">
| + | |
| - | <th class="normal">Number</td>
| + | |
| - | <th class="normal">Used construct</td>
| + | |
| - | </tr>
| + | |
| - | </thead>
| + | |
| - | <tbody class="normal">
| + | |
| - | <tr class="normal">
| + | |
| - | <td class="normal">1</td>
| + | |
| - | <td class="normal">[A]_pCMV_TAL-B:KRAB_TAL-A:VP16_BFP </td>
| + | |
| - | </tr>
| + | |
| - | <tr class="normal">
| + | |
| - | <td class="normal">2</td>
| + | |
| - | <td class="normal">[B]_pCMV_TAL-A:KRAB_TAL-B:VP16_mCitrine</td>
| + | |
| - | </tr>
| + | |
| - | <tr class="normal">
| + | |
| - | <td class="normal">3</td>
| + | |
| - | <td class="normal">pCMV_[PIR]_TAL-B:KRAB_TAL-A:VP16</td>
| + | |
| - | </tr>
| + | |
| - | <tr class="normal">
| + | |
| - | <td class="normal">4</td>
| + | |
| - | <td class="normal">pCMV_[ETR]_TAL-A:KRAB_TAL-B:VP16</td>
| + | |
| - | </tr>
| + | |
| - | <tr class="normal">
| + | |
| - | <td class="normal">5</td>
| + | |
| - | <td class="normal">pCMV_PIP:KRAB_E:KRAB</td>
| + | |
| - | </tr>
| + | |
| - | </tbody>
| + | |
| - | </table>
| + | |
| - | <table class="invisible" style="width:100%; text-align:center;">
| + | |
| - | <tbody class="invisible">
| + | |
| - | <tr class="normal"><td class="invisible">
| + | |
| - | <b>List 2.</b> Used constrcts and their indexes.
| + | |
| - | </td></tr>
| + | |
| - | </tbody>
| + | |
| - | </table>
| + | |
| - | <!-- end table-->
| + | |
| - | | + | |
| - | | + | |
| - | | + | |
| - | | + | |
| - | <!-- table begin-->
| + | |
| - | <table class="normal" style="font-size:90%;">
| + | |
| - | <thead class="normal">
| + | |
| - | <tr class="normal">
| + | |
| - | <th class="normal">Symbol</td>
| + | |
| - | <th class="normal">Chemical species</td>
| + | |
| - | </tr>
| + | |
| - | </thead>
| + | |
| - | <tbody class="normal">
| + | |
| - | <tr class="normal">
| + | |
| - | <td class="normal">[E:KRABm]</td>
| + | |
| - | <td class="normal">Erythromycin binding protein (mRNA)</td>
| + | |
| - | </tr>
| + | |
| - | <tr class="normal">
| + | |
| - | <td class="normal">[E:KRABp]</td>
| + | |
| - | <td class="normal">Erythromycin binding protein</td>
| + | |
| - | </tr>
| + | |
| - | <tr class="normal">
| + | |
| - | <td class="normal">[E:KRABa]</td>
| + | |
| - | <td class="normal">Erythromycin - E:KRAB complex</td>
| + | |
| - | </tr>
| + | |
| - | <tr class="normal">
| + | |
| - | <td class="normal">[PIP:KRABm]</td>
| + | |
| - | <td class="normal">Pristinamicyn binding protein (mRNA)</td>
| + | |
| - | </tr>
| + | |
| - | <tr class="normal">
| + | |
| - | <td class="normal">[PIP:KRABp]</td>
| + | |
| - | <td class="normal">Pristinamicyn binding protein</td>
| + | |
| - | </tr>
| + | |
| - | <tr class="normal">
| + | |
| - | <td class="normal">[PIP:KRABa]</td>
| + | |
| - | <td class="normal">Pristinamicyn - PIP:KRAB complex</td>
| + | |
| - | </tr>
| + | |
| - | <tr class="normal">
| + | |
| - | <td class="normal">[Pc]</td>
| + | |
| - | <td class="normal">Pristinamycin inducer</td>
| + | |
| - | </tr>
| + | |
| - | <tr class="normal">
| + | |
| - | <td class="normal">[Rg]</td>
| + | |
| - | <td class="normal">Rapamicyn inducer</td>
| + | |
| - | </tr>
| + | |
| - | <tr class="normal">
| + | |
| - | <td class="normal">[TAL-B:KRABm]</td>
| + | |
| - | <td class="normal">Tal-BKrab repressor protein (mRNA)</td>
| + | |
| - | </tr>
| + | |
| - | <tr class="normal">
| + | |
| - | <td class="normal">[TAL-B:KRABp]</td>
| + | |
| - | <td class="normal">Tal-BKrab repressor protein</td>
| + | |
| - | </tr>
| + | |
| - | <tr class="normal">
| + | |
| - | <td class="normal">[TAL-A:KRABm]</td>
| + | |
| - | <td class="normal">Tal-AKrab repressor protein (mRNA)</td>
| + | |
| - | </tr>
| + | |
| - | <tr class="normal">
| + | |
| - | <td class="normal">[TAL-A:KRABp]</td>
| + | |
| - | <td class="normal">Tal-AKrab repressor protein</td>
| + | |
| - | </tr>
| + | |
| - | <tr class="normal">
| + | |
| - | <td class="normal">[TAL-B:VP16m]</td>
| + | |
| - | <td class="normal">Tal-B:Vp16 activator protein (mRNA)</td>
| + | |
| - | </tr>
| + | |
| - | <tr class="normal">
| + | |
| - | <td class="normal">[TAL-B:VP16p]</td>
| + | |
| - | <td class="normal">Tal-B:Vp16 activator protein</td>
| + | |
| - | </tr>
| + | |
| - | <tr class="normal">
| + | |
| - | <td class="normal">[TAL-A:VP16m]</td>
| + | |
| - | <td class="normal">Tal-AVp16 activator protein (mRNA)</td>
| + | |
| - | </tr>
| + | |
| - | <tr class="normal">
| + | |
| - | <td class="normal">[TAL-A:VP16p]</td>
| + | |
| - | <td class="normal">Tal-AVp16 activator protein</td>
| + | |
| - | </tr>
| + | |
| - | <tr class="normal">
| + | |
| - | <td class="normal">[BFPm]</td>
| + | |
| - | <td class="normal">BFP reporter protein (mRNA)</td>
| + | |
| - | </tr>
| + | |
| - | <tr class="normal">
| + | |
| - | <td class="normal">[BFPp]</td>
| + | |
| - | <td class="normal">BFP reporter protein</td>
| + | |
| - | </tr>
| + | |
| - | <tr class="normal">
| + | |
| - | <td class="normal">[MCTm]</td>
| + | |
| - | <td class="normal">mCITRIN reporter protein (mRNA)</td>
| + | |
| - | </tr>
| + | |
| - | <tr class="normal">
| + | |
| - | <td class="normal">[MCTp]</td>
| + | |
| - | <td class="normal">mCITRIN reporter protein</td>
| + | |
| - | </tr>
| + | |
| - | </table>
| + | |
| - | <table class="invisible" style="width:100%; text-align:center;">
| + | |
| - | <tbody class="invisible">
| + | |
| - | <tr class="normal"><td class="invisible">
| + | |
| - | <b>Table 2.</b> Observed chemical species
| + | |
| - | </td></tr>
| + | |
| - | </tbody>
| + | |
| - | </table>
| + | |
| - | <!-- end table-->
| + | |
| - | | + | |
| - | | + | |
| - | <!-- table begin-->
| + | |
| - | <table class="normal" style="font-size:90%;">
| + | |
| - | <thead class="normal">
| + | |
| - | <tr class="normal">
| + | |
| - | <th class="normal">Symbol</th>
| + | |
| - | <th class="normal">Parameter</th>
| + | |
| - | <th class="normal">Initial value</th>
| + | |
| - | <th class="normal">Units</th>
| + | |
| - | <th class="normal">Source/reference</th>
| + | |
| - | </tr>
| + | |
| - | </thead>
| + | |
| - | <tbody class="normal">
| + | |
| - | <tr class="normal">
| + | |
| - | <td class="normal">G1</td>
| + | |
| - | <td class="normal">Plasmid 1 dosage</td>
| + | |
| - | <td class="normal">190.0</td>
| + | |
| - | <td class="normal">ng</td>
| + | |
| - | <td class="normal">Literature data (Tigges et. al, 2009)</td>
| + | |
| - | </tr><tr class="normal">
| + | |
| - | <td class="normal">G2</td>
| + | |
| - | <td class="normal">Plasmid 2 dosage</td>
| + | |
| - | <td class="normal">180.0 </td>
| + | |
| - | <td class="normal">ng</td>
| + | |
| - | <td class="normal">Literature data (Tigges et. al, 2009)</td>
| + | |
| - | </tr><tr class="normal">
| + | |
| - | <td class="normal">G3</td>
| + | |
| - | <td class="normal">Plasmid 3 dosage</td>
| + | |
| - | <td class="normal">180.0 </td>
| + | |
| - | <td class="normal">ng</td>
| + | |
| - | <td class="normal">Literature data (Tigges et. al, 2009)</td>
| + | |
| - | </tr><tr class="normal">
| + | |
| - | <td class="normal">G4</td>
| + | |
| - | <td class="normal"> Plasmid 4 dosage</td>
| + | |
| - | <td class="normal">180.0 </td>
| + | |
| - | <td class="normal">ng</td>
| + | |
| - | <td class="normal">Literature data (Tigges et. al, 2009)</td>
| + | |
| - | </tr><tr class="normal">
| + | |
| - | <td class="normal">G5</td>
| + | |
| - |
| + | |
| - | <td class="normal">Plasmid 5 dosage</td>
| + | |
| - | <td class="normal">180.0 </td><td class="normal">ng</td>
| + | |
| - | <td class="normal">Literature data (Tigges et. al, 2009)</td>
| + | |
| - | </tr><tr class="normal">
| + | |
| - | <td class="normal">G6</td>
| + | |
| - | <td class="normal">Plasmid 6 dosage</td>
| + | |
| - | <td class="normal">180.0</td>
| + | |
| - | <td class="normal">ng</td>
| + | |
| - | <td class="normal">Literature data (Tigges et. al, 2009)</td>
| + | |
| - | </tr><tr class="normal">
| + | |
| - | <td class="normal">k1</td>
| + | |
| - | <td class="normal">Plasmid 1 basal transcritiption rate</td>
| + | |
| - | <td class="normal">30.0</td>
| + | |
| - | <td class="normal">mRNA/min</td>
| + | |
| - | <td class="normal">Literature data (Tigges et. al, 2009)</td>
| + | |
| - | </tr><tr class="normal">
| + | |
| - | <td class="normal">k2</td>
| + | |
| - | <td class="normal">Plasmid 2 basal transcritiption rate</td>
| + | |
| - | <td class="normal">30.0</td>
| + | |
| - | <td class="normal">mRNA/min</td>
| + | |
| - | <td class="normal">Literature data (Tigges et. al, 2009)</td>
| + | |
| - | </tr><tr class="normal">
| + | |
| - | <td class="normal">k3</td>
| + | |
| - | <td class="normal">Plasmid 3 basal transcritiption rate</td>
| + | |
| - | <td class="normal">30.0</td>
| + | |
| - | <td class="normal">mRNA/min</td>
| + | |
| - | <td class="normal">Literature data (Tigges et. al, 2009)</td>
| + | |
| - | </tr><tr class="normal">
| + | |
| - | <td class="normal">k4</td>
| + | |
| - | <td class="normal">Plasmid 4 basal transcritiption rate</td>
| + | |
| - | <td class="normal">30.0</td>
| + | |
| - | <td class="normal">mRNA/min</td>
| + | |
| - | <td class="normal">Literature data (Tigges et. al, 2009)</td>
| + | |
| - | </tr><tr class="normal">
| + | |
| - | <td class="normal">k5</td>
| + | |
| - | <td class="normal">Plasmid 5 basal transcritiption rate</td>
| + | |
| - | <td class="normal">30.0</td>
| + | |
| - | <td class="normal">mRNA/min</td>
| + | |
| - | <td class="normal">Literature data (Tigges et. al, 2009)</td>
| + | |
| - | </tr><tr class="normal">
| + | |
| - | <td class="normal">k6</td>
| + | |
| - |
| + | |
| - | <td class="normal">Plasmid 6 basal transcritiption rate</td>
| + | |
| - | <td class="normal">30.0</td>
| + | |
| - | <td class="normal">mRNA/min</td>
| + | |
| - | <td class="normal">Literature data (Tigges et. al, 2009)</td>
| + | |
| - | </tr>
| + | |
| - | <tr class="normal">
| + | |
| - | <td class="normal"> sB</td>
| + | |
| - | <td class="normal">TAL-B:KRAB scaling constant</td>
| + | |
| - | <td class="normal"> -</td>
| + | |
| - | <td class="normal"> -</td>
| + | |
| - | <td class="normal">Calculated from experimental data</td>
| + | |
| - | </tr><tr class="normal">
| + | |
| - | <td class="normal">sA</td>
| + | |
| - | <td class="normal">TAL-A:KRAB scaling constant</td>
| + | |
| - | <td class="normal">-</td>
| + | |
| - | <td class="normal">-</td>
| + | |
| - | <td class="normal">Calculated from experimental data</td>
| + | |
| - | </tr><tr class="normal">
| + | |
| - | <td class="normal">nB</td>
| + | |
| - | <td class="normal">TAL-B:KRAB Hill coefficient</td>
| + | |
| - | <td class="normal">3.0
| + | |
| - | <td class="normal">-</td>
| + | |
| - | <td class="normal">Literature data [3]</td>
| + | |
| - | </tr><tr class="normal">
| + | |
| - | <td class="normal">nA
| + | |
| - | <td class="normal">TAL-A:KRAB Hill coefficient</td>
| + | |
| - | <td class="normal">3.0
| + | |
| - | <td class="normal">-</td>
| + | |
| - | <td class="normal">Literature data [3]</td>
| + | |
| - | </tr><tr class="normal">
| + | |
| - | <td class="normal">tB</td>
| + | |
| - | <td class="normal">TAL-B threshold concentration</td>
| + | |
| - | <td class="normal">100.0</td>
| + | |
| - | <td class="normal">nM</td>
| + | |
| - | <td class="normal">Adjusted by user defined state threshold</td>
| + | |
| - | </tr><tr class="normal">
| + | |
| - | <td class="normal">tA</td>
| + | |
| - | <td class="normal">TAL-A threshold concentration</td>
| + | |
| - | <td class="normal"> 100.0</td>
| + | |
| - | <td class="normal">nM</td>
| + | |
| - | <td class="normal">Adjusted by user defined state threshold</td>
| + | |
| - | </tr><tr class="normal">
| + | |
| - | <td class="normal">dm</td>
| + | |
| - | <td class="normal"> mRNA degradation rate</td>
| + | |
| - | <td class="normal"> 0.0173</td>
| + | |
| - | <td class="normal"> mRNA/min</td>
| + | |
| - | <td class="normal"> Literature data (Tigges et. al, 2009)</td>
| + | |
| - | </tr><tr class="normal">
| + | |
| - | <td class="normal">dp</td>
| + | |
| - | <td class="normal">Protein degradation rate</td>
| + | |
| - | <td class="normal">0.0058</td>
| + | |
| - | <td class="normal">nM</td>
| + | |
| - | <td class="normal">Literature data (Tigges et. al, 2009)</td>
| + | |
| - | </tr><tr class="normal">
| + | |
| - | <td class="normal">tp</td>
| + | |
| - | <td class="normal">Translation rate</td>
| + | |
| - | <td class="normal">0.2</td>
| + | |
| - | <td class="normal">nM</td>
| + | |
| - | <td class="normal">Literature data (Tigges et. al, 2009)</td>
| + | |
| - | </tr><tr class="normal">
| + | |
| - | <td class="normal">Apc</td>
| + | |
| - | <td class="normal">Pristinamicyn-PIP:KRAB binding affinity</td>
| + | |
| - | <td class="normal">1.0</td>
| + | |
| - | <td class="normal">-</td>
| + | |
| - | <td class="normal">Literature data (Tigges et. al, 2009)</td>
| + | |
| - | </tr><tr class="normal">
| + | |
| - | <td class="normal">Aec</td>
| + | |
| - | <td class="normal">Erythromycin-E:KRAB binding affinity</td>
| + | |
| - | <td class="normal">1.0</td>
| + | |
| - | <td class="normal">-</td>
| + | |
| - | <td class="normal">Indentical to Apc</td>
| + | |
| - | </tr><tr class="normal">
| + | |
| - | <td class="normal">Kpc</td>
| + | |
| - | <td class="normal">Promoter-PIP:KRAB binding affinity</td>
| + | |
| - | <td class="normal">1.0 </td>
| + | |
| - | <td class="normal">-</td>
| + | |
| - | <td class="normal">Literature data (Tigges et. al, 2009)</td>
| + | |
| - | </tr><tr class="normal">
| + | |
| - | <td class="normal">Krc</td>
| + | |
| - | <td class="normal">Promoter-E:KRAB binding affinity</td>
| + | |
| - | <td class="normal">1.0</td>
| + | |
| - | <td class="normal">-</td>
| + | |
| - | <td class="normal">Identical to Kpc</td>
| + | |
| - | </tr><tr class="normal">
| + | |
| - | <td class="normal">Alphapc</td>
| + | |
| - | <td class="normal">Basal activity of PIP:KRAB inducible promoter</td>
| + | |
| - | <td class="normal">0.085</td>
| + | |
| - | <td class="normal">nM</td>
| + | |
| - | <td class="normal">Literature data (Tigges et. al, 2009) </td>
| + | |
| - | </tr><tr class="normal">
| + | |
| - | <td class="normal">Alphaec</td>
| + | |
| - | <td class="normal">Basal activity of E:KRAB inducible promoter</td>
| + | |
| - | <td class="normal">0.025</td>
| + | |
| - | <td class="normal">nM</td>
| + | |
| - | <td class="normal">Calculated from experimental data</td>
| + | |
| - | </tr><tr class="normal">
| + | |
| - | <td class="normal">npc</td>
| + | |
| - | <td class="normal">PIP:KRAB Cooperativity coefficient</td>
| + | |
| - | <td class="normal">2.0</td>
| + | |
| - | <td class="normal">-</td>
| + | |
| - | <td class="normal">Literature data (Tigges et. al, 2009)</td>
| + | |
| - | </tr><tr class="normal">
| + | |
| - | <td class="normal">nec</td>
| + | |
| - | <td class="normal">E:KRAB Cooperativity coefficient</td>
| + | |
| - | <td class="normal">2.0</td>
| + | |
| - | <td class="normal">-</td>
| + | |
| - | <td class="normal">Identical to npc</td>
| + | |
| - | </tr><tr class="normal">
| + | |
| - | <td class="normal">fv</td>
| + | |
| - | <td class="normal">Concentration scaling factor</td>
| + | |
| - | <td class="normal">92500</td>
| + | |
| - | <td class="normal">-</td>
| + | |
| - | <td class="normal">Literature data (Tigges et. al, 2009)</td>
| + | |
| - | </tr><tr class="normal">
| + | |
| - | <td class="normal">tau</td>
| + | |
| - | <td class="normal">Active state concentration threshold</td>
| + | |
| - | <td class="normal">100.0</td>
| + | |
| - | <td class="normal">nM</td>
| + | |
| - | <td class="normal">Adjustable user defined state threshold</td>
| + | |
| - | </table>
| + | |
| - | <table class="invisible" style="width:100%; text-align:center;">
| + | |
| - | <tbody class="invisible">
| + | |
| - | <tr class="normal"><td class="invisible">
| + | |
| - | <b>Table 2.</b> Parameters and their initial values
| + | |
| - | </td></tr>
| + | |
| - | </tbody>
| + | |
| - | </table>
| + | |
| - | <!-- end table-->
| + | |
| - | | + | |
| - | | + | |
| - | | + | |
| - | <!-- table begin-->
| + | |
| - | <table class="normal" style="font-size:90%;">
| + | |
| - | <thead class="normal">
| + | |
| - | <tr class="normal">
| + | |
| - | <th class="normal">Symbol</th>
| + | |
| - | <th class="normal">Parameter</th>
| + | |
| - | <th class="normal">Initial value</th>
| + | |
| - | <th class="normal">Units</th>
| + | |
| - | <th class="normal">Source/reference</th>
| + | |
| - | </tr>
| + | |
| - | </thead>
| + | |
| - | <tbody class="normal">
| + | |
| - | <tr class="normal">
| + | |
| - | <td class="normal">G1</td>
| + | |
| - | <td class="normal">Plasmid 1 dosage</td>
| + | |
| - | <td class="normal">190.0</td>
| + | |
| - | <td class="normal">ng</td>
| + | |
| - | <td class="normal">Literature data (Tigges et. al, 2009)</td>
| + | |
| - | </tr><tr class="normal">
| + | |
| - | <td class="normal">G2</td>
| + | |
| - | <td class="normal">Plasmid 2 dosage</td>
| + | |
| - | <td class="normal">180.0 </td>
| + | |
| - | <td class="normal">ng</td>
| + | |
| - | <td class="normal">Literature data (Tigges et. al, 2009)</td>
| + | |
| - | </tr><tr class="normal">
| + | |
| - | <td class="normal">G3</td>
| + | |
| - | <td class="normal">Plasmid 3 dosage</td>
| + | |
| - | <td class="normal">180.0 </td>
| + | |
| - | <td class="normal">ng</td>
| + | |
| - | <td class="normal">Literature data (Tigges et. al, 2009)</td>
| + | |
| - | </tr><tr class="normal">
| + | |
| - | <td class="normal">G4</td>
| + | |
| - | <td class="normal"> Plasmid 4 dosage</td>
| + | |
| - | <td class="normal">180.0 </td>
| + | |
| - | <td class="normal">ng</td>
| + | |
| - | <td class="normal">Literature data (Tigges et. al, 2009)</td>
| + | |
| - | </tr><tr class="normal">
| + | |
| - | <td class="normal">G5</td>
| + | |
| - |
| + | |
| - | <td class="normal">Plasmid 5 dosage</td>
| + | |
| - | <td class="normal">180.0 </td><td class="normal">ng</td>
| + | |
| - | <td class="normal">Literature data (Tigges et. al, 2009)</td>
| + | |
| - | </tr><tr class="normal">
| + | |
| - | <td class="normal">k1</td>
| + | |
| - | <td class="normal">Plasmid 1 basal transcritiption rate</td>
| + | |
| - | <td class="normal">30.0</td>
| + | |
| - | <td class="normal">mRNA/min</td>
| + | |
| - | <td class="normal">Literature data (Tigges et. al, 2009)</td>
| + | |
| - | </tr><tr class="normal">
| + | |
| - | <td class="normal">k2</td>
| + | |
| - | <td class="normal">Plasmid 2 basal transcritiption rate</td>
| + | |
| - | <td class="normal">30.0</td>
| + | |
| - | <td class="normal">mRNA/min</td>
| + | |
| - | <td class="normal">Literature data (Tigges et. al, 2009)</td>
| + | |
| - | </tr><tr class="normal">
| + | |
| - | <td class="normal">k3</td>
| + | |
| - | <td class="normal">Plasmid 3 basal transcritiption rate</td>
| + | |
| - | <td class="normal">30.0</td>
| + | |
| - | <td class="normal">mRNA/min</td>
| + | |
| - | <td class="normal">Literature data (Tigges et. al, 2009)</td>
| + | |
| - | </tr><tr class="normal">
| + | |
| - | <td class="normal">k4</td>
| + | |
| - | <td class="normal">Plasmid 4 basal transcritiption rate</td>
| + | |
| - | <td class="normal">30.0</td>
| + | |
| - | <td class="normal">mRNA/min</td>
| + | |
| - | <td class="normal">Literature data (Tigges et. al, 2009)</td>
| + | |
| - | </tr><tr class="normal">
| + | |
| - | <td class="normal">k5</td>
| + | |
| - | <td class="normal">Plasmid 5 basal transcritiption rate</td>
| + | |
| - | <td class="normal">30.0</td>
| + | |
| - | <td class="normal">mRNA/min</td>
| + | |
| - | <td class="normal">Literature data (Tigges et. al, 2009)</td>
| + | |
| - | </tr>
| + | |
| - | <tr class="normal">
| + | |
| - | <td class="normal"> aB</td>
| + | |
| - | <td class="normal">TAL-B:Vp16 activation rate</td>
| + | |
| - | <td class="normal"> -</td>
| + | |
| - | <td class="normal"> -</td>
| + | |
| - | <td class="normal">Calculated from experimental data</td>
| + | |
| - | </tr><tr class="normal">
| + | |
| - | <td class="normal">aA</td>
| + | |
| - | <td class="normal">TAL-A:VP16 activation rate</td>
| + | |
| - | <td class="normal">-</td>
| + | |
| - | <td class="normal">-</td>
| + | |
| - | <td class="normal">Calculated from experimental data</td>
| + | |
| - | </tr><tr class="normal">
| + | |
| - | <tr class="normal">
| + | |
| - | <td class="normal"> sB</td>
| + | |
| - | <td class="normal">TAL-B:KRAB scaling constant</td>
| + | |
| - | <td class="normal"> -</td>
| + | |
| - | <td class="normal"> -</td>
| + | |
| - | <td class="normal">Calculated from experimental data</td>
| + | |
| - | </tr><tr class="normal">
| + | |
| - | <td class="normal">sA</td>
| + | |
| - | <td class="normal">TAL-A:KRAB scaling constant</td>
| + | |
| - | <td class="normal">-</td>
| + | |
| - | <td class="normal">-</td>
| + | |
| - | <td class="normal">Calculated from experimental data</td>
| + | |
| - | </tr><tr class="normal">
| + | |
| - | <td class="normal">nB</td>
| + | |
| - | <td class="normal">TAL-B:KRAB Hill coefficient</td>
| + | |
| - | <td class="normal">3.0
| + | |
| - | <td class="normal">-</td>
| + | |
| - | <td class="normal">Literature data [3]</td>
| + | |
| - | </tr><tr class="normal">
| + | |
| - | <td class="normal">nA
| + | |
| - | <td class="normal">TAL-A:KRAB Hill coefficient</td>
| + | |
| - | <td class="normal">3.0
| + | |
| - | <td class="normal">-</td>
| + | |
| - | <td class="normal">Literature data [3]</td>
| + | |
| - | </tr><tr class="normal">
| + | |
| - | <td class="normal">tB</td>
| + | |
| - | <td class="normal">TAL-B threshold concentration</td>
| + | |
| - | <td class="normal">100.0</td>
| + | |
| - | <td class="normal">nM</td>
| + | |
| - | <td class="normal">Adjusted by user defined state threshold</td>
| + | |
| - | </tr><tr class="normal">
| + | |
| - | <td class="normal">tA</td>
| + | |
| - | <td class="normal">TAL-A threshold concentration</td>
| + | |
| - | <td class="normal"> 100.0</td>
| + | |
| - | <td class="normal">nM</td>
| + | |
| - | <td class="normal">Adjusted by user defined state threshold</td>
| + | |
| - | </tr><tr class="normal">
| + | |
| - | <td class="normal">dm</td>
| + | |
| - | <td class="normal"> mRNA degradation rate</td>
| + | |
| - | <td class="normal"> 0.0173</td>
| + | |
| - | <td class="normal"> mRNA/min</td>
| + | |
| - | <td class="normal"> Literature data (Tigges et. al, 2009)</td>
| + | |
| - | </tr><tr class="normal">
| + | |
| - | <td class="normal">dp</td>
| + | |
| - | <td class="normal">Protein degradation rate</td>
| + | |
| - | <td class="normal">0.0058</td>
| + | |
| - | <td class="normal">nM</td>
| + | |
| - | <td class="normal">Literature data (Tigges et. al, 2009)</td>
| + | |
| - | </tr><tr class="normal">
| + | |
| - | <td class="normal">tp</td>
| + | |
| - | <td class="normal">Translation rate</td>
| + | |
| - | <td class="normal">0.2</td>
| + | |
| - | <td class="normal">nM</td>
| + | |
| - | <td class="normal">Literature data (Tigges et. al, 2009)</td>
| + | |
| - | </tr><tr class="normal">
| + | |
| - | <td class="normal">Apc</td>
| + | |
| - | <td class="normal">Pristinamicyn-PIP:KRAB binding affinity</td>
| + | |
| - | <td class="normal">1.0</td>
| + | |
| - | <td class="normal">-</td>
| + | |
| - | <td class="normal">Literature data (Tigges et. al, 2009)</td>
| + | |
| - | </tr><tr class="normal">
| + | |
| - | <td class="normal">Aec</td>
| + | |
| - | <td class="normal">Erythromycin-E:KRAB binding affinity</td>
| + | |
| - | <td class="normal">1.0</td>
| + | |
| - | <td class="normal">-</td>
| + | |
| - | <td class="normal">Indentical to Apc</td>
| + | |
| - | </tr><tr class="normal">
| + | |
| - | <td class="normal">Kpc</td>
| + | |
| - | <td class="normal">Promoter-PIP:KRAB binding affinity</td>
| + | |
| - | <td class="normal">1.0 </td>
| + | |
| - | <td class="normal">-</td>
| + | |
| - | <td class="normal">Literature data (Tigges et. al, 2009)</td>
| + | |
| - | </tr><tr class="normal">
| + | |
| - | <td class="normal">Krc</td>
| + | |
| - | <td class="normal">Promoter-E:KRAB binding affinity</td>
| + | |
| - | <td class="normal">1.0</td>
| + | |
| - | <td class="normal">-</td>
| + | |
| - | <td class="normal">Identical to Kpc</td>
| + | |
| - | </tr><tr class="normal">
| + | |
| - | <td class="normal">Alphapc</td>
| + | |
| - | <td class="normal">Basal activity of PIP:KRAB inducible promoter</td>
| + | |
| - | <td class="normal">0.085</td>
| + | |
| - | <td class="normal">nM</td>
| + | |
| - | <td class="normal">Literature data (Tigges et. al, 2009) </td>
| + | |
| - | </tr><tr class="normal">
| + | |
| - | <td class="normal">Alphaec</td>
| + | |
| - | <td class="normal">Basal activity of E:KRAB inducible promoter</td>
| + | |
| - | <td class="normal">0.025</td>
| + | |
| - | <td class="normal">nM</td>
| + | |
| - | <td class="normal">Calculated from experimental data</td>
| + | |
| - | </tr><tr class="normal">
| + | |
| - | <td class="normal">npc</td>
| + | |
| - | <td class="normal">PIP:KRAB Cooperativity coefficient</td>
| + | |
| - | <td class="normal">2.0</td>
| + | |
| - | <td class="normal">-</td>
| + | |
| - | <td class="normal">Literature data (Tigges et. al, 2009)</td>
| + | |
| - | </tr><tr class="normal">
| + | |
| - | <td class="normal">nec</td>
| + | |
| - | <td class="normal">E:KRAB Cooperativity coefficient</td>
| + | |
| - | <td class="normal">2.0</td>
| + | |
| - | <td class="normal">-</td>
| + | |
| - | <td class="normal">Identical to npc</td>
| + | |
| - | </tr><tr class="normal">
| + | |
| - | <td class="normal">fv</td>
| + | |
| - | <td class="normal">Concentration scaling factor</td>
| + | |
| - | <td class="normal">92500</td>
| + | |
| - | <td class="normal">-</td>
| + | |
| - | <td class="normal">Literature data (Tigges et. al, 2009)</td>
| + | |
| - | </tr><tr class="normal">
| + | |
| - | <td class="normal">tau</td>
| + | |
| - | <td class="normal">Active state concentration threshold</td>
| + | |
| - | <td class="normal">100.0</td>
| + | |
| - | <td class="normal">nM</td>
| + | |
| - | <td class="normal">Adjustable user defined state threshold</td>
| + | |
| - | </table>
| + | |
| - | <table class="invisible" style="width:100%; text-align:center;">
| + | |
| - | <tbody class="invisible">
| + | |
| - | <tr class="normal"><td class="invisible">
| + | |
| - | <b>Table 4.</b> Parameters and their initial values
| + | |
| - | </td></tr>
| + | |
| - | </tbody>
| + | |
| - | </table>
| + | |
| - | <!-- end table-->
| + | |
| - | | + | |
| - | | + | |
| - | <h3>Model ordinary differential equations</h3>
| + | |
| - | <h4>Inducible system</h4>
| + | |
| - | | + | |
| - | <center><img src="https://static.igem.org/mediawiki/2012/f/f4/Svn12_qm_15Appendix2-4.png" style="width:700px; "/></center><br/>
| + | |
| - | <h4>The Switch</h4>
| + | |
| - | <center><img src="https://static.igem.org/mediawiki/2012/5/5e/Svn12_qm_16Appendix2-5.png" style="width:700px; "/></center><br/>
| + | |
| - | <h4>Reporters</h4>
| + | |
| - | <center><img src="https://static.igem.org/mediawiki/2012/c/c9/Svn12_qm_16Appendix2-6_svn12_qm_16copy.png" style="width:700px; "/></center><br/>
| + | |
| - | | + | |
| - | <h2 style="color:grey;">References</h2>
| + | |
| | <p style="color:grey;"> | | <p style="color:grey;"> |
| | Alon U. (2007), An introduction to systems biology: design principles of biological circuits. Chapman & Hall/CRC. | | Alon U. (2007), An introduction to systems biology: design principles of biological circuits. Chapman & Hall/CRC. |
 "
"