Team:Arizona State/HPModeling
From 2012.igem.org
Modeling
System Kinetics
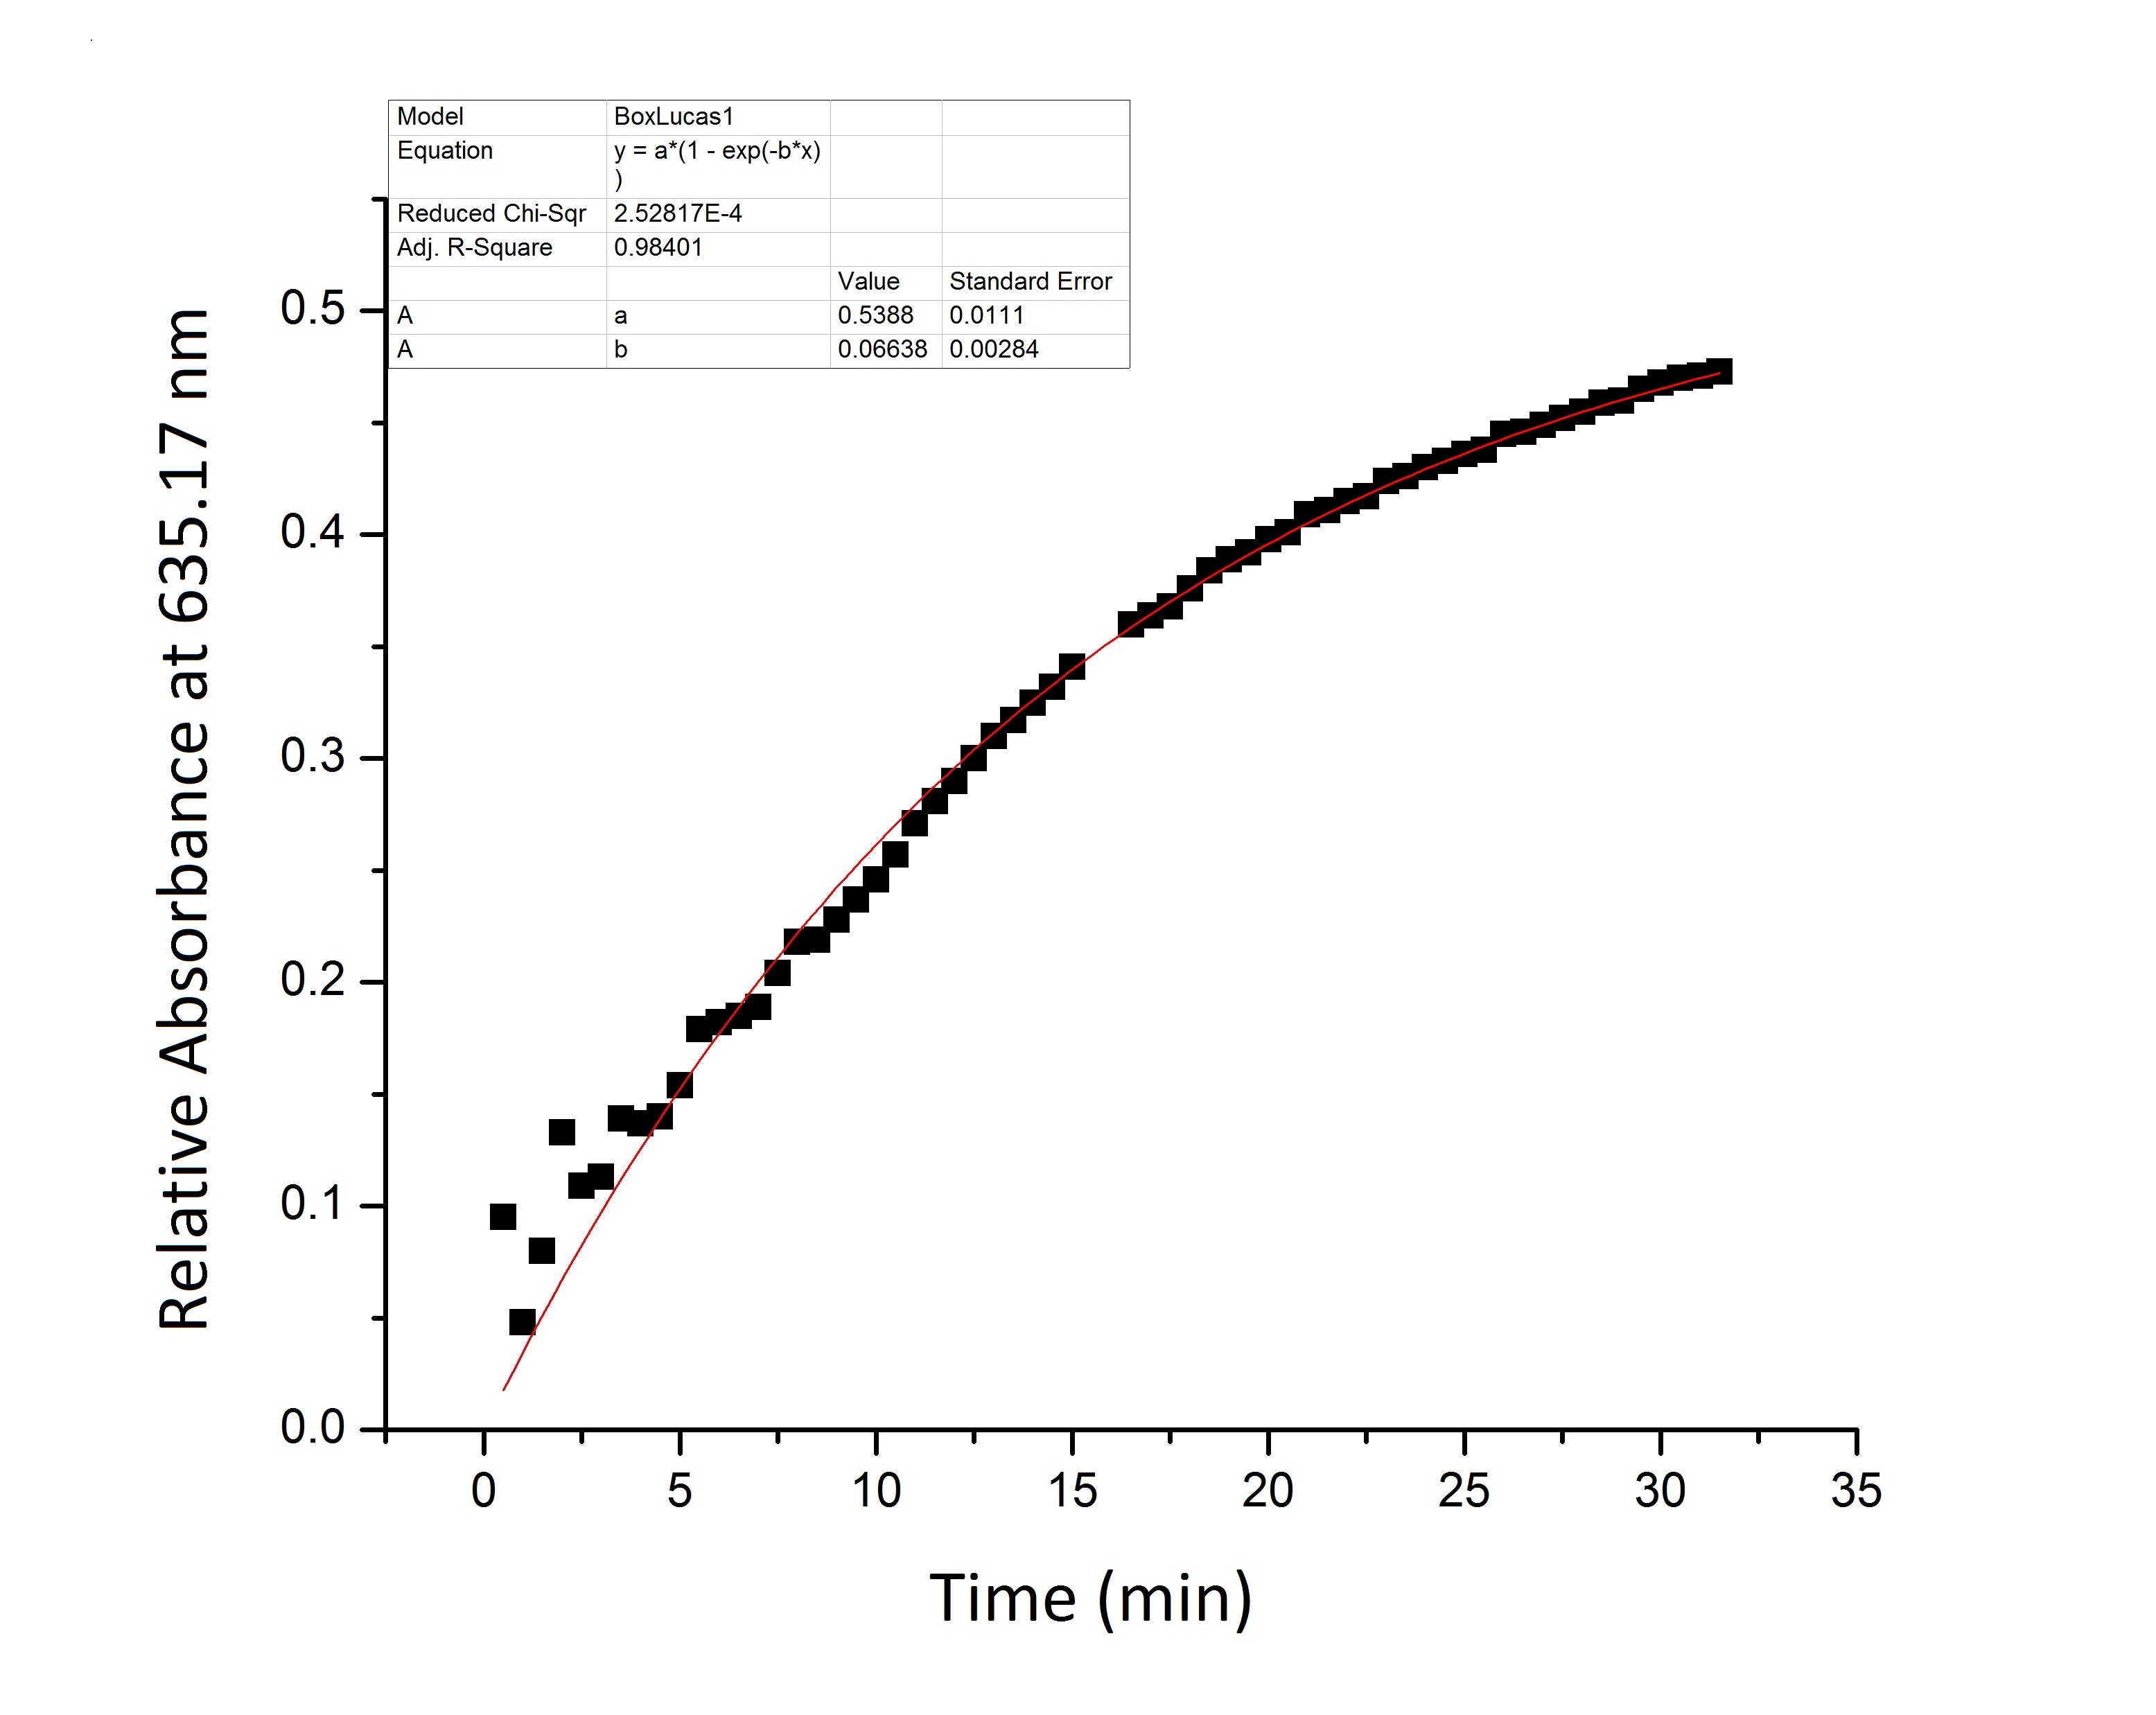
- Figure 1: Full beta-galactosidase enzyme activity measured over time by measuring change in relative absorbance over time as xgal substrate is consumed.
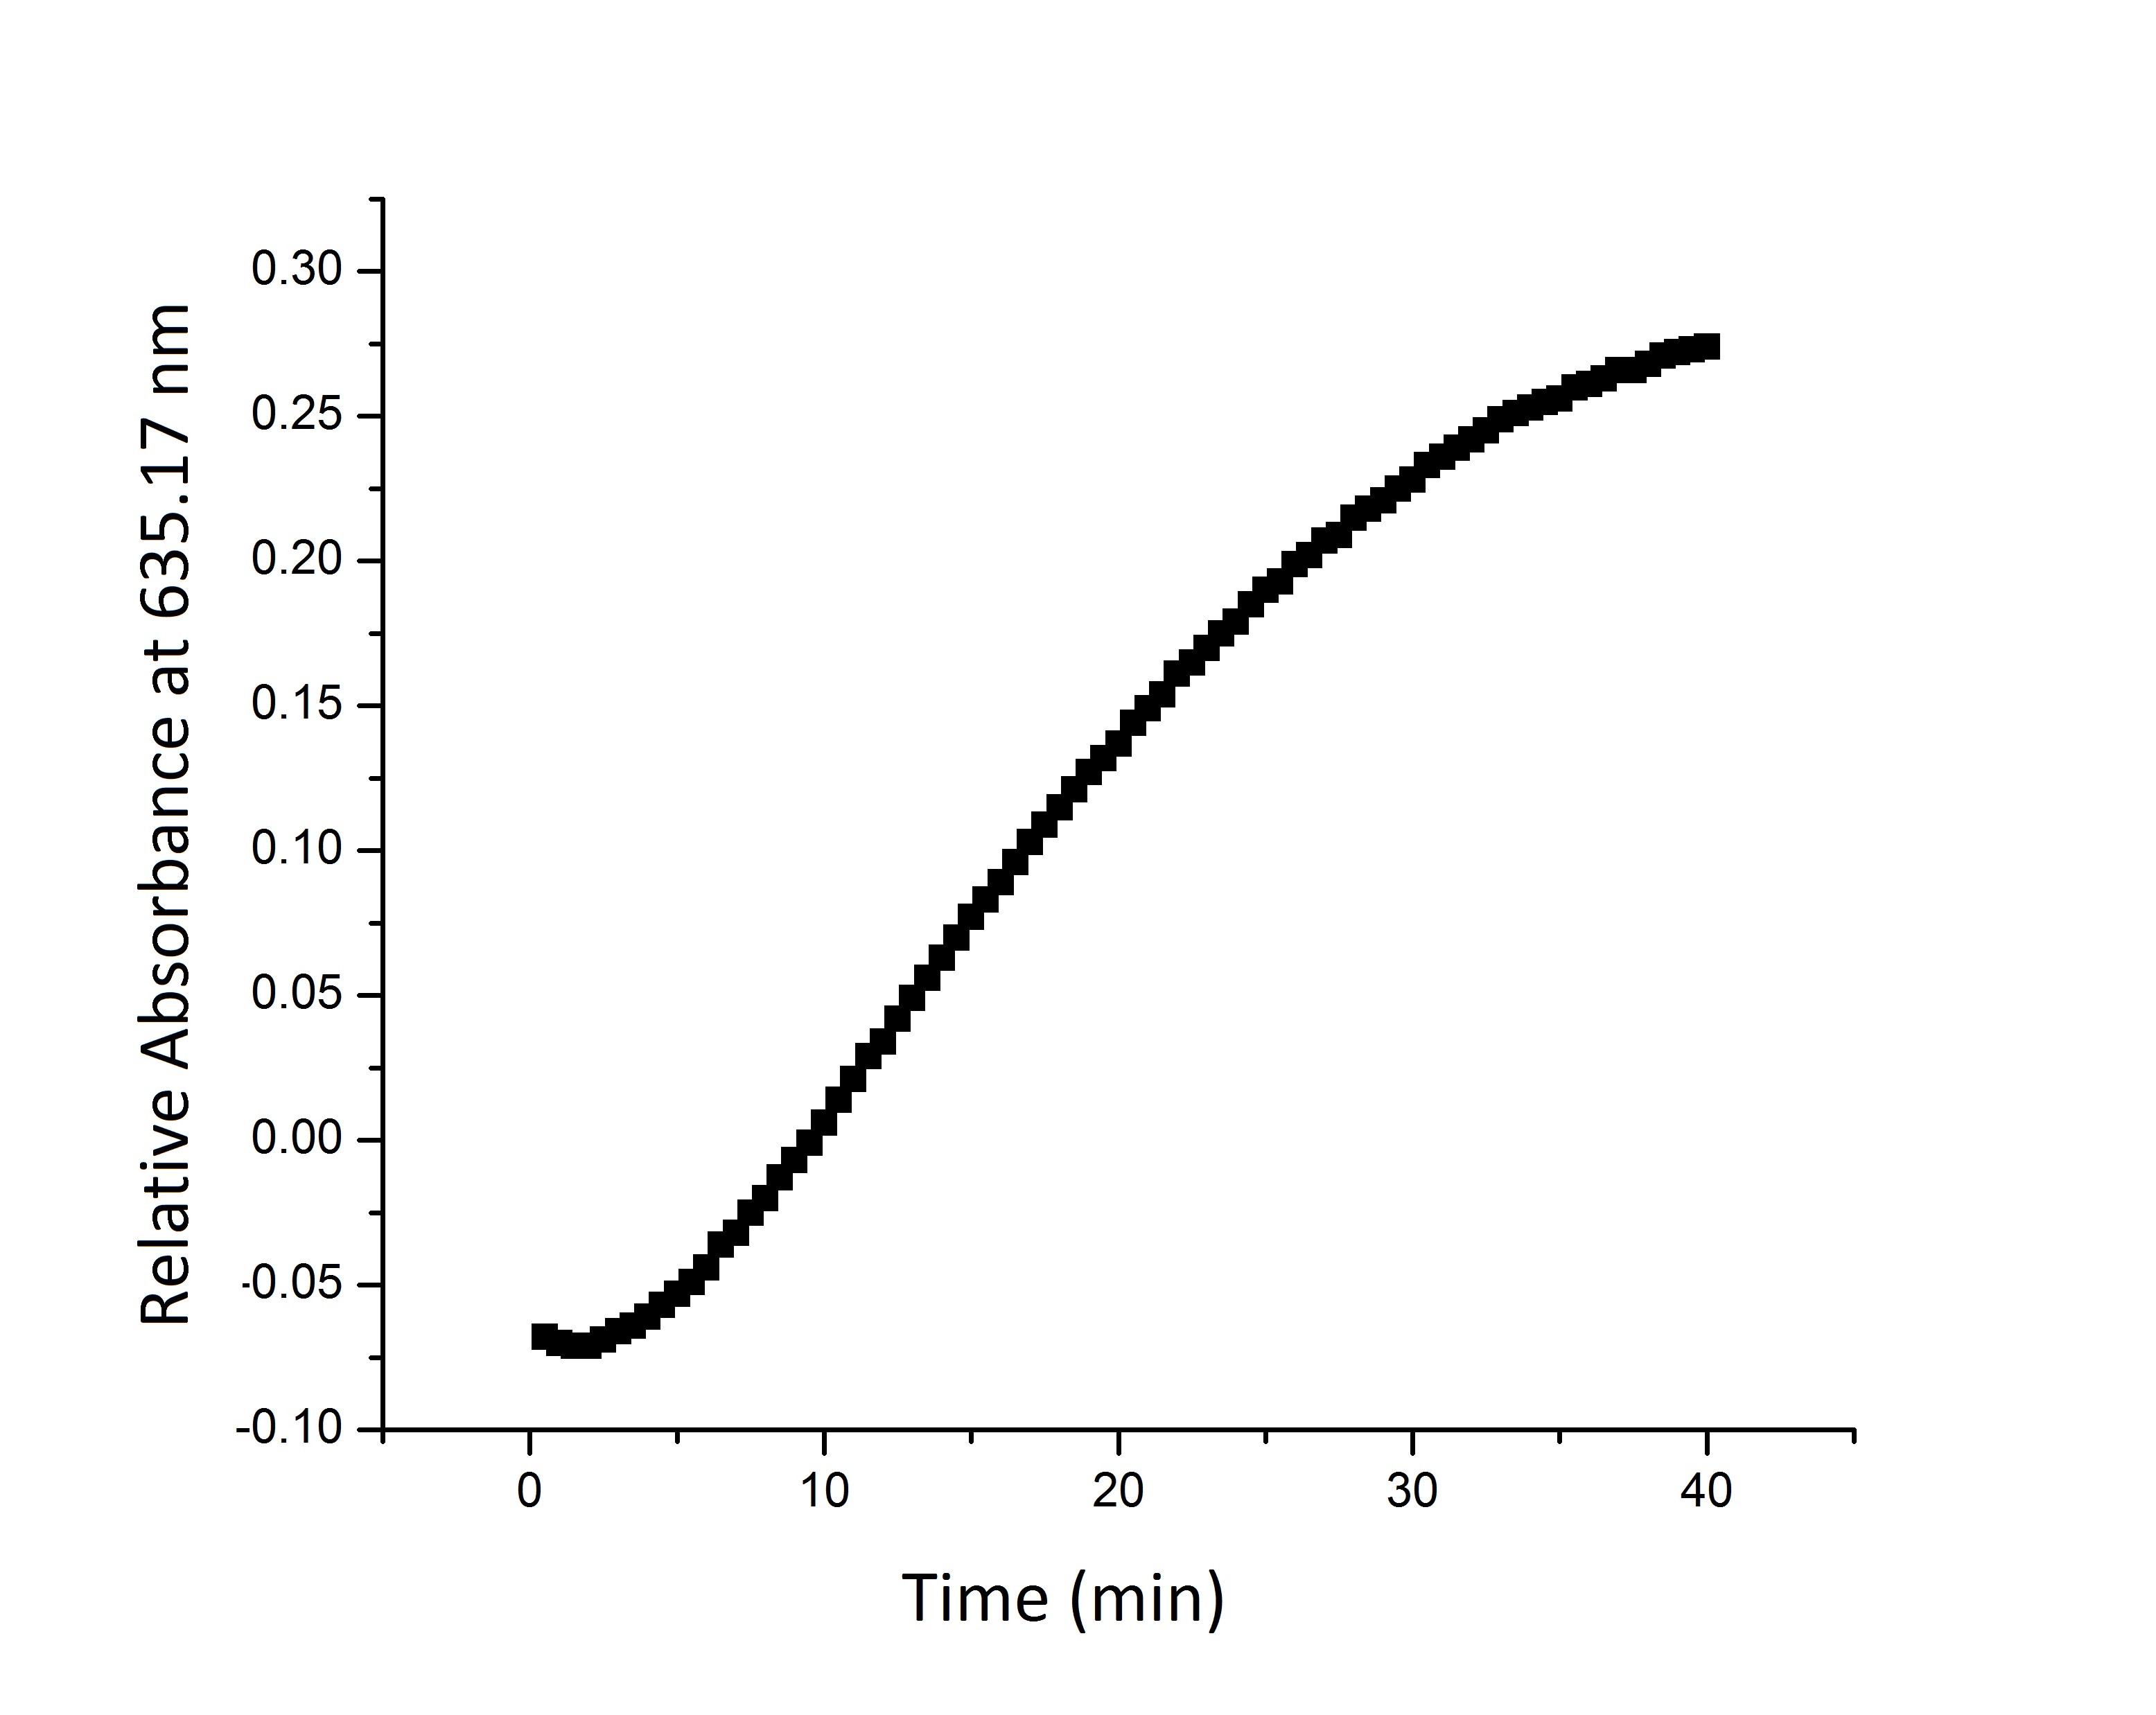
- Figure 2: Split beta-galactosidase activity measured over time by measuring change in relative absorbance over time as xgal substrate is consumed.
We suspect that the enzyme kinetics vary between the full and split enzyme constructs. None of the models that we tested were able to fit the absorbance data that we generated. Further testing and mathematical analysis and modeling will yield a more accurate model of split enzyme activity.
Bayesian analysis
We can use Bayesian techniques to estimate natural frequency of the quantity to be measured (pathogen presence) as well as to analyze the accuracy and reliability of our device.
Baye's rule gives us the probability of an actual positive event given that our sensor outputs "true". To evaluate this probability we need three pieces of data: specificity (A), sensitivity (B), and the "natural frequency" (C) of the event. Sensitivity and specificity are evaluated based on experimental results and are defined below. Estimation of the "natural frequency" of a disease vector is more complex, and can be handled using a Bayesian network or other sophisticated statistical devices. This Bayesian network should be constructed using data from studies such as those referenced in Escherichia Coli Case Studies.
| Condition | ||||
| Condition Positive | Condition Negative | |||
| Sensor Outcome | Sensor Outcome Positive | True Positive | False Positive | Positive predictability = TP TP + FP
|
| Sensor Outcome Negative | False Negative | True Negative | Negative predictability = TN TN + FN
| |
| Sensitivity = TP TP + TN
| Specificity = TN TN + FP
| |||
- Sensitivity: proportion of true positives accurately measured
- Specificity: proportion of true negatives accurately measured
- Positive predictability: proportion of positive sensor results that are true positives
- Negative predictability: proportion of negative sensor results that are true negatives
Once we have experimental data giving us values for the table above, we can use Bayes' theorem to estimate the probability of an actual event given a positive sensor reading. To aid in these calculations we have attached an excel spreadsheet: Bayes' rule.
 "
"


