Team:Buenos Aires/Results/Strains
From 2012.igem.org

Description of strains
Through our experiments we worked with the following strains kindly provided by [http://www.ifibyne.fcen.uba.ar/new/temas-de-investigacion/laboratorio-de-fisiologia-y-biologia-molecular-lfbm/biologia-de-sistemas/dr-alejandro-colman-lerner/ Alejandro Colman-Lerner's] Lab:
Measurment of strains fluorescence
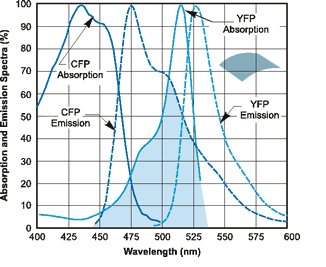
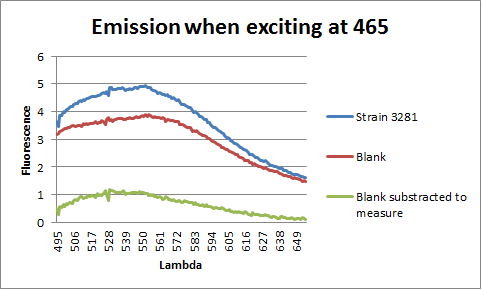
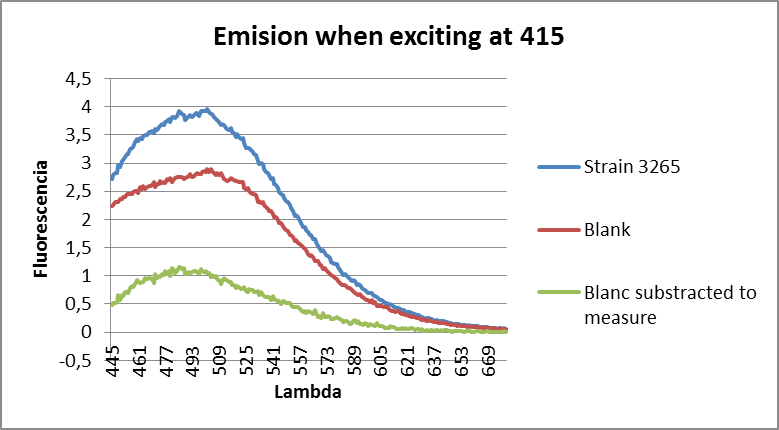
We measured Strains 3281 (YFP) and 3265 (CFP) and got a spectrum of each one prooving that these strains can be distinguished by their fluorescence in culture.
Reference graph Image: YFP and CFP Emission and Absorption Spectra. Obtained from http://flowcyt.salk.edu/fluo.html
|
Results
| 
|
| YFP Fluorescence Screening | CFP Fluorescence Screening |
When measuring YFP Strain 3281, we can see a clear peak around 530 while when measuring CFP Strain 3265, we can see a clear peak around 500, as expected.
Discussion
We were able to measure fluorescence in strains 3281 and 3265 using the spectrofluorometer. However, we considered it would not be precise enough for the purposes of measuring cocultures at different proportions. We also noticed a high background noise produced by dead yeast cells at high concentrations, which would make it possible to measure in this way only at a short range of OD while the culture is at exponential phase.
Screening of strain proportion
A more precise way of measuring the proportion of the strains, is with a epifluorescence microscope.
We mixed strains 3281 (expresses YFP) and 3265 (expresses CFP) in different proportions and analized the images obtained in the microscope, where we counted cells with different fluorescences. We also did a negative control with a non fluorescent strain (TCY 379).
Description of Mixtures
Mix 1: Negative Control
Mix 2: 80% CFP; 20%YFP
Mix 3: 60% CFP; 40%YFP
Mix 4: 50% CFP; 50%YFP
Mix 5: 40% CFP; 60%YFP
Mix 6: 20% CFP; 80%YFP
Results

|
| Mixtures showing YFP and CFP fluorescence. |
As shown by images 1-6, cells showing different fluorescences can be count and distinguished from each other in a mixture of strains, and this could be used to measure strains proportion in a coculture.
Counting of cells
| Fluorescence | Mix 1 | Mix 2 | Mix 3 | Mix 4 | Mix 5 | Mix 6 |
| YFP | 0 | 23 | 67 | 115 | 135 | 110 |
| CFP | 0* | 235 | 82 | 107 | 99 | 78 |
The table shows the number of cells counted by expression of fluorescence YFP and CFP in the different mixtures 1-6. I can be observed that the amount of cells is near the proportion stablished by OD measures when preparing the mixtures. This results confirms that epifluorescence measures are reliable and suitable for our research.
Auxotrophy confirmation
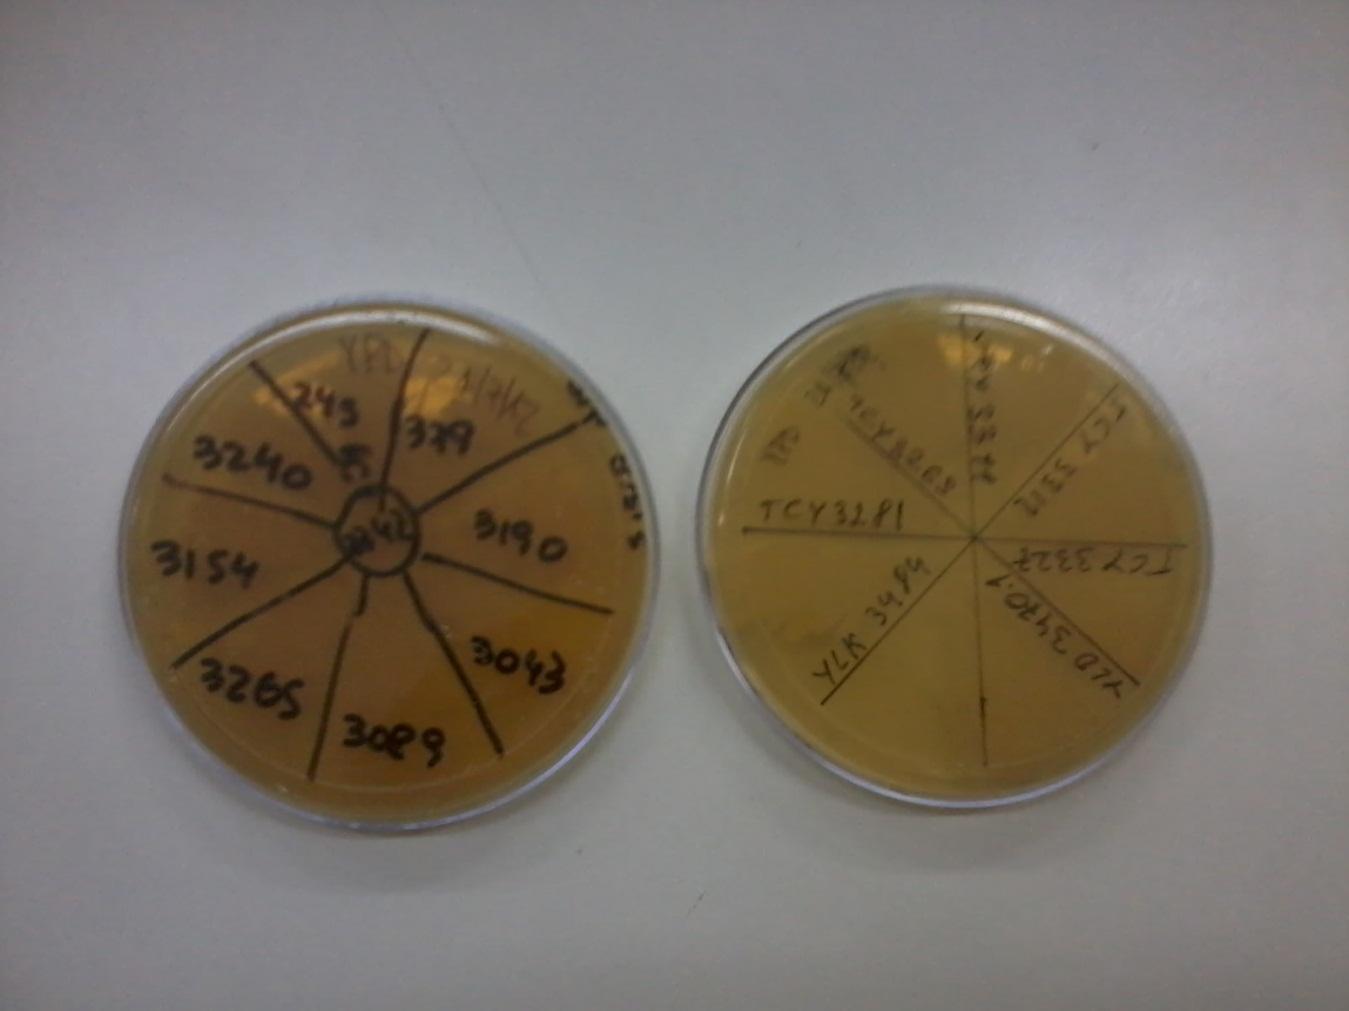
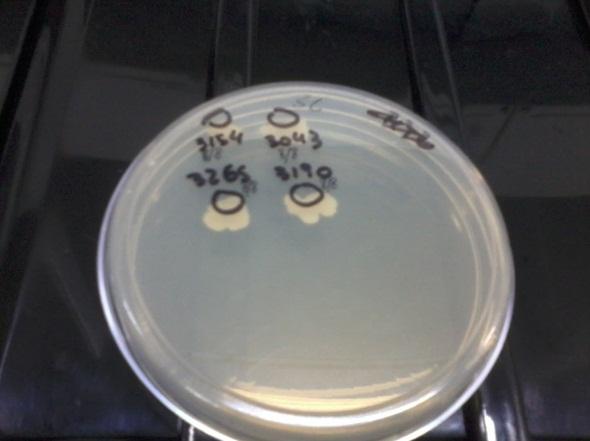
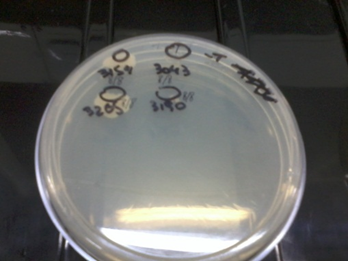
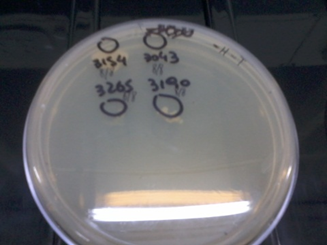
Several times during the experiments we control and checked if the auxotrophies in the selected strain were functional by plating all of them in medium deficient in aminoacids (-H; -T; -H-T and control +H+T). We observed differential growth according to expected due to the description of each strain in point a)
| 
|
| Medium complete | Medium without H |
| 
|
| Medium without T | Medium without H and T |
We observed all the strains grew in the SC plate (top left) and only 3154 (+H+T) grew in the -H-T plate (bottom right). In the -T plate (bottom left), only those strains able to synthesize T grew (3265 and 3154) and in the -H plate (top right) only those able to produce H grew (3190 and 3154), as expected. This means our strains work according to their description. We did this several times during the months to check for reversions or contaminations.
Coculture in liquid medium
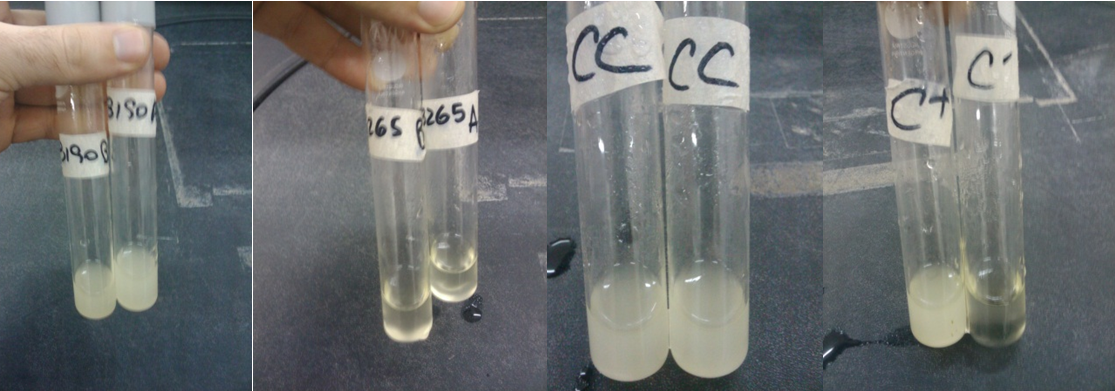
We used for these experiment TCY3190(H+T-) and TCY3265(H-T+) Positive control: TCY3154 (H+T+) and negative control TCY3043(H-T-)
At different initial OD and proportions
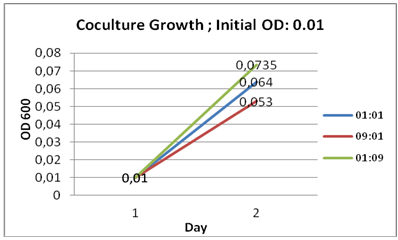
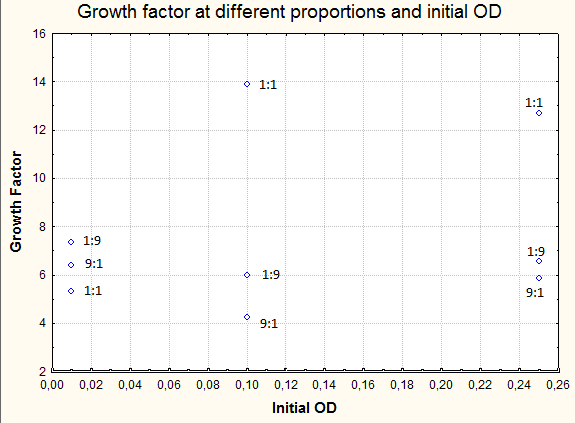
Cultures were set at different initial concentrations (0.25, 0.1 and 0.01) and proportions (1:1; 1:9; 9:1). After 24 hs, we measured OD with the use of a spectrophotometer (two replicas) and we calculated the mean OD and a Growth factor (as Mean OD en time 1 over Initial OD time 0).
| Coculture Proportion (H+T-):(H-T+) | Initial OD(t=0) | OD1 (t=1) | OD2 (t=1) | dilution used for measure t=1 | Mean OD | Growth Factor |
|---|---|---|---|---|---|---|
| 01:01 | 0,25 | 0,32 | 0,314 | 10 | 3,17 | 12,68 |
| 09:01 | 0,25 | 0,148 | 0,144 | 10 | 1,46 | 5,84 |
| 01:09 | 0,25 | 0,138 | 0,189 | 10 | 1,635 | 6,54 |
| 01:01 | 0,1 | 0,109 | 0,169 | 10 | 1,39 | 13,9 |
| 09:01 | 0,1 | 0,04 | 0,045 | 10 | 0,425 | 4,25 |
| 01:09 | 0,1 | 0,067 | 0,053 | 10 | 0,6 | 6 |
| 01:01 | 0,01 | 0,067 | 0,061 | 1 | 0,064 | 6,4 |
| 09:01 | 0,01 | 0,056 | 0,05 | 1 | 0,053 | 5,3 |
| 01:09 | 0,01 | 0,074 | 0,073 | 1 | 0,0735 | 7,35 |

|
| 
|
As shown in graphs there is a basal growth that does not depend on the initial OD or strain proportion, of a growth factor of 6 approximately.
However we observed a much higher growth at the proportion 1:1 when the initial OD 0.25 and 0.1. Therefore we can assume that at these proportions there is a natural cooperation between the strains and that should be the level of growth that we would like to assess through our bioengineering. Besides we would like to be able in the future to tune the strains in order to be able to obtain in the proportions 9:1 and 1:9 similar results to those obtained in the 1:1, at our own will.
At the same initial OD: 0.2, followed over time
We set the same cultures and cocultures as in point i), but starting all of them at the same OD: 0.2 and we followed them over 2 days. At day 1 we took pictures of them and at day 2 we measured the final OD.
We repeated this experiment 4 times with different modifications: increasing the amount of days for up to a week, measuring every 12 hs instead of every 24 hs and using different strains. However, bacterial contaminations and the high rate of revertants prevented us from getting to a valid results in those cases, whereas the experiment up to day 2 always worked correctly. This denotes that we should assess the problem of contamination (for example including ampicilin in the cultures) and revertant rate (revising the design of the experiment or looking for more stable strains) as the impossibility to go further than day 2 may put limitations to some applications of the Synthetic Community. |
Coculture in Agar and Revertant mutation control
Through this experiment we aim to quantify the rate of revertants of each strain, and to asses if cross-feeding between a lawn of cells of one strain and colonies from and other strain is posible.
We used petri dishes with agar medium with (+) and without (-) Trp and His as shown in the following table.
We started a culture of each strain in synthetic complete medium, measured its OD 24 hs after the culture initiated, replaced the synthetic complete medium for one lacking both H and T (to avoid residual growth) and plated ~10^6 cells (lawn) or ~10^2 cells (seed) as shown by the following table (we considered OD600=1 represents 3*10^7 cells). At the same time, 3 controls (one for each strain) were carried in YPD complete medium to check the viability of each strain separately, and to estimate the seed CFU (colony formin units) more precisely.
| Medium H | Medium T | Lawn (10^6 cells) | Seed (10^2 cells) | Description of experiment | Results after 3 days - Replica 1 | Results after 3 days - Replica 2 |
|---|---|---|---|---|---|---|
| (-) | (+) | (-) | Strain –H+T | Control of His revertants | 7 | 7 |
| (+) | (-) | (-) | Strain +H-T | Control of Trp revertants | 2 | 7 |
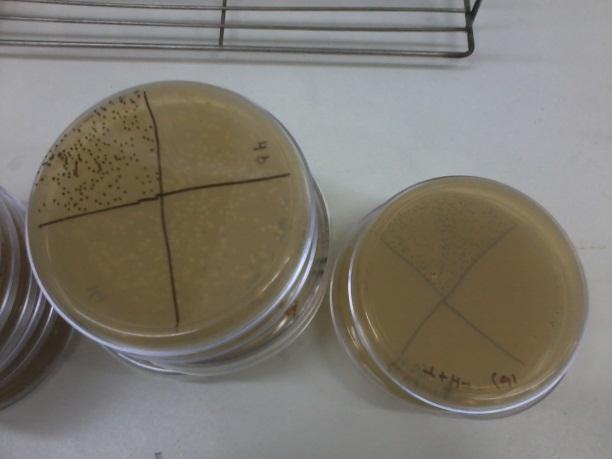
| (-) | (-) | Strain +H-T | Strain –H+T | Coculture; we expect to see natural cooperation | 960 | 800 |
| (-) | (-) | Strain –H+T | Strain +H-T | Coculture; we expect to see natural cooperation | 500 | 712 |
| (-) | (-) | (-) | Strain +H+T | Viability of yeasts in medium | 171 | (-) |
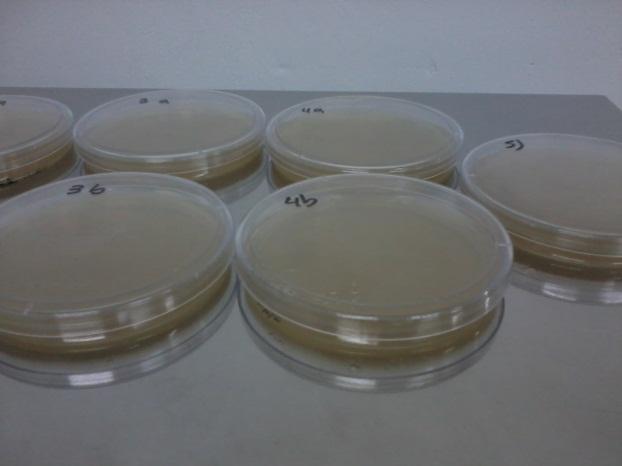
Table: Shows description of each plate content and results in number of colonies counted by plate at day 3. YPD control results plates are not shown in the table.
| 
|
| Petri Dishes | With marks of the counting of colonies |
Results
The viability of the strains was high as expected, as well as the viability of a control positive strain in the –H-T medium. As shown in the table, we have a low, but existent, number of revertants from both his and trp auxotrophy strains. This number should be taken into account when interpreting the results from coculture growth after several days, given that the rate of revertants in liquid medium is probably the same.
Growth in coculture was puzzling, as it resulted in more colonies than the expected. If cooperation was effective, we expected to see as many colonies as "seed" cells, not more. Revertion of cells from the "lawn" doesn't explain the number of colonies either. Probably a combination of both these effects are taking place.
Measurement of Trp in medium and Basal Production
To check the efectiveness of our biobricks, we must first determine the ammount of tryptophan secreted by natural strains to the medium, so we can compare. With that end in mind, we designed a protocol for measurement of tryptophan in medium, based in its fluorescense at 350nm, when excited with 295nm light. As a previous step, we checked that none of the other aminoacids used in the medium interferes, by graphically comparing the spectres for uncomplemented medium and medium complemented with leucine, uracile and histidine, at an appropiate range.
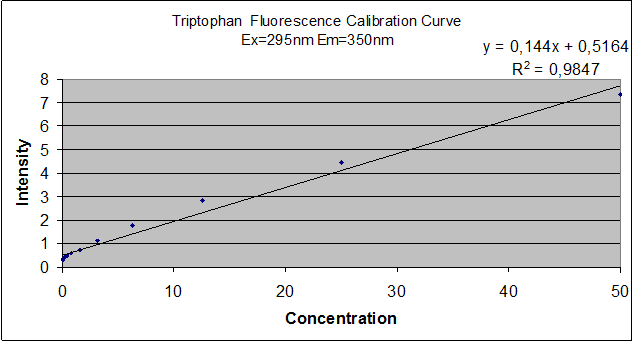
To determine Trp concentration, we must first have a way to transform our readings (intensity) to a more useful output, so we made a calibration curve, through serialized 1:2 dilutions of our medium, which Trp's concentration is 50mg/mL, until approximately constant intensity.
The procedure to measure secretion rates will be growing the strain from a known OD in exponential growth phase in -T medium and plotting it's OD over time, spin-drying at time=t, retrieving the supernatant's Trp concentration and dividing it by the integral of OD vs. time between time=0 and time=t, so we get to a rate which will be proportional to the number of cells in the culture, which means we can actually compare between different strains. Since our medium is free from Trp, all of it should come from within the cells, and if the culture is growing at exponential rates, lysis should be negligible, so the only explanation would be cells exporting their own Trp.
|
| Graph:Tryptophan calibration curve |
Results
As can be seen from the graph the screening of the concentration of the Trp in medium describes an almost lineal function. Through this experiment we can be sure that we would be able to measure increase of Trp in medium as it is exported from the cells, within the biological range of export. The sensitivity of this method seems to be enough to detect concentrations as low as ~0.02mg/mL, and as high as 50mg/mL, maybe more. Since our medium is 50mg/mL, we assume that's the saturation point of the curve. If we get bigger intensities than the one corresponding to it, we will dilute the sample.
Because of time constraints, we haven't been able to check the method with either our designed strains nor the non-exporting ones.
Growth dependence on the Trp and His concentrations
A important thing to characterize of the system is the dependence of the growth rate of the culture with the concentration of the crossfeeding aminoacids, tryptophane (Trp) and histidine (His). To do this we measured the final OD after an overnight growth in medium with different concentrations of Trp and His.
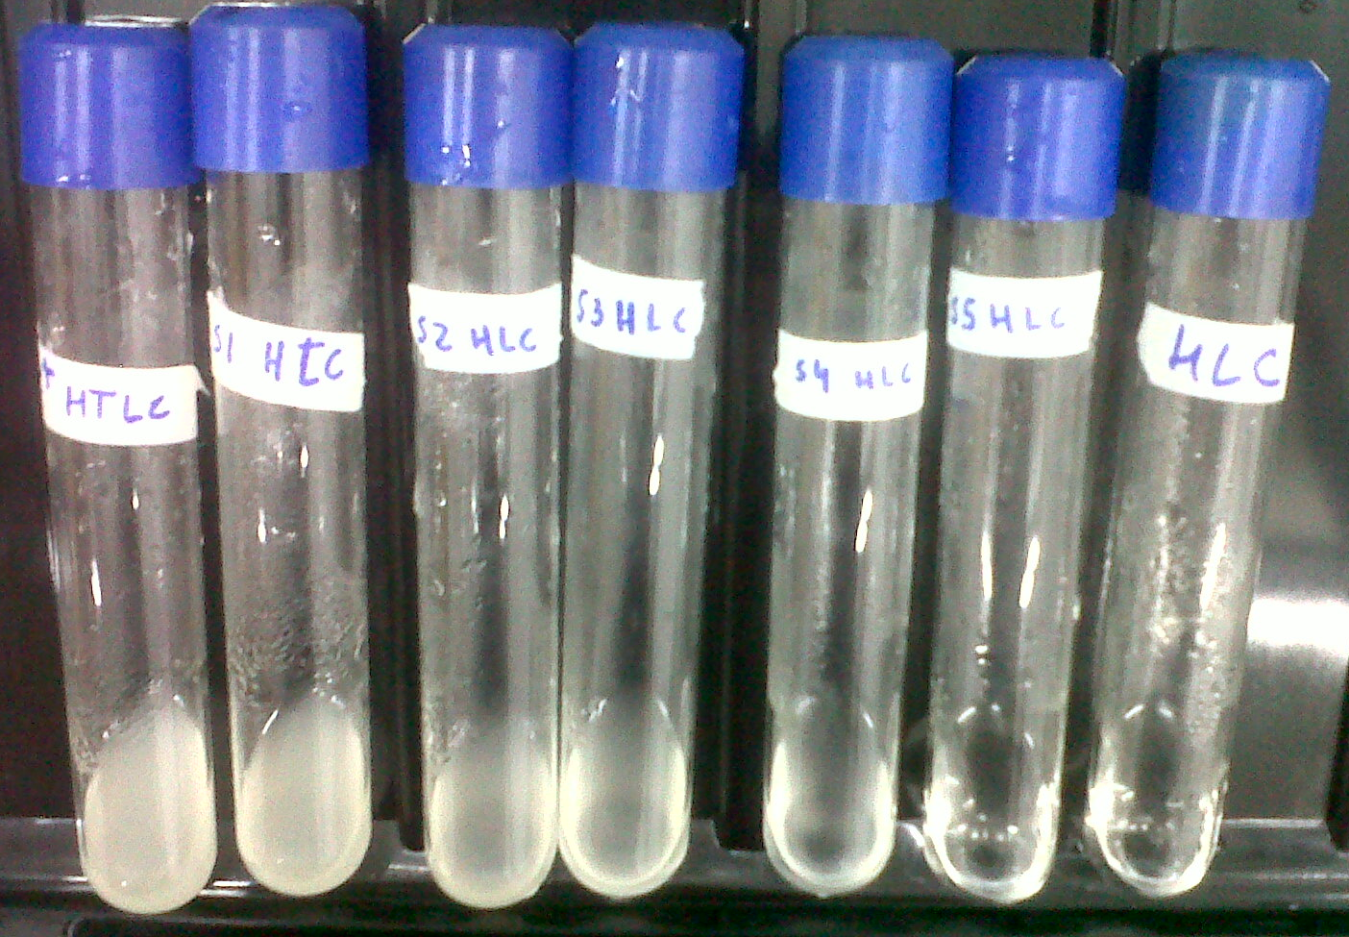
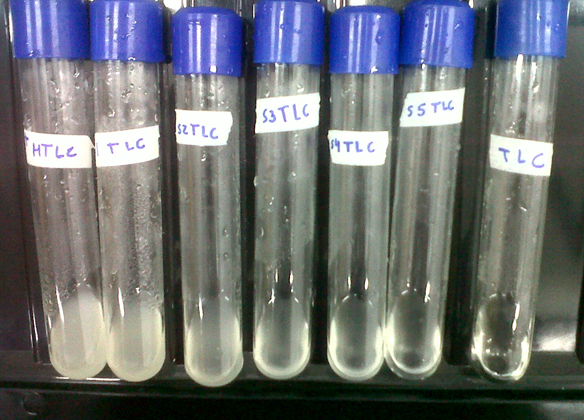
We used strain ACL-379, that is auxotroph for both Trp and His. We prepared serial dilutions of SC medium in –T and –H medium, therefore creating two curves: one with decreasing concentrations of Trp and the other with decreasing concentrations of His. We then inoculated equal amounts of ACL-379 in each tube and incubated them overnight at 30°C with agitation. We took a picture of each tube and measured the OD600 reached by each culture.
| Medium | OD Replica 1 | OD Replica 2 |
|---|---|---|
| SC (no cells) | 0,001 | (-0,0036) |
| -T | (-0,003) | (-0,019) |
| Trp/2 | 2.56 | 2.17 |
| Trp/4 | 3.01 | 3.11 |
| Trp/8 | 1.54 | 1.55 |
| Trp/16 | 0.393 | 0.409 |
| Trp/32 | 0.013 | 0.003 |
| -H | (-0,008) | (-0,012) |
| His/2 | 3.68 | 3.84 |
| His/4 | 2.07 | 2.00 |
| His/8 | 1.17 | 0.97 |
| His/16 | 0.47 | 0.432 |
| His/32 | 0.238 | 0.257 |
| SC (w/cells) | 4.88 | 4.91 |
Results
As expected the growth has a sigmoidal relationship with the concentration of Trp and His, when plotted in semilogarithmic scale. We call EC50 the effective concentration of each aminoacid at which the culture reaches 50% of the maximal growth. We considered these values as proxies of the Khis and Ktrp parameters of the mathematical model, which can be used to estimate the secretion rate of each aminoacid needed to get effective crossfeeding.
These results can also be observed by comparison of images that show the tubes at different OD.
| 
|
| Images from HLU series | Images from TLU series |
Notes: SC: Synthetic complete medium with all the aminoacids. It was used as a blank for the spectrofluorometer.
HTLU is the culture in the medium with all the required aminoacids.
 "
"
