Team:UT-Tokyo/Project/Inhibition/Discussion
From 2012.igem.org
Inhibition without Knockout:
Results & Discussion

Section-1
LacI represses the frequently used promoter, pLac. The binding of LacI to pLac is competitively inhibited and the repression of pLac is weakened by introducing 8 LacI-binding-sites on pSB1C3 (a high-copy-plasmid). By introducing 8 tandem repeats of LacI binding sites on pSB1C3 in addition to pLac-RBS-GFP-d.term on pSB1A2, it is expected that the binding of LacI to pLac is competitively inhibited which can be visually tracked by GFP expression. Moreover, longer LacI binding sites (more than 8 binding sites) is thought to capture more LacI and enhance GFP expression more effectively.
Section-2
rocF is the gene coding the enzyme that converts L-arginine to L-ornithine and urea. By introducing rocF, e.coli obtains the urea cycle. ArgR is the common repressor of the bacterial arginine biosynthetic genes. By introducing ArgR binding sites, the probability that ArgR binds to the operator of the arginine biosynthetic genes falls and arginine biosynthesis is derepressed. (Tokyo Tech 2011) By introducing ArgR binding sites (including 8 binding sites) on pSB1C3 (high-copy-plasmid) in addition to Ptrc-RBS-rocF on pSB6A1 (low-copy-plasmid), ArgR is sequestered by ArgR binding sites and arginine biosynthesis is derepressed, so that urea production rate is expected to rise compared to Ptrc-RBS-rocF on low-copy-plasmid / ArgR binding site on high-copy-plasmid (Tokyo Tech 2011). Furthermore, although a single ArgR binding site introduced downstream of Ptrc-RBS-rocF did not derepress arginine biosynthesis, it is thought that sufficiently long ArgR binding sites introduced downstream the Ptrc-RBS-rocF binds to many more ArgR proteins and derepresses arginine biosynthesis, consequently enhancing the urea production rate.
Modeling
To assess the effectiveness of our method, we made a model and to calculate estimated differences in transcription factor availability with and without adding tandem repeats of binding sites.
We start with up the equilibrium reaction:
Transcription Factor + DNA ←→ Transcription Factor-DNA
By introducing binding sites into high-copy plasmids, the following reactions are added:
 Transcription Factor+ Genome DNA ←→ Transcription Factor-Genome DNA
 Transcription Factor + Binding Site on Plasmid ←→Transcription Factor-Binding Site
Let
- [I]:=concentration of the transcription factor alone
- [G]:=concentration of the genomic DNA alone
- [GI]:=concentration of the transcription factor - genome DNA complex
- [T]:=concentration of the binding site on plasmid alone
- [TI]:concentration of the transcriptional factor - binding site complex
Also, we assumed that the equilibrium constants, k, are equal. k:=[GI]/[I][G]=[TI]/[I][T]
This leads to
- [GI] = k [I][G]
- [TI] = k [I][T]
- [I]+[GI]+[TI]=const=:X (Total concentration of the transcription factor)
- [G]+[GI]=const=:Y (Total concentration of the genomic DNA)
- [T]+[TI]=const=:Z (Total concentration of the binding site on plasmid)
What we want to know is how [GI]/Y changes from a situation where [G]:[T] is 1:0 (wild type) to 1:1000 (introducing 10 tandem binding sites into a 100 copy plasmid), because [GI]/Y represents the proportion of Genomic DNA bound by the transcription factor. Let u:= [GI]/Y.
we set the variables y:=Y/X, z:=Z/X, t:=1/kX.
Now, we solve this equation for the LacI transcription factor because its k is known.
the equilibrium constant ![]() for the equilibrium
for the equilibrium
LacI + DNA ←→ complex LacI-DNA (ref)
The concentration of genomic DNA is ![Alt="0.88x10^(-15)/6.02*10^23 = 1.887*10^(-9) [l/mol]"](/wiki/images/c/cc/UT_Tokyo_GenomeConc.png) (CCDB)
(CCDB)
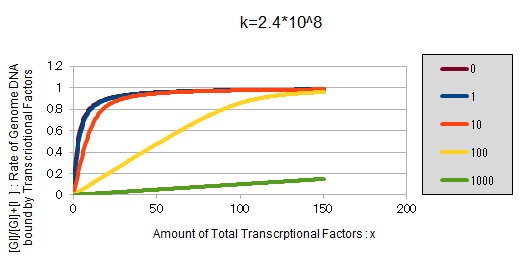
From the above, we caluculated u against X (Total concentration of the transcriptional factor) for several values of Z/Y(the number of binding sites introduced) = 0, 1, 10, 100, 1000 and obtained the graph following
This graph shows the obvious effectiveness of introducing LacI binding sites into a high-copy plasmid (when the copy number ~ 10^2). Also, it shows that If X is high the effect of introducing tandem repeat is greater(by comparing Z/Y = 100 and 1000).
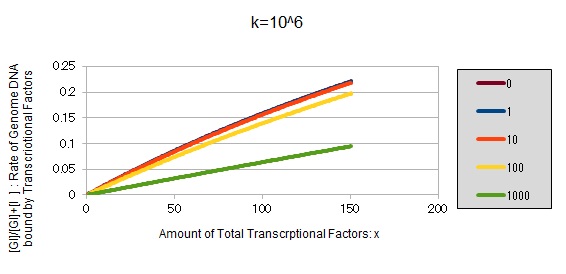
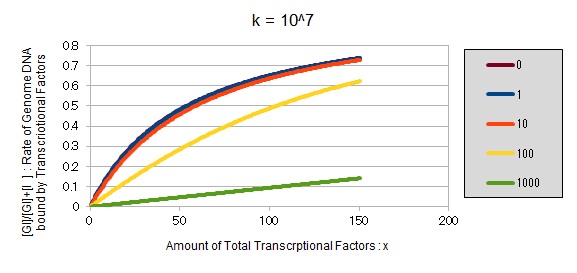
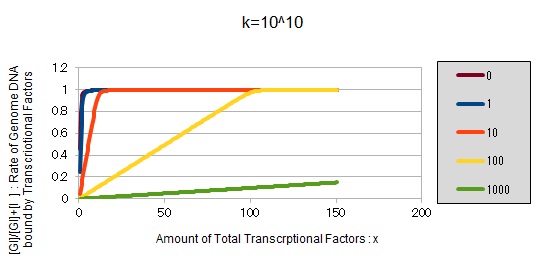
For reference, we write some graphs with larger/smaller k, to apply to other transcriptional factors.
If k==10^6:
If k==10^7:
If k==2.4 * 10^8
If k==10^10:
These graphs show that as k is increased, the effect of introducing binding sites becomes bigger.
 "
"


