Team:TU Darmstadt/Modeling Homologie Modeling
From 2012.igem.org
| Homology Modeling | | Gaussian Networks | | Molecular Dynamics | | Information Theory | | Docking Simulation |
|---|
Contents |
Homology Modeling
While our proteins are functionally described in literature and during the IGEM competition, no structures are available in the protein data bank. For further work and visualizations protein structures are indispensable. We used Yasara Structure [1] to calculate 3-dimensional structures of all of our proteins for the IGEM.
Workflow
Description how our Yasara script calculates homology model[7]:
- Sequence is PSI-BLASTed against Uniprot [2]
- Calculation of a position-specific scoring matrix (PSSM) from related sequences
- Using the PSSM to search the PDB for potential modeling templates
- The Templates are ranked based on the alignment score and the structural quality[3]
- Deriving additional information’s for template and target (prediction of secondary structure, structure-based alignment correction by using SSALN scoring matrices [4]).
- A graph of the side-chain rotamer network is built, dead-end elimination is used to find an initial rotamer solution in the context of a simple repulsive energy function [5]
- The loop-network is optimized using a high amount of different orientations
- Side-chain rotamers are fine-tuned considering electrostatic and knowledge-based packing interactions as well as solvation effects.
- An unrestrained high-resolution refinement with explicit solvent molecules is run, using the latest knowledge-based force fields[6].
Application
All these steps are performed to every template used for the modeling approach. For our project we set the maximum amount of templates to 20. Every derived structure is evaluated using an average per-residue quality Z-scores. At last a hybrid model is built containing the best regions of all predictions. This procedure make prediction’s accurate and thus more realistic. For the evaluation we used the Yasara Z-scores.A Z-score describes how many standard deviations the model quality is away from the average high-resolution X-ray structure. Negative values indicate that the homology model looks worse than a high-resolution X-ray structure. The overall Z-scores for all models have been calculated as the weighted averages of the individual Z-scores using the formula Overall = 0.145*Dihedrals + 0.390*Packing1D + 0.465*Packing3D [7].
Parameters
We used the Yasara script hm_build.mcr for the model creation with the following parameters:
- Modeling speed (slow = best): Slow
- Number of PSI-BLAST iterations in template search (PsiBLASTs): 3
- Maximum allowed PSI-BLAST E-value to consider template (EValue Max): 0.5
- Maximum number of templates to be used (Templates Total): 20
- Maximum number of templates with same sequence (Templates SameSeq): 1
- Maximum oligomerization state (OligoState): 4 (tetrameric)
- Maximum number of alignment variations per template: (Alignments): 5
- Maximum number of conformations tried per loop (LoopSamples): 50
- Maximum number of residues added to the termini (TermExtension): 10
Results
PnB-Esterase 13
The target sequence of the PnB-Esterase 13 contains 490 residues in 1 molecule. Hence the target sequence was the only available information we identified modeling templates by running various PSI-BLAST iterations. We used [http://www.rcsb.org/pdb/explore/explore.do?structureId=1c7j 1C7J] chain A (PNB ESTERASE 56C8), [http://www.rcsb.org/pdb/explore/explore.do?structureId=1qe3 1QE3] (PNB ESTERASE) chain B, [http://www.rcsb.org/pdb/explore/explore.do?structureId=1C7I 1C7I] (THERMOPHYLIC PNB ESTERASE) chain A and 50 more! Unfortunately, our hybrid model could not be improved by copying parts from other models.
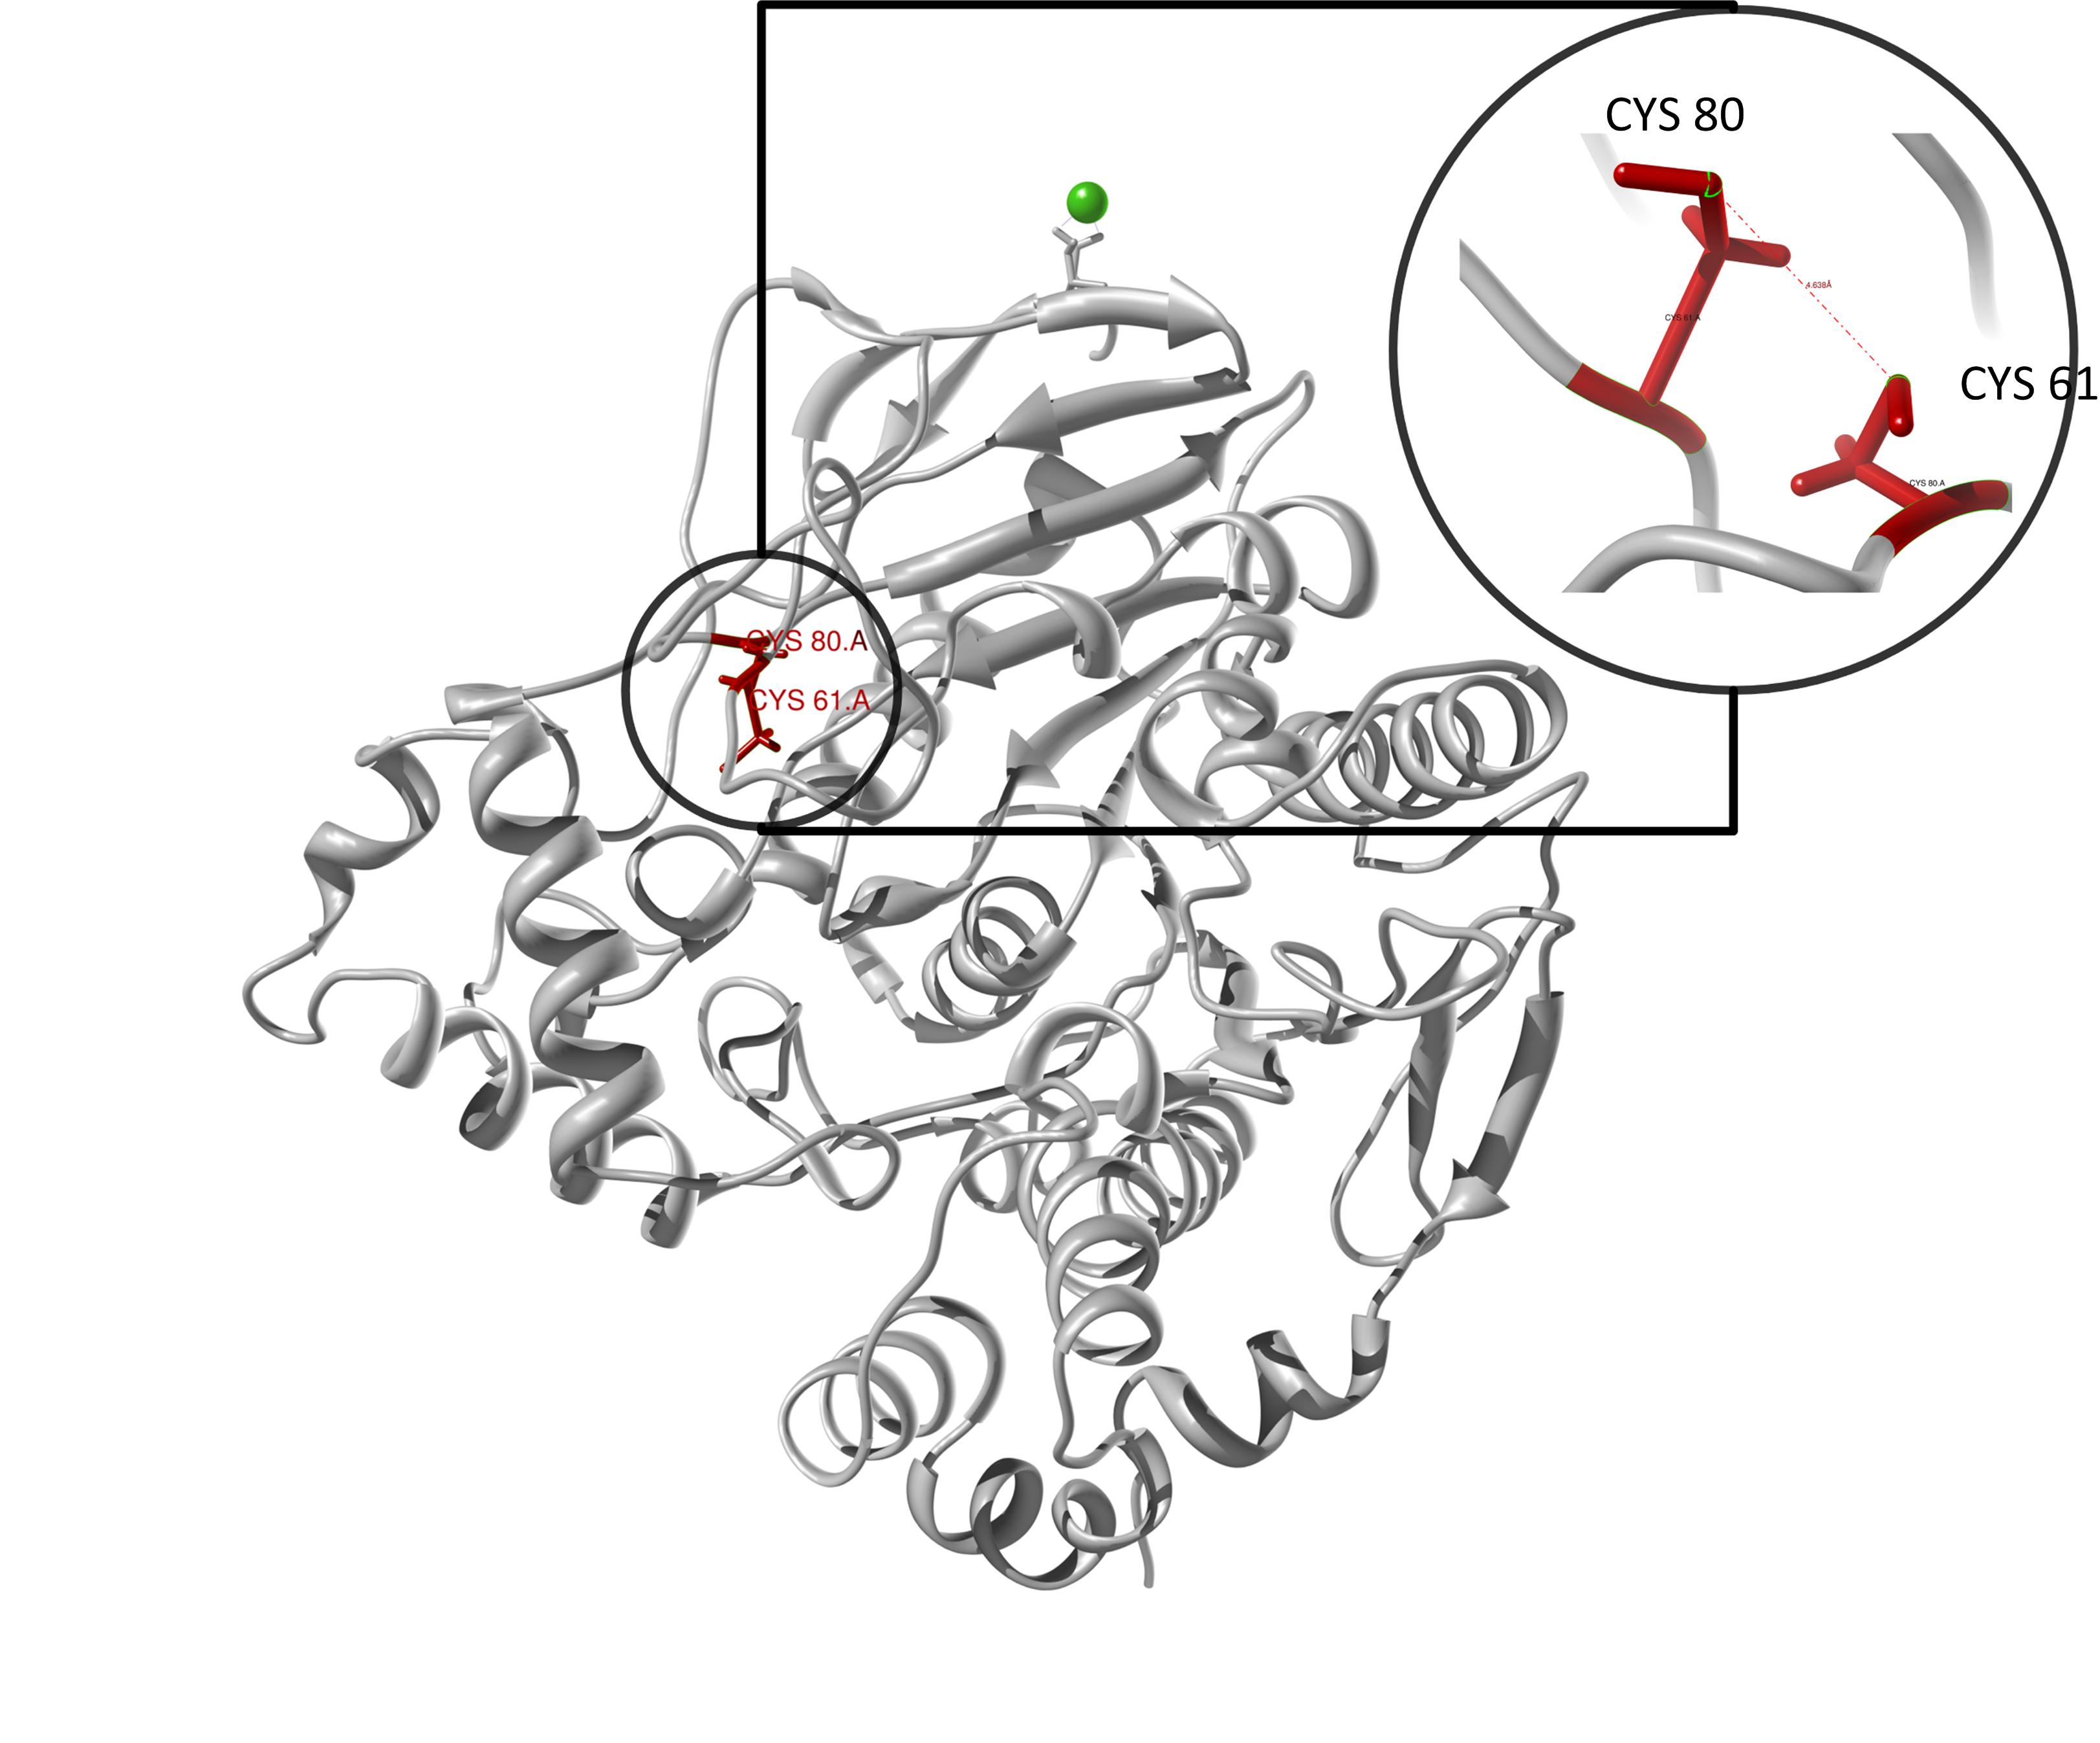
Here we show our hybrid homology model of our protein, the PnB-Esterase 13 in ribbon representation. Furthermore we illustrate the average quality z-score as a function of residue number. Nevertheless it was subjected to a final round of simulated annealing minimization in explicit solvent and obtained the following quality Z-scores:
| Check type | Quality Z-score | Comment |
|---|---|---|
| Dihedrals | -0.201 | Optimal |
| Packing 1D | -0.834 | Good |
| Packing 3D | -1.106 | Satisfactory |
| Overall | -0.661 | Good |
Hence we constructed a homology model we are able to localize a possible disulfide bond between CYS 80 and CYS 61 (highlighted in the structure above). For the identification of the active site visit our information theory section. Moreover, we quantified mechanical properties with a GNM .
AroY
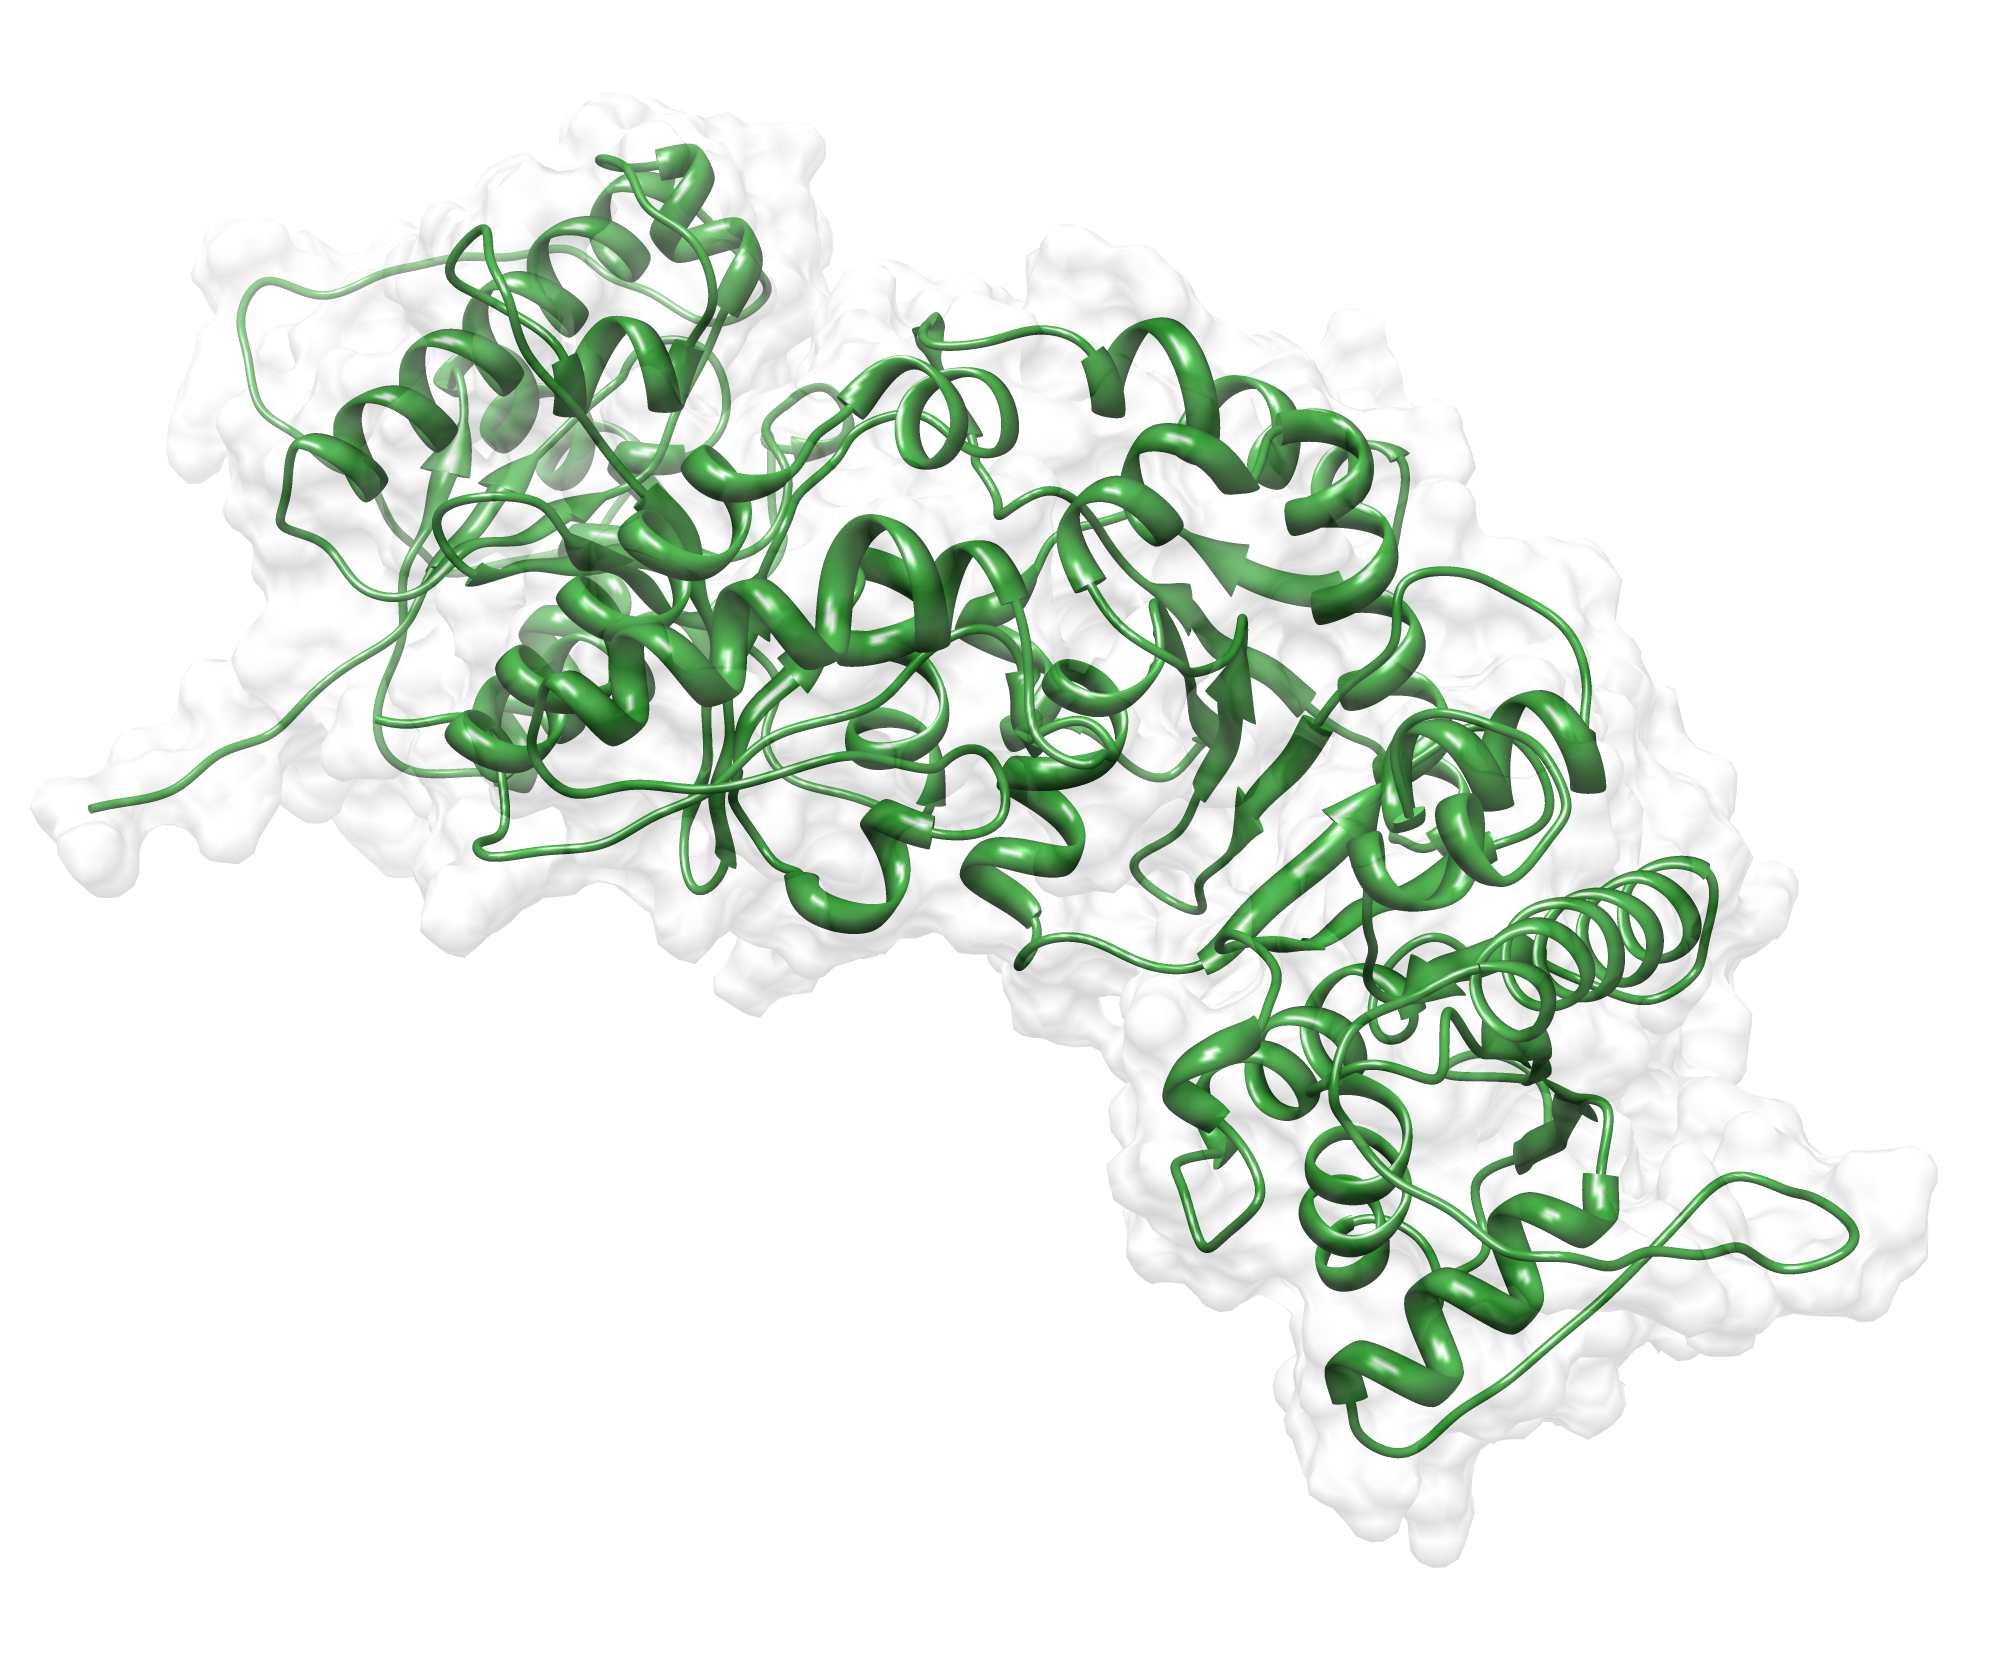
The target sequence of the AroY 13 contains 490 residues in 1 molecule. Unfortunately, we found only one model template in the protein database. We used [http://www.rcsb.org/pdb/explore/explore.do?structureId=2IDB 2IDB] chain A, with a cover of 91%.
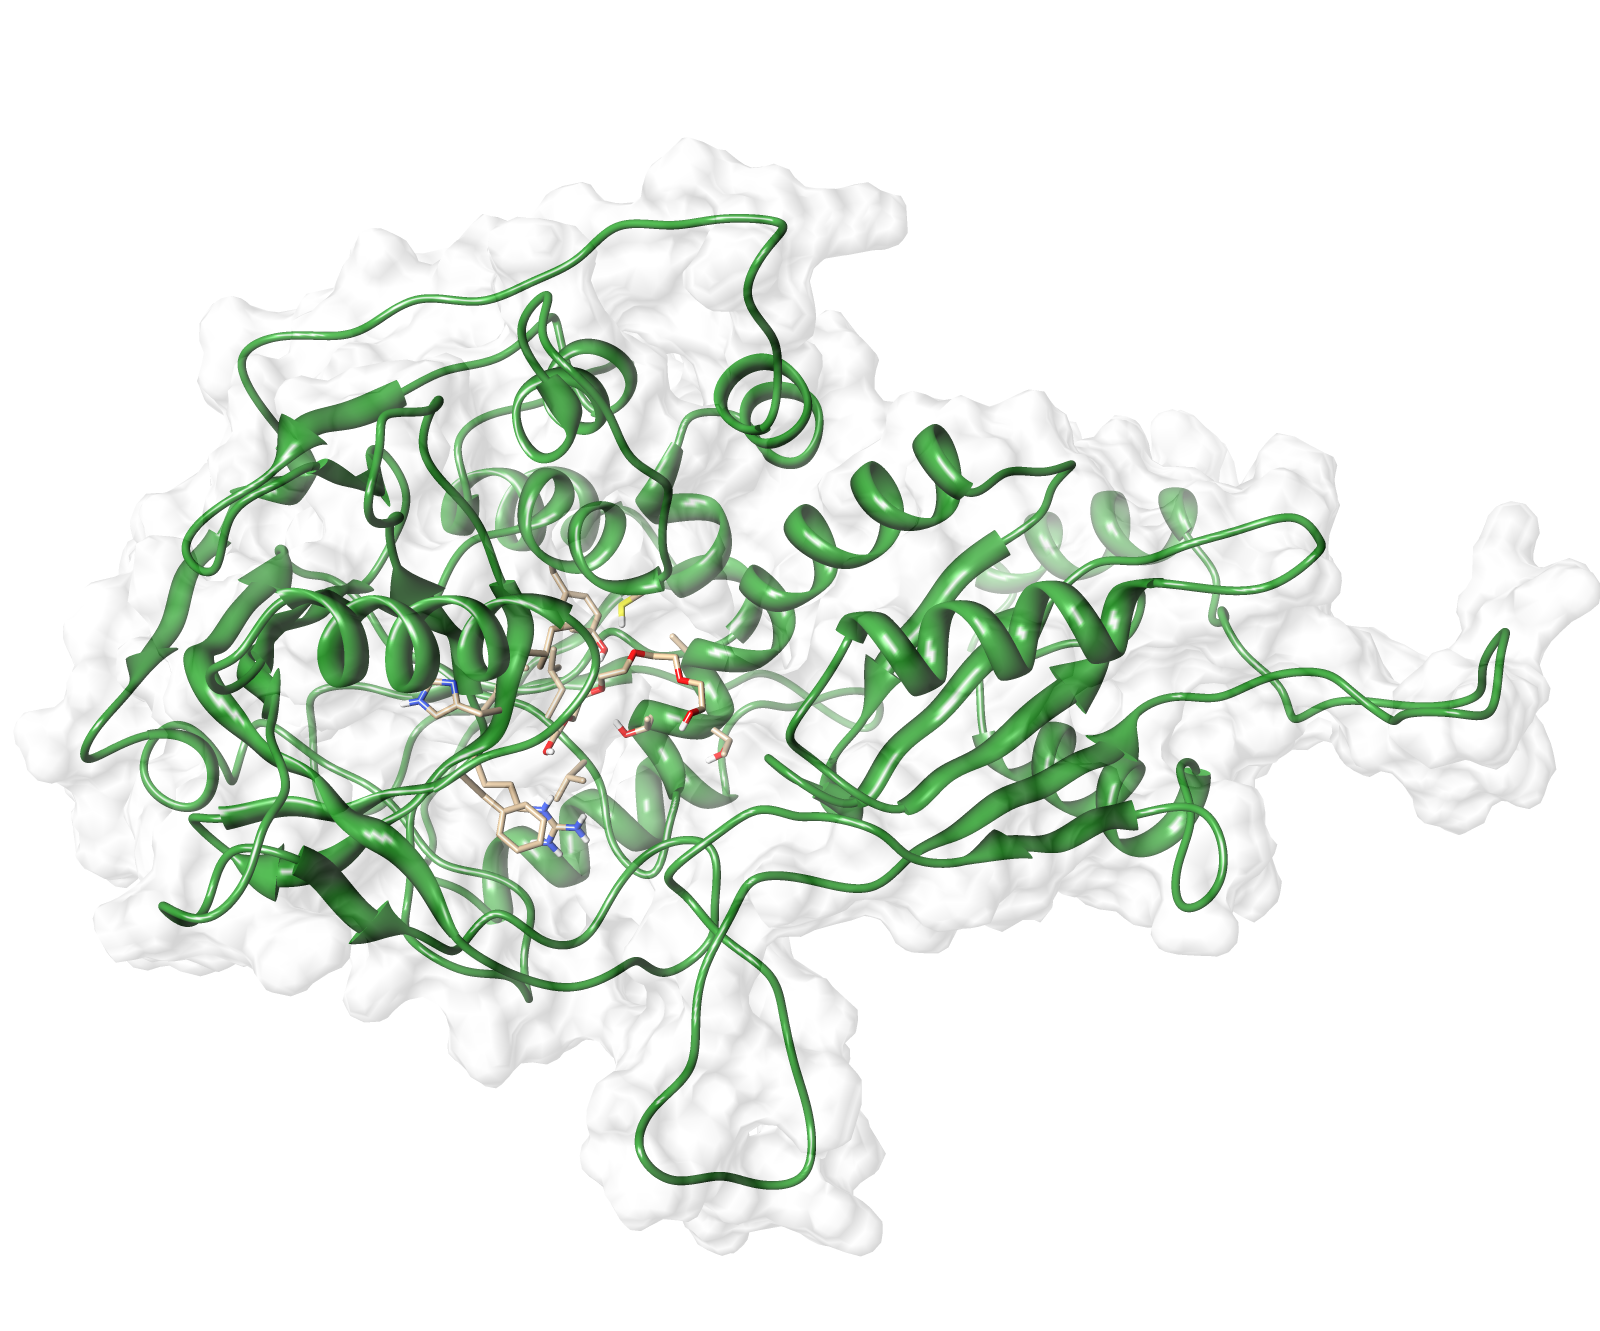
Here we show the hybrid homology model of our protein, AroY in ribbon representation with transparent surface. The average quality z-score is illustrated as a function of residue number. The overall results are listed in the tabular below.
| Check type | Quality Z-score | Comment |
|---|---|---|
| Dihedrals | 0.454 | Optimal |
| Packing 1D | -2.814 | Poor |
| Packing 3D | -2.382 | Poor |
| Overall | -2.139 | Poor |
Since the overall quality Z-scores was ranked poor by Yasara we refined the bonding-network and applied a simulated annealing energy minimization. The experimental results, obtained from the metabolism group, shown that aroY is an homo pentamer. Hence the template we used was a hetero trimer, we can explain the poor model scoring.Moreover, we quantified mechanical properties with a GNM.
TphA1
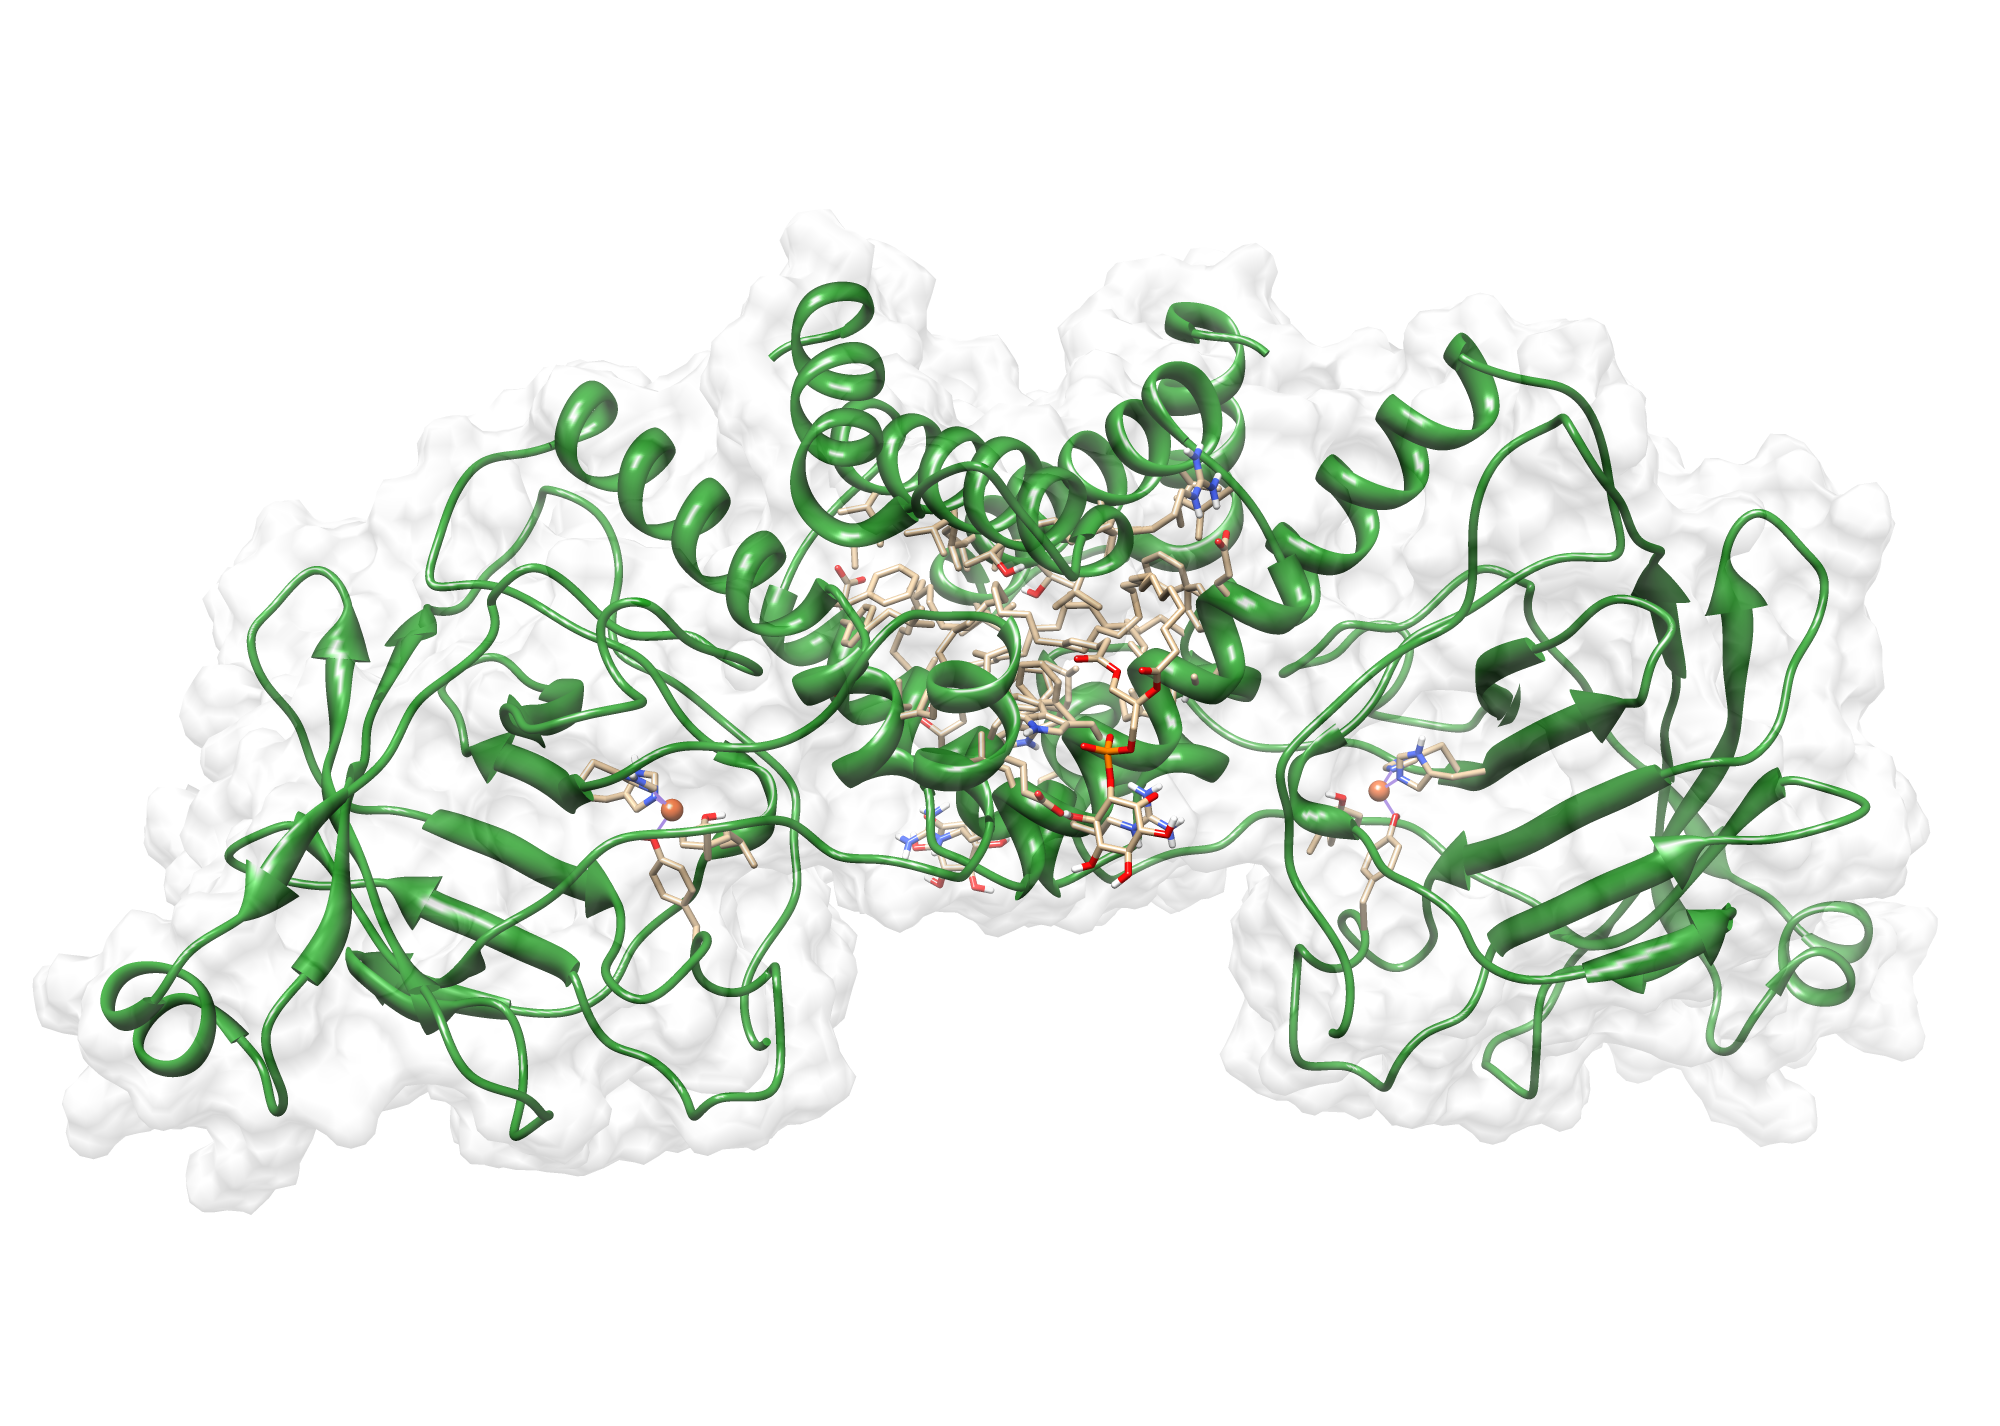
The target sequence of the TpHA1 contains 336 residues in one molecule. Hence the target sequence was the only available information we identified modeling templates by running various PSI-BLAST iterations. We used [http://www.rcsb.org/pdb/explore/explore.do?structureId=1KRH 1KRH] (Rieske dioxygenase reductase) chains A to F as modeling templates, with 97% cover. Additionally we created a hybrid model out of the best parts of all models. Since this hybrid model scored better than all previous models, it was chosen as our homology model.
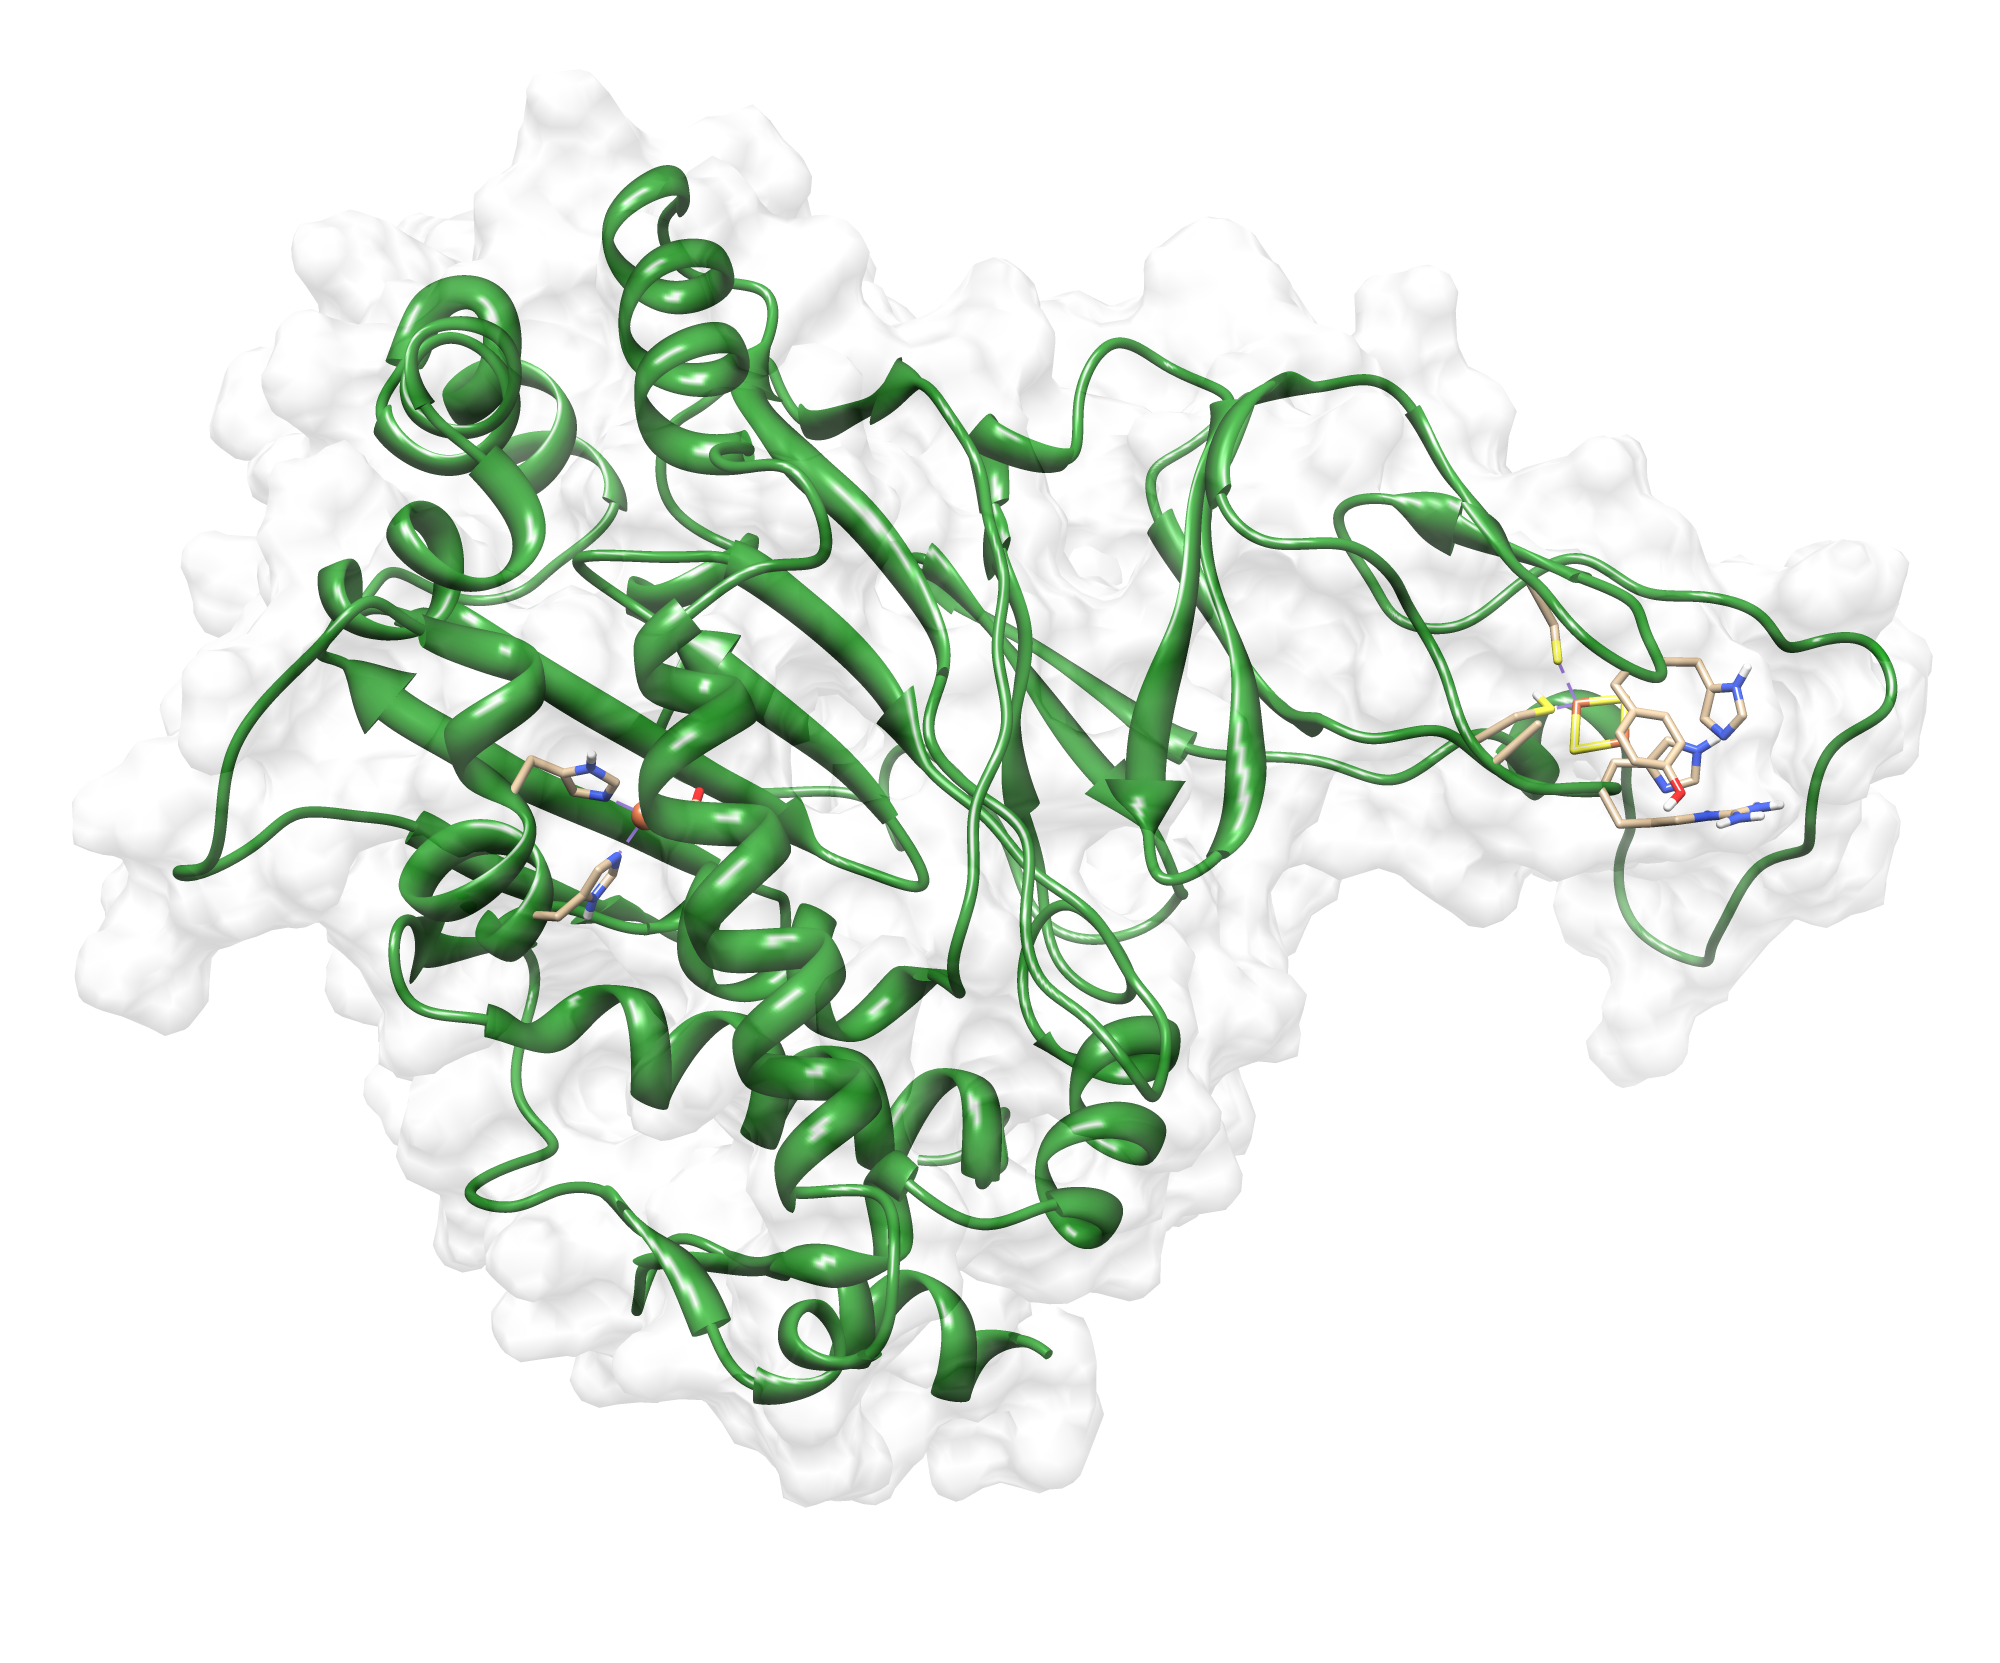
Here we show our hybrid homology model of our protein, the TpHA1 in ribbon representation with a transparent molecular surface. Hence Rieske dioxygenase reductase are iron-sulfur protein (ISP) we focused on rebuilding the iron-sulfur cluster. Furthermore, we illustrate the average quality z-score as a function of residue number. The average scores, we obtained from Yasara, from our model seems to be satisfying.
| Check type | Quality Z-score | Comment |
|---|---|---|
| Dihedrals | 1.162 | Optimal |
| Packing 1D | -1.728 | Satisfactory |
| Packing 3D | -1.949 | Satisfactory |
| Overall | -1.412 | Satisfactory |
TphA2
The target sequence of TphA2 contains 413 residues in 1 molecule. Interestingly, we found over 70 model templates in the protein database but the overall scoring of all models seems to be very bad. Hence we used the only template with an appropriated scoring , [http://www.rcsb.org/pdb/explore/explore.do?structureId=2YFI 2YFI] chain F , with an cover of 95%.
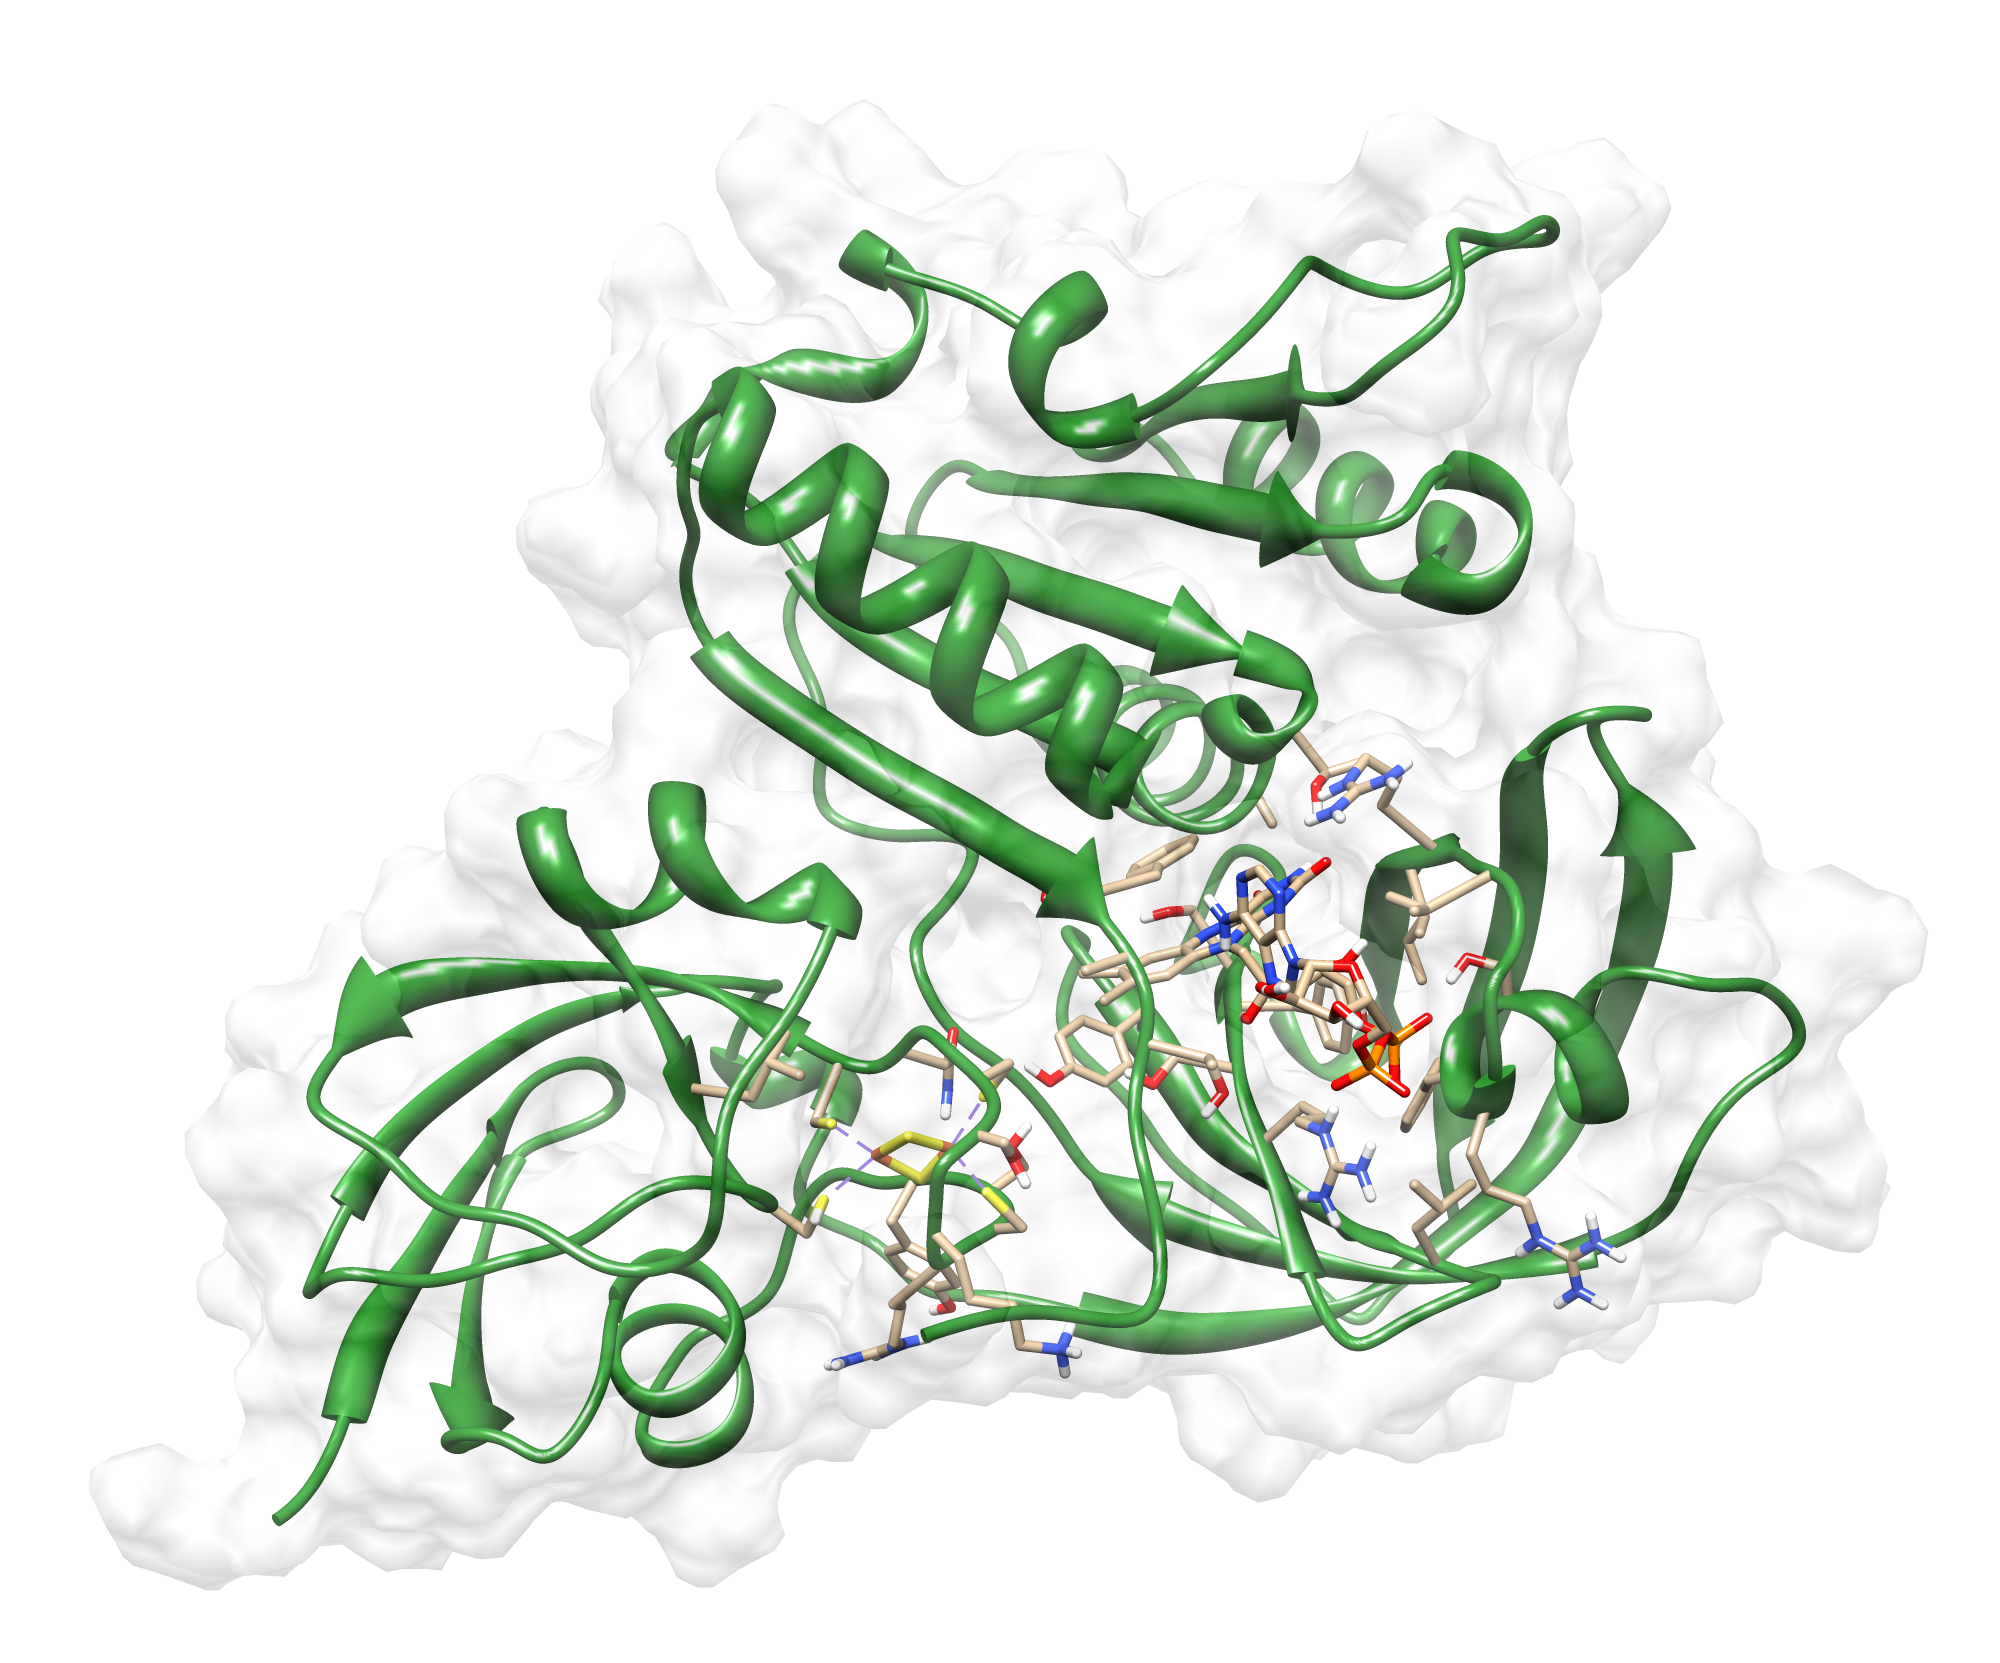
Here we show our hybrid homology model of our protein, TphA2 in ribbon representation with transparent surface. Furthermore we illustrate the average quality z-score as a function of residue number. The total results are listed in the tabular below.
| Check type | Quality Z-score | Comment |
|---|---|---|
| Dihedrals | 0.276 | Optimal |
| Packing 1D | -2.118 | Poor |
| Packing 3D | -2.515 | Poor |
| Overall | -1.955 | Satisfactory |
TphA3
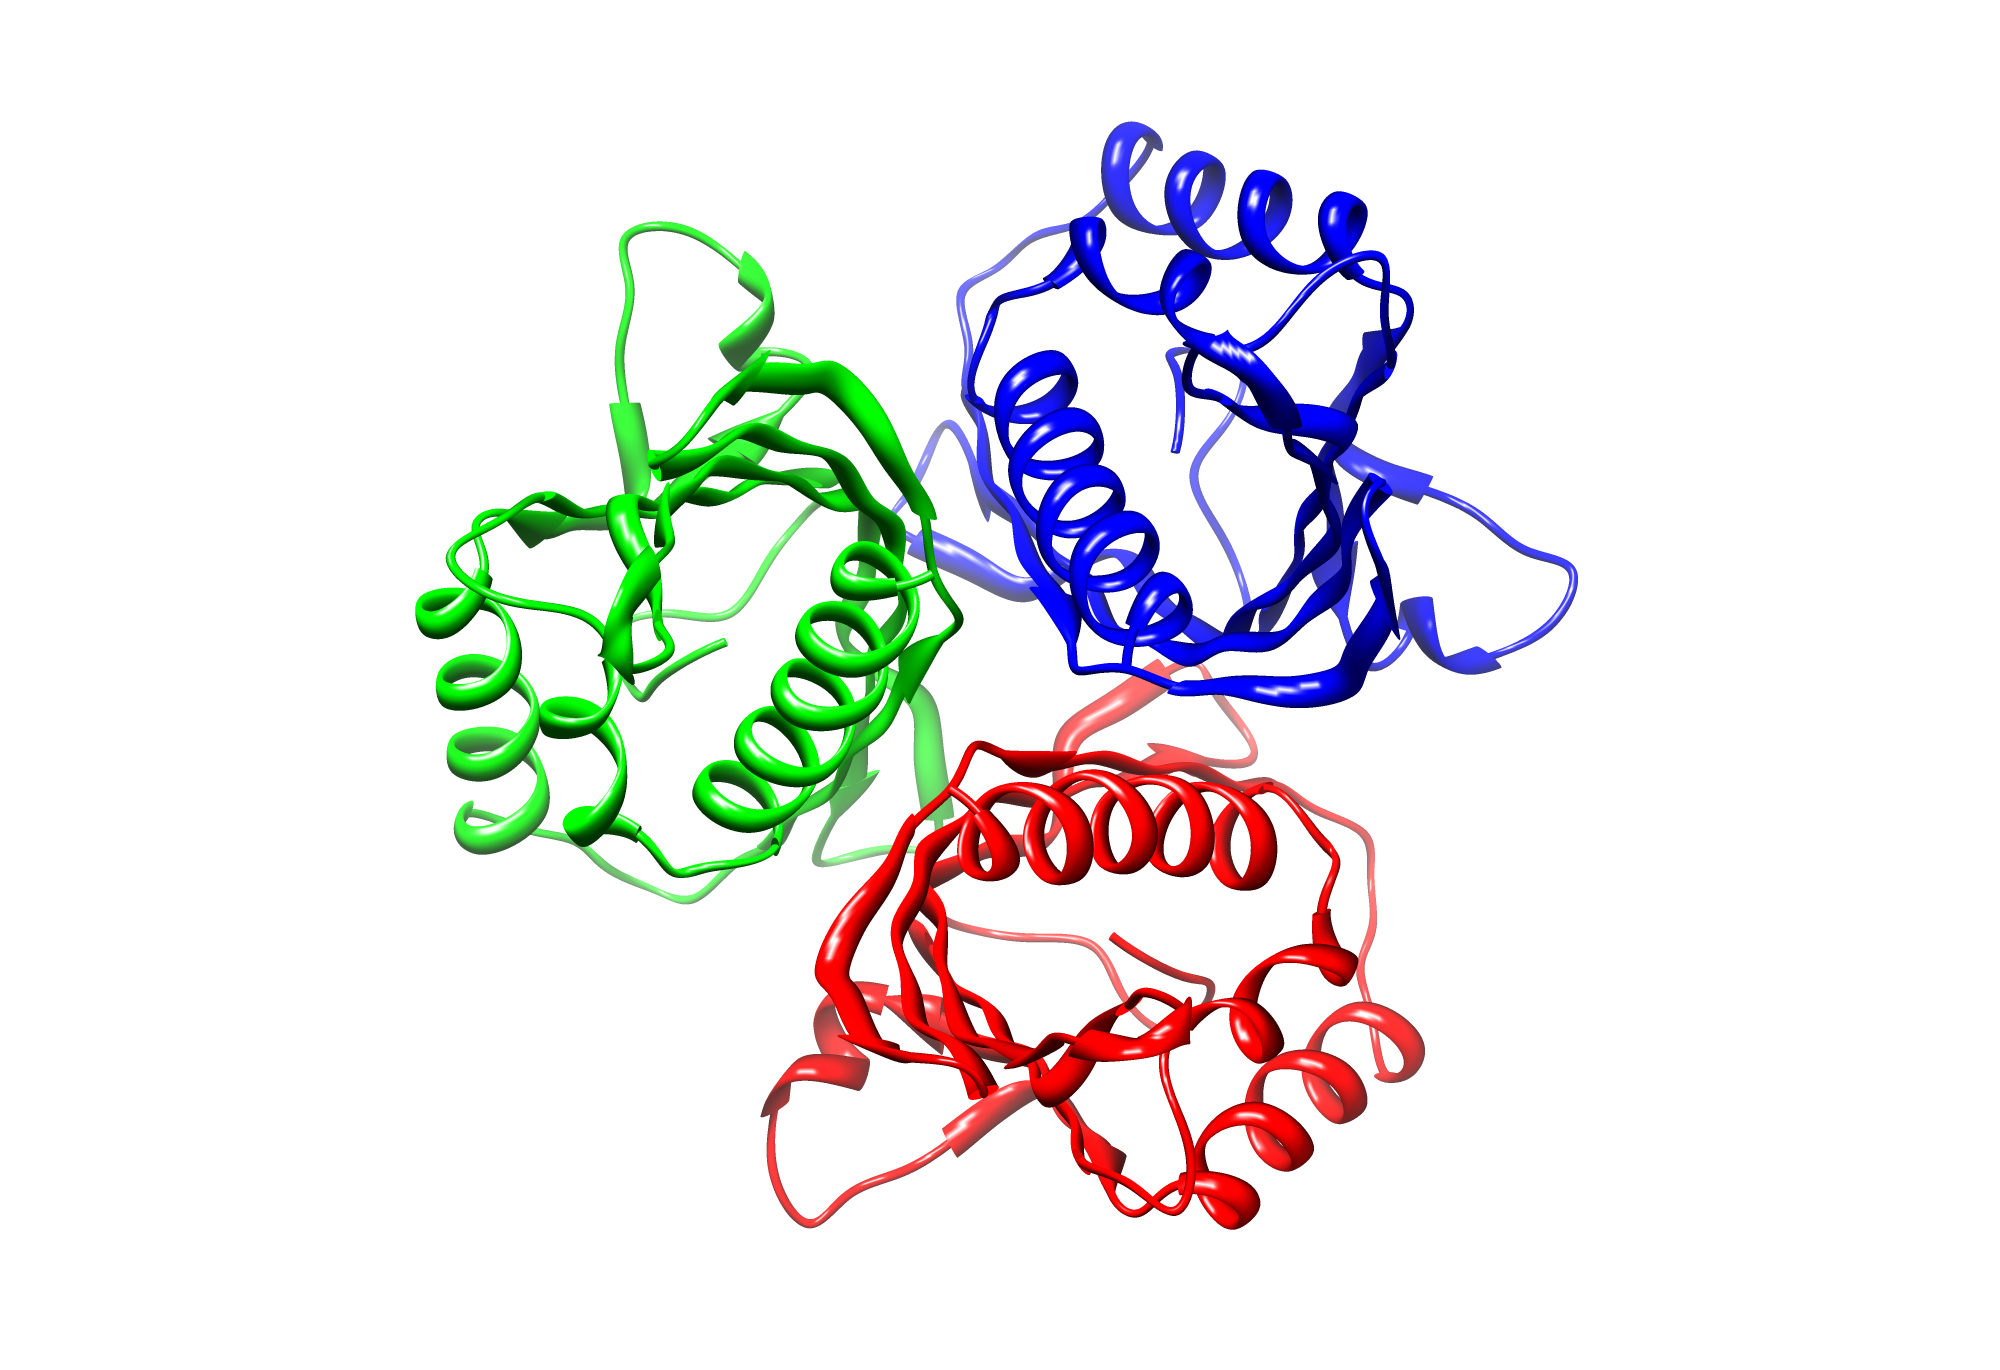
The target sequence of TphA3 contains 154 residues in one molecule. We only found one model template in the protein database. We used [http://www.rcsb.org/pdb/explore/explore.do?structureId=3EBY 3EBY], with a cover of 91%. Interestingly, the model was in a trimeric state so we reconstructed it in our model below.
Here we show the hybrid homology model of our protein, TphA3 in ribbon representation in a trimeric state. Furthermore we illustrate the average quality z-score as a function of residue number. The overall results are listed in the tabular below.
| Check type | Quality Z-score | Comment |
|---|---|---|
| Dihedrals | 1.550 | Optimal |
| Packing 1D | -0.966 | Good |
| Packing 3D | -1.081 | Satisfactory |
| Overall | -0.655 | Good |
Wet-lab results proofed the oligomeric state with FPLC analysis. Notably, we successfully proposed the oligomeric state for TphA1 acting as a trimer!
TphB
The target sequence of TphB contains 315 residues in one molecule. We found only one model templates in the protein database. We used [http://www.rcsb.org/pdb/explore/explore.do?structureId=2HI1 2HI1], with a cover of 99%! Since, the template was a dimer we constructed a dimer too.
Here we show our hybrid homology model of our protein, TpHB in ribbon representation with transparent surface. Furthermore we illustrate the average quality z-score as a function of residue number. The overall results are listed in the tabular below.
| Check type | Quality Z-score | Comment |
|---|---|---|
| Dihedrals | 0.873 | Optimal |
| Packing 1D | -2.466 | Poor |
| Packing 3D | -1.286 | Satisfactory |
| Overall | -0.1433 | Satisfactory |
Extensive wet-lab analysis proved the oligomeric state as a dimer. Similar to TphA3, again, we could propose the correct oligomeric state.
Xyle
The target sequence of XylE contains 305 residues in one molecule. We found 17 model templates in the protein database. We used [http://www.rcsb.org/pdb/explore/explore.do?structureId=2XSV 2XSV], [http://www.rcsb.org/pdb/explore/explore.do?structureId=2XSR 2XSR] , with an cover of over 95%! Since, the template was a dimer we constructed a dimer too.
Here we show our hybrid homology model of our protein, XylE in ribbon representation with transparent surface. Furthermore we illustrate the average quality z-score as a function of residue number. The overall results are listed in the tabular below.
| Check type | Quality Z-score | Comment |
|---|---|---|
| Dihedrals | 0.873 | Optimal |
| Packing 1D | -2.466 | Satisfactory |
| Packing 3D | -1.286 | Satisfactory |
| Overall | -0.1433 | Satisfactory |
For xyle we got a wonderful per-residue scoring. Here only the loop regions are problematic during our modeling approach.
References
[1] E. Krieger, G. Koraimann, and G. Vriend, “Increasing the precision of comparative models with YASARA NOVA--a self-parameterizing force field.,” Proteins, vol. 47, no. 3, pp. 393–402, 2002.
[2] S. F. Altschul, T. L. Madden, A. A. Schäffer, J. Zhang, Z. Zhang, W. Miller, and D. J. Lipman, “Gapped BLAST and PSI-BLAST: a new generation of protein database search programs.,” Nucleic Acids Res, vol. 25, no. 17, pp. 3389–3402, Sep. 1997.
[3] R. W. Hooft, G. Vriend, C. Sander, and E. E. Abola, “Errors in protein structures.,” Nature, vol. 381, no. 6580. Nature Publishing Group, p. 272, 1996.
[4] D. T. Jones, “Protein secondary structure prediction based on position-specific scoring matrices,” Journal of Molecular Biology, vol. 292, no. 2, pp. 195–202, 1999.
[5] A. A. Canutescu, A. A. Shelenkov, and R. L. Dunbrack, “A graph-theory algorithm for rapid protein side-chain prediction.,” Protein Science, vol. 12, no. 9, pp. 2001–2014, 2003.
[6] E. Krieger, K. Joo, J. Lee, J. Lee, S. Raman, J. Thompson, M. Tyka, D. Baker, and K. Karplus, “Improving physical realism, stereochemistry, and side-chain accuracy in homology modeling: Four approaches that performed well in CASP8.,” Proteins, vol. 77 Suppl 9, no. June, pp. 114–122, 2009.
[7] http://www.yasara.org/homologymodeling.htm
 "
"

