Team:UT-Tokyo/Project/H2 E.coli/Results
From 2012.igem.org
H2 E.coli: Results

このページの概要を、簡単に記述。
Result
We measured the amount of H₂ produced by E.coli transformed with either “pLac-RBS-fhlA-d.term”(fhlA) or “pLac-RBS-fhlA(E363G)-d.term”(E363G) by the method written in the page “Assay”. In this page, we describe the data.
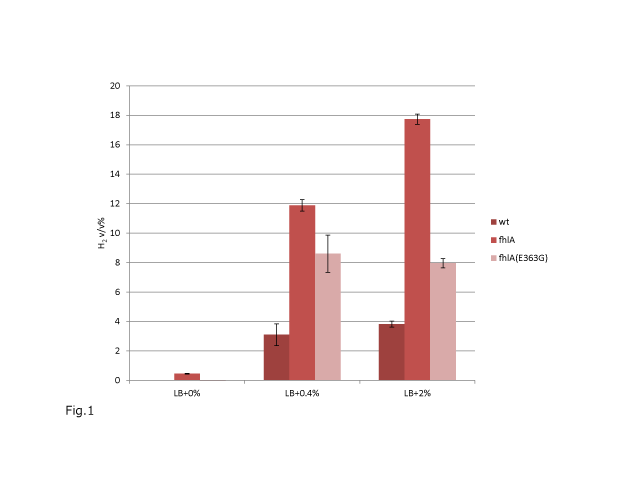
The result is the following (Fig.1)
Fig.1:H₂production in liquid LB medium containing the labeled glucose concentration. The vertical axis expresses v/v% of H₂ in the gaseous phase after we cultivate each E.coli for 8 hours in a container with 1mL each of LB medium and the gaseous phase .The horizontal axis shows the kinds of E.coli and the concentrations of glucose in each medium(“LB+x%” means the glucose w/v concentrations of liquid LB medium is x% more than the usual medium.
The results shown by the Fig.1 is statistically sufficient to conclude the followings. 1. The amount of H₂ production is fhlA>fhlA(E363G)>wild type in these conditions. 2. There is a positive correlation between the amount of H₂ produced by fhlA and the glucose concentration in the liquid LB.
The detailed interpretations of this result are done in the “Discussion”.Discussion.
 "
"


