Team:Columbia-Cooper-NYC/Data and Conclusions
From 2012.igem.org
(→Data and Conclusions) |
(→Data and Conclusions) |
||
| Line 189: | Line 189: | ||
[[File:liquid_media.png|600px|thumb|center|Figure 1]] | [[File:liquid_media.png|600px|thumb|center|Figure 1]] | ||
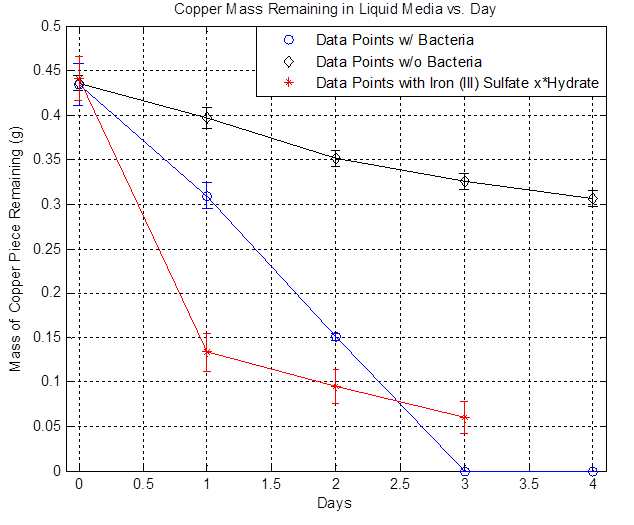
| - | The plot above shows the remaining mass of the copper vs. days. The black line represents the data without bacteria and the decrease in copper mass over time indicates that there is some sort of background etching, which is due to side reactions happening such as the oxidation of copper from air. The blue line represents the data with bacteria and it shows that the copper mass decreased to zero after day 3. The red line represents the data with iron (III) sulfate hydrate and it shows that a significant drop in copper mass after Day 1 compared to the bacteria line because of the immediate availability of iron (III) ions. However, the rate of decrease slows down over time because iron (III) ions are depleted. In the case of bacteria, the iron (II) ions present in the media is converted to iron (III) ions from the bacteria's mechanism, the iron (III) reacts with copper and regenerates iron (II), and iron (II) can be converted to iron (III) once again from the bacteria, resulting in a self-sustaining cycle that eventually depletes all of the copper. | + | The plot above shows the remaining mass of the copper vs. days. The black line represents the data without bacteria and the decrease in copper mass over time indicates that there is some sort of background etching, which is due to side reactions happening such as the oxidation of copper from air. The blue line represents the data with bacteria and it shows that the copper mass decreased to zero after day 3. The red line represents the data with iron (III) sulfate hydrate and it shows that a significant drop in copper mass after Day 1 compared to the bacteria line because of the immediate availability of iron (III) ions. However, the rate of decrease slows down over time because iron (III) ions are depleted. In the case of bacteria, the iron (II) ions present in the media is converted to iron (III) ions from the bacteria's mechanism, the iron (III) reacts with copper and regenerates iron (II), and iron (II) can be converted to iron (III) once again from the bacteria, resulting in a self-sustaining cycle that eventually depletes all of the copper. Thus, the data shows that the bacteria can etch copper in liquid media. |
| - | + | ||
| + | Solid Media | ||
| + | |||
| + | In order to achieve controlled etching, liquid media cannot be used because the bacteria is mobile. Therefore, solid media is explored. (Refer to [https://2012.igem.org/Team:Columbia-Cooper-NYC/Making_Solid_Media Solid Media Protocol] for solutions used and how to make solid media.) 15 mL of solid media are poured onto a petri dish and a piece of 2 cm x 2 cm copper is placed inside the media and allowed to harden. | ||
[[File:solid_media_only.png|600px|thumb|center|Figure 2]] | [[File:solid_media_only.png|600px|thumb|center|Figure 2]] | ||
Revision as of 03:04, 27 October 2012
Data and Conclusions
Liquid Media
As mentioned in the Overview, Acidithiobacillus Ferrooxidans have the ability to oxidize iron (II) to iron (III) and the iron (III) can go through a redox reaction with copper to solubilize copper, which is the goal. But this mechanism only works in aerobic conditions. Therefore, to properly induce mass transfer of oxygen from the media to the bacteria, flasks containing the liquid media and bacteria are placed in a shaker at 220 rpm and room temperature. The copper used in these experiments are 2 cm x 2 cm pieces, 5 mils thick ((computer paper thickness), and 99.9% pure. Individual copper pieces were placed in flasks containing 100 mL of liquid media and either bacteria, no bacteria, or iron (III) sulfate hydrate. These flasks were left in the shaker for four days and copper mass measurements were taken daily in triplicate. The copper piece were massed after cleaning with deionized water and 70% ethanol followed by returning them back to their respective flasks. Note that A. Ferrooxidans undergo a 20 hour lag phase before growth can start.
The plot above shows the remaining mass of the copper vs. days. The black line represents the data without bacteria and the decrease in copper mass over time indicates that there is some sort of background etching, which is due to side reactions happening such as the oxidation of copper from air. The blue line represents the data with bacteria and it shows that the copper mass decreased to zero after day 3. The red line represents the data with iron (III) sulfate hydrate and it shows that a significant drop in copper mass after Day 1 compared to the bacteria line because of the immediate availability of iron (III) ions. However, the rate of decrease slows down over time because iron (III) ions are depleted. In the case of bacteria, the iron (II) ions present in the media is converted to iron (III) ions from the bacteria's mechanism, the iron (III) reacts with copper and regenerates iron (II), and iron (II) can be converted to iron (III) once again from the bacteria, resulting in a self-sustaining cycle that eventually depletes all of the copper. Thus, the data shows that the bacteria can etch copper in liquid media.
Solid Media
In order to achieve controlled etching, liquid media cannot be used because the bacteria is mobile. Therefore, solid media is explored. (Refer to Solid Media Protocol for solutions used and how to make solid media.) 15 mL of solid media are poured onto a petri dish and a piece of 2 cm x 2 cm copper is placed inside the media and allowed to harden.
From this data we were able to conclude the following copper consumption rates:
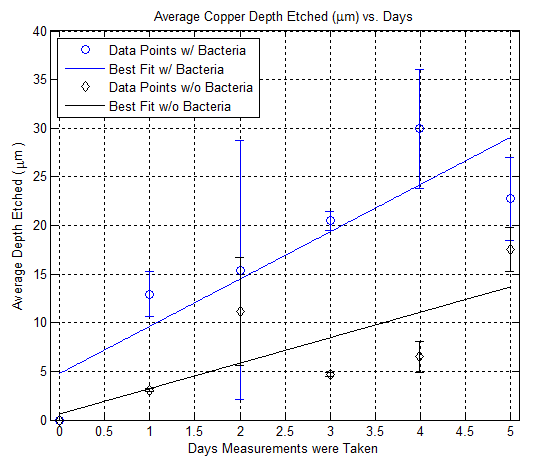
Here is a plot showing the depth etch rate of copper using nail polish as a mean to control etching:
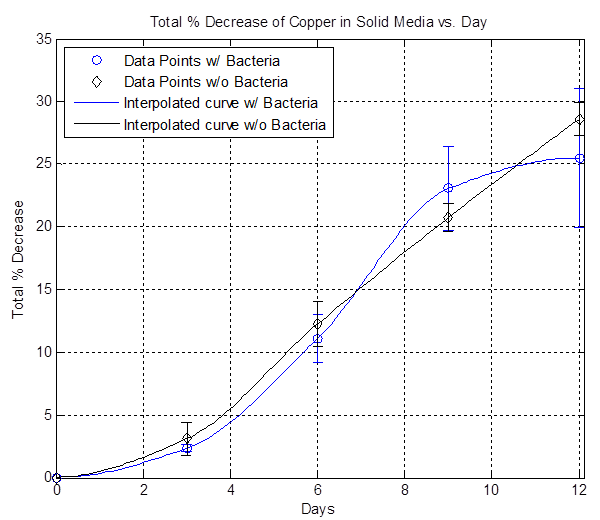
Here is a plot showing the average percent copper lost due solely to the bacteria for different amounts of liquid media on solid media. Note that this doesn't work for the 1 mL case because of the negative %:
The Copper team has further refined their experiments by adding more controls and nuances to the existing experiments in order to collect more refined data which is detailed in the notebook, however the major results are summarized here.
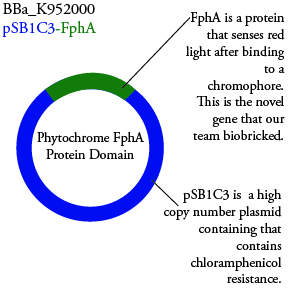
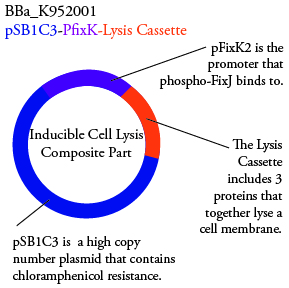
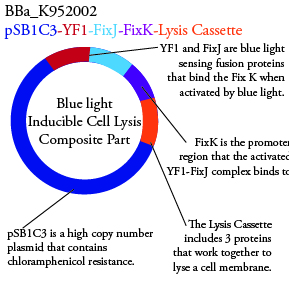
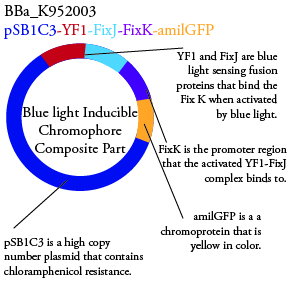
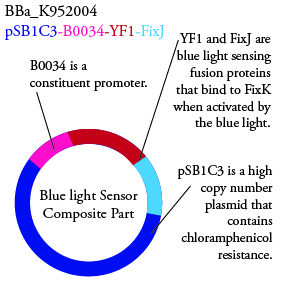
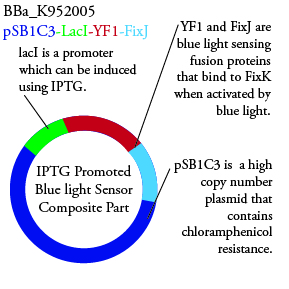
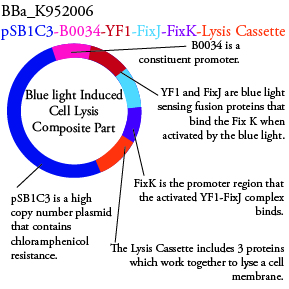
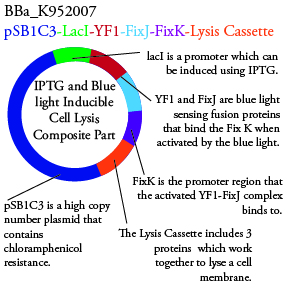
The genetics group has submitted each of the following plasmids to the parts registry:
.
.
.
.
.
. We plan to characterize parts BBa_K952006 and BBa_K952007 in ecoli.
For BBa_K95006 we can grow the cells in the absence of IPTG, then add the IPTG and shine blue light onto the culture to induce expression of the lysis cassette killing the cells. We will run 2 controls, the first we will add IPTG but keep the cells in the dark and the second we will shine blue light on the cells in the absence of IPTG. Neither of the controls should cause apoptosis while the culture with both promotors present should.
For BBa_K95007 we do not have the addition IPTG promotor present so we will grow the cells in the absence of light, then shine blue light on it to cause cell death. As controls we can attempt to grow the cells in the ambient light of the lab, under red light, and then shine blue light on these cultures if they grow. This is provide information on how sensative the system is to blue light. Ideally the cells would be able to grow in the ambient light of the lab with out inducing cell lysis however we do not expect this to be the case.
 "
"
