Team:Columbia-Cooper-NYC/Data and Conclusions
From 2012.igem.org
(→Data and Conclusions) |
(→Data and Conclusions) |
||
| Line 193: | Line 193: | ||
[[File:table3.png|600px|thumb|center|Figure 3]] | [[File:table3.png|600px|thumb|center|Figure 3]] | ||
| + | Here is a plot showing the depth etch rate of copper using nail polish as a mean to control etching: | ||
| + | [[File:depth.png|600px|thumb|center|Figure 4]] | ||
| + | |||
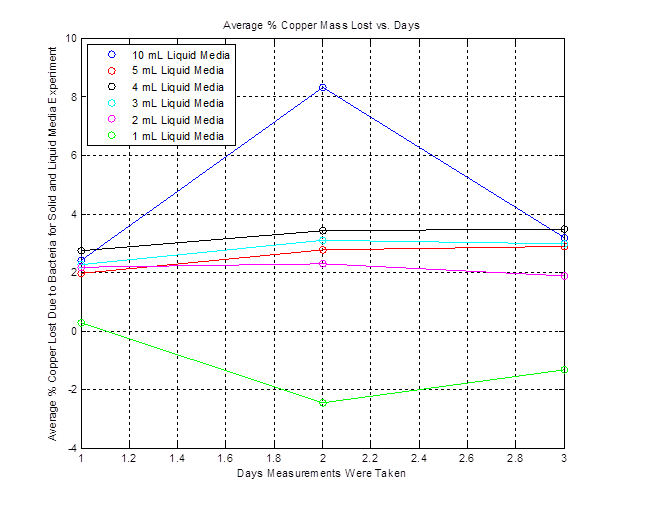
| + | Here is a plot showing the average percent copper lost due solely to the bacteria for different amounts of liquid media on solid media. Note that this doesn't work for the 1 mL case because of the negative %: | ||
| + | [[File:liq_media.png|600px|thumb|center|Figure 3]] | ||
The Copper team has further refined their experiments by adding more controls and nuances to the existing experiments in order to collect more refined data which is detailed in the notebook, however the major results are summarized here. | The Copper team has further refined their experiments by adding more controls and nuances to the existing experiments in order to collect more refined data which is detailed in the notebook, however the major results are summarized here. | ||
Revision as of 04:07, 4 October 2012
Data and Conclusions
The liquid media that Ferrooxidans thrive in is acidic so the copper team first started working on proving that the bacteria are doing the etching, not just the media. Our initial results were somewhat inconclusive, however the data showed that at certain time intervals the bacteria etched faster than the basal rate (see work from 7/7-7/17 on Copper Etching page under Results):
By furthur refining our experiments as described in the cooper notebook we were able to show that copper is in fact etched faster in the presence of A. Ferrooxidans than the basal rate of etching by the acidic liquid media (see the work done 7/18-7/23 on Copper Etching page under Results):
From this data we were able to conclude the following copper consumption rates:
Here is a plot showing the depth etch rate of copper using nail polish as a mean to control etching:
Here is a plot showing the average percent copper lost due solely to the bacteria for different amounts of liquid media on solid media. Note that this doesn't work for the 1 mL case because of the negative %:
The Copper team has further refined their experiments by adding more controls and nuances to the existing experiments in order to collect more refined data which is detailed in the notebook, however the major results are summarized here.
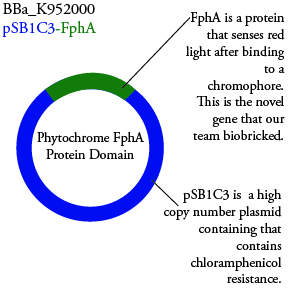
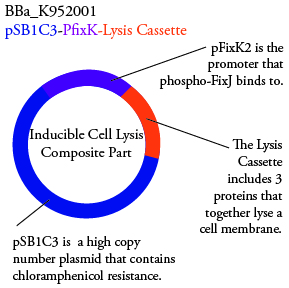
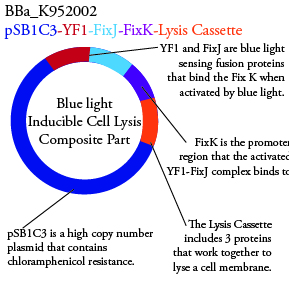
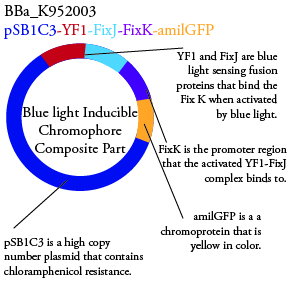
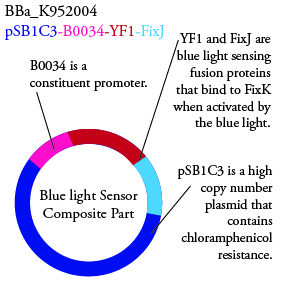
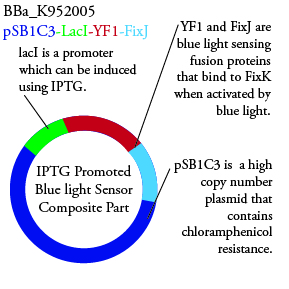
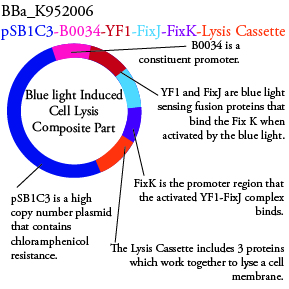
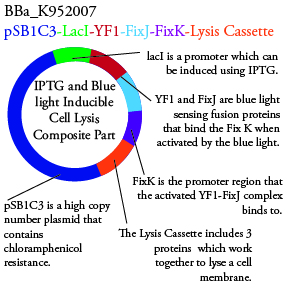
The genetics group has submitted each of the following plasmids to the parts registry:
.
.
.
.
.
. We plan to characterize parts BBa_K952006 and BBa_K952007 in ecoli.
For BBa_K95006 we can grow the cells in the absence of IPTG, then add the IPTG and shine blue light onto the culture to induce expression of the lysis cassette killing the cells. We will run 2 controls, the first we will add IPTG but keep the cells in the dark and the second we will shine blue light on the cells in the absence of IPTG. Neither of the controls should cause apoptosis while the culture with both promotors present should.
For BBa_K95007 we do not have the addition IPTG promotor present so we will grow the cells in the absence of light, then shine blue light on it to cause cell death. As controls we can attempt to grow the cells in the ambient light of the lab, under red light, and then shine blue light on these cultures if they grow. This is provide information on how sensative the system is to blue light. Ideally the cells would be able to grow in the ambient light of the lab with out inducing cell lysis however we do not expect this to be the case.
 "
"


