Team:Cambridge/Lab book/Week 14
From 2012.igem.org
(→Monday (24/09/12)) |
(→Tuesday (25/09/12)) |
||
| Line 30: | Line 30: | ||
===Tuesday (25/09/12)=== | ===Tuesday (25/09/12)=== | ||
| + | |||
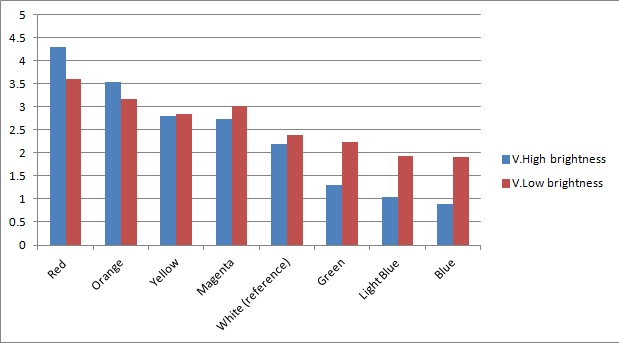
| + | The sensitivity of the sensor concerning different frequencies (colours) of light was tested as well. As can be seen below, measurements taken from orange and blue light yield values respectively above and below those from white light (our reference point). The data was taken using a constant intensity of light for each case (V.High and V.Low brightness). This was done with the aid of an Android phone and a specialised software application, called Color Flashlight, downloaded from the official Market. | ||
| + | [[File:Sensor_colour.jpg|400px|Sensor data for different colours at different intensities|thumb|center]] | ||
===Wednesday (26/09/12)=== | ===Wednesday (26/09/12)=== | ||
Revision as of 20:23, 26 September 2012
| Week: | 3 | 4 | 5 | 6 | 7 | 8 | 9 | 10 | 11 | 12 | 13 | 14 |
|---|
Contents |
Monday (24/09/12)
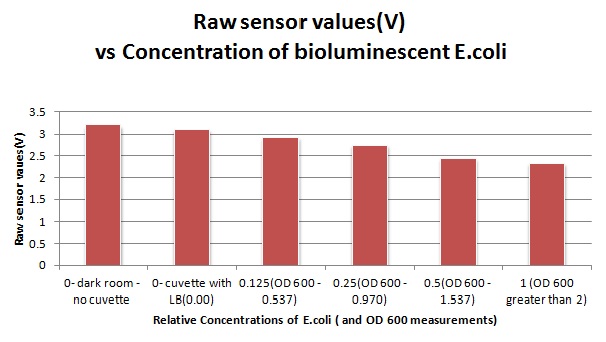
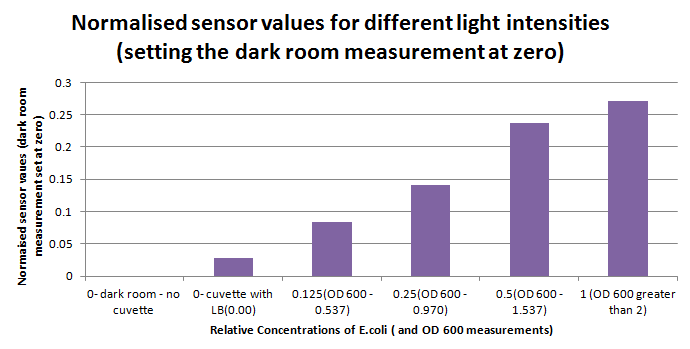
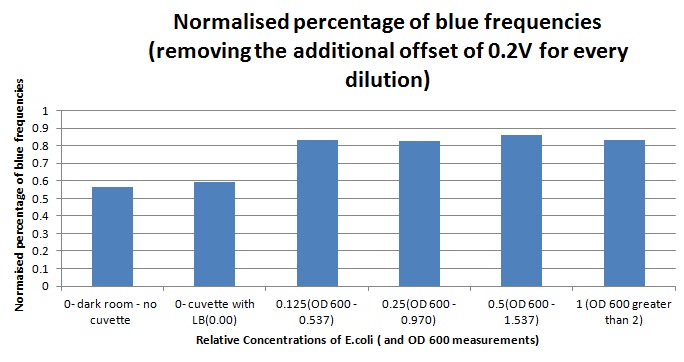
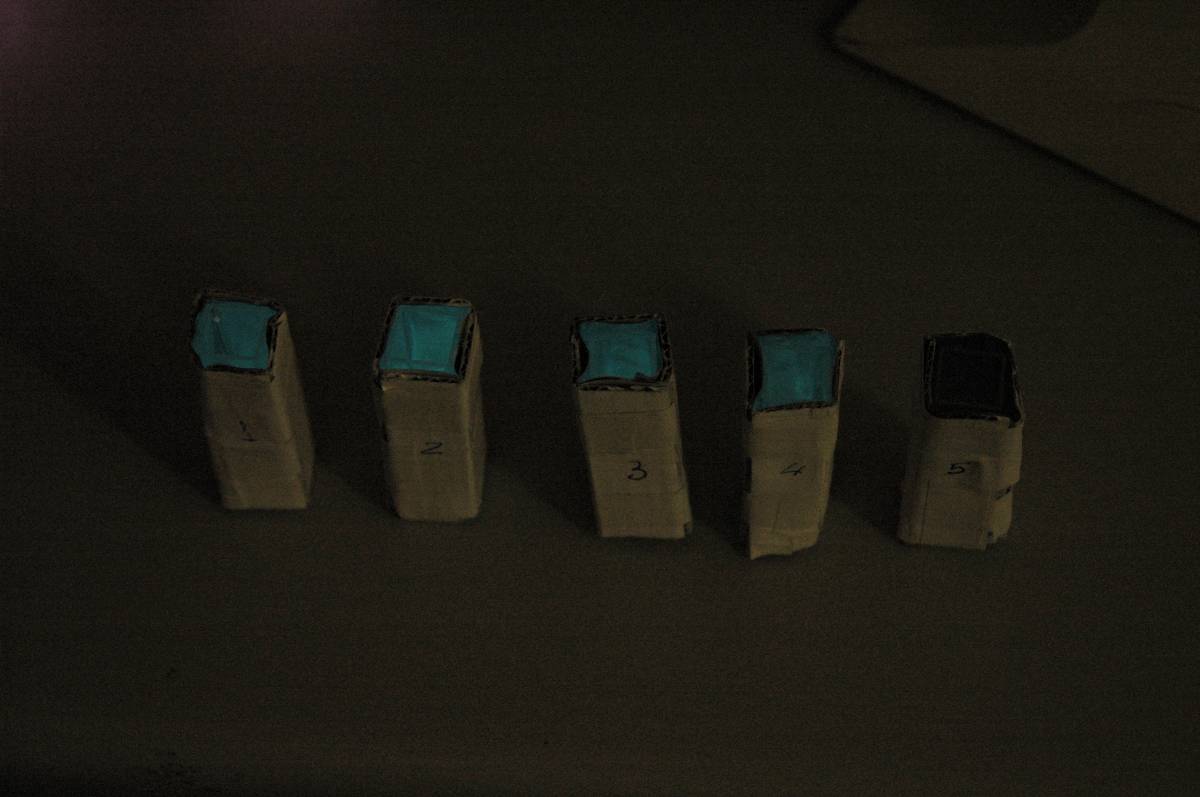
The sensitivity of the sensor concerning light intensities was tested using a dilution series of luciferase-producing bacteria. 20ml Cultures were grown overnight from single colonies. The cultures were induced with 40ul of 1.5M arabinose (for a final concentration of 3mM). Cultures were left for 2 1/2 hours for full induction. Subsequently, a culture was pelleted and resuspended in 4ml LB. Doubling dilutions, of volume 2ml, were made from this concentrate, down to 1/8th concentration. 1ml of each 2ml dilution was analysed in each cuvette, which was placed in the cuvette holder we made ourselves.
Tuesday (25/09/12)
The sensitivity of the sensor concerning different frequencies (colours) of light was tested as well. As can be seen below, measurements taken from orange and blue light yield values respectively above and below those from white light (our reference point). The data was taken using a constant intensity of light for each case (V.High and V.Low brightness). This was done with the aid of an Android phone and a specialised software application, called Color Flashlight, downloaded from the official Market.
Wednesday (26/09/12)
Thursday (27/09/12)
Friday (28/09/12)
 "
"

